Analysis of Serum from Acute Leukemia Patients Using Surface-Enhanced Raman Spectroscopy (SERS)
In this paper, we show surface-enhanced Raman spectroscopy (SERS) of serum from acute leukemia and analyze the SERS through the multivariate statistical method of principal component analysis (PCA). First, the changes in the structure of proteins, lipids, carbohydrates, and other substances in the serum of patients with acute leukemia are analyzed from the molecular perspective. The results showed that the ordered structure of the protein main chain and the side chain conformation was weakened, the main chain structure was almost broken, and the protein became loose and disordered. In addition, the content of esters, amino acids, glycoproteins, and carbohydrate-related substances decreases, indicating a change in the environment. Finally, the PCA method was used to analyze the SERS signal of the serum of healthy people and patients with acute leukemia to accurately distinguish the two serum samples. The above conclusions can provide a favorable experimental basis for diagnosing leukemia and the study of the biochemical mechanism involved.
Leukemia is a malignant tumor of the hematopoietic system. It is characterized by the neoplastic proliferation of a certain type of leukemia cells in the bone marrow or other hematopoietic tissues, which can infiltrate various organs and tissues in the body and impair the function of various organs, producing corresponding symptoms and signs. Currently, leukemia is diagnosed mainly through blood and bone marrow, but the bone marrow examination brings great pain to the patient (1,2). In some patients with acute leukemia, there are no typical blood and bone marrow changes in the early stage, but there are abnormal blood images. During this period, comprehensive clinical and laboratory examinations cannot confirm the diagnosis of leukemia.
Surface-enhanced Raman spectroscopy (SERS) is superior for identifying the molecular composition of complex materials because the enhancement of Raman intensities as much as 109–1016 times by molecules adsorbed onto the nanostructured metal surface can possibly detect very small amounts of the substances (3–5). Therefore, it has become one of the best techniques in assay single molecule and bimolecular spectroscopy. The study of Raman spectroscopy on serum has received extensive attention in the field of pathobiology (6–8). However, there are few articles using SERS to study the serum of leukemia patients. Here, SERS is used to probe the serum from acute leukemia.
Materials and Method
Source of Specimens
The experimental serum were selected from 20 healthy volunteers as the control group, and 20 patients who were diagnosed with acute leukemia by the People’s Hospital as the other group. The serum was mixed with the silver colloidal nanoparticles according to a 2:1 proportion and placed in a quartz glass capillary for Raman measurement. The Raman spectra were collected with a confocal Raman microspectrometer (Renishaw) in the range of 400–1800 cm-1, with a near-infrared (NIR) 780 nm laser whose power was maintained at 25 mW and a spectral resolution of less than 2 cm-1. Spectrometer scans, data collection, and processing were controlled by a personal computer.
Preparation of Silver Colloid Nanoparticles
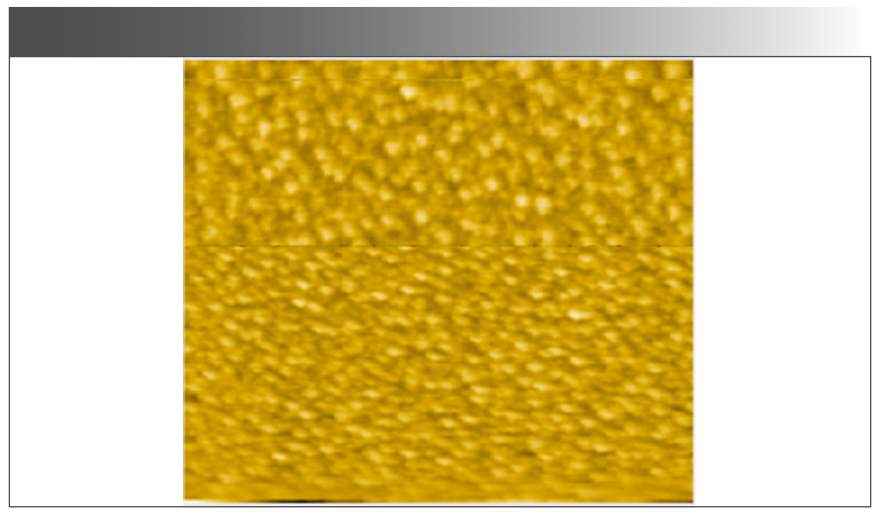
Here, the silver colloidal nanoparticles were synthesized by a deoxidizing method using trisodium citrate and silver nitrate. The configuration of the silver glue is characterized by a scanning probe microscope (9–11). The atomic force microscopy (AFM) morphology of the silver glue is shown in Figure 1. It can be seen that the particles were distributed in a relatively aggregated uniform size and exist in the form of nearly spherical nanoparticles. The average size of the particles was in the range of 30–50 nm.
FIGURE 1: AFM morphology of silver colloidal nanoparticles.
Research on “Hot Spots” of Silver Colloid Nanoparticles
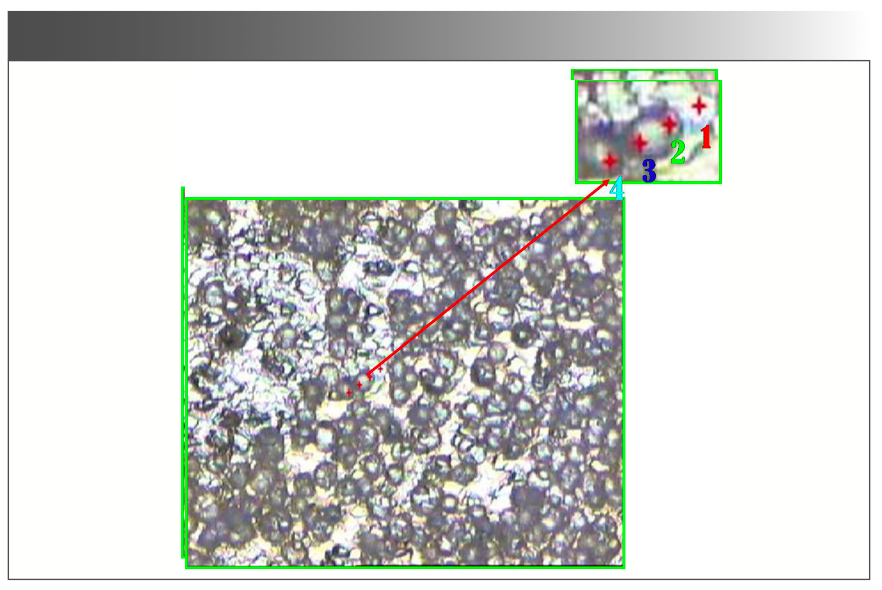
During their study of the SERS mechanism, Nie and others found the “hot spot” phenomenon in the SERS experiment—that is, in SERS, there were some aggregation points of silver nanoparticles. The Raman scattering intensity of the sample adsorbed on it was abnormally enhanced, which is called the “hot spot” (12,13). The combination of the silver colloidal and serum under the microscope are presented in Figure 2. It can be seen that the aggregation of multiple silver nanoparticles is shown in the marked part of the graph, which meets the conditions for forming a “hot spot.”
FIGURE 2: The combination of silver gel and serum image under a microscope (with close-up insert).
Experimental Results and Discussion
The mean SERS of serum from the acute leukemia group and control group are presented in Figure 3. The major contribution to these bands is from proteins, lipids, and carbohydrates. The ratio of relative intensity can be used to analyze the characteristics of biomacromolecules after the group and chemical bond changed and be defined as (14,15):

Here, I’n and I'm are representative for the relative intensity of the peak from the acute leukemia group and control group, respectively. By selecting the intensity of 725±1 cm-1 as the main criterion, the relative intensity of the peak, I’n, is defined as:

In equation 2, In represents the absolute intensity of the serum Raman peak of patients with acute leukemia. I'm is defined as

In equation 3, Im represents the absolute intensity of the Raman peak of healthy human serum.
The bands at 1445, 1333, 1099, 1016, and 725 cm-1, which are characterized by lipids, carbohydrates, tryptophan, asparagine, and protein side chain CS bonds, look similar to one another (16–18), but some peaks show differences in intensity and in the Raman shift (see Figure 3 and Table I for more details).
FIGURE 3: (a) SERS of normal human serum and (b) SERS of the acute leukemia patient serum.
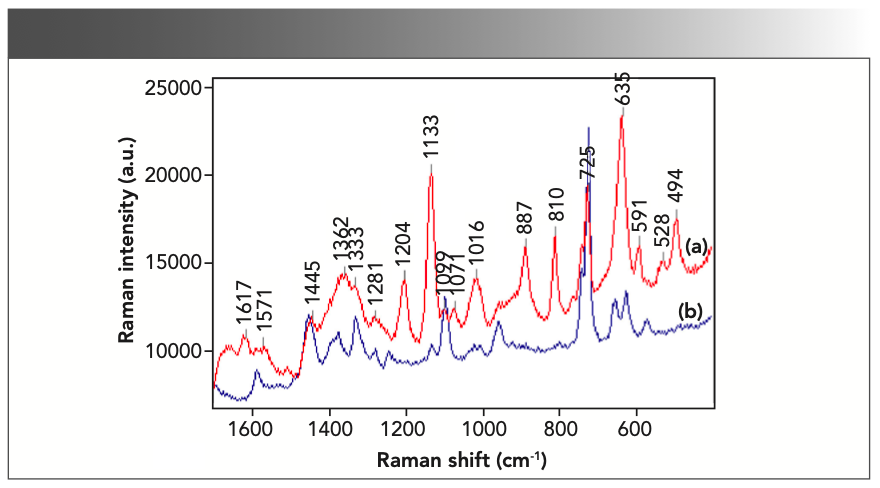
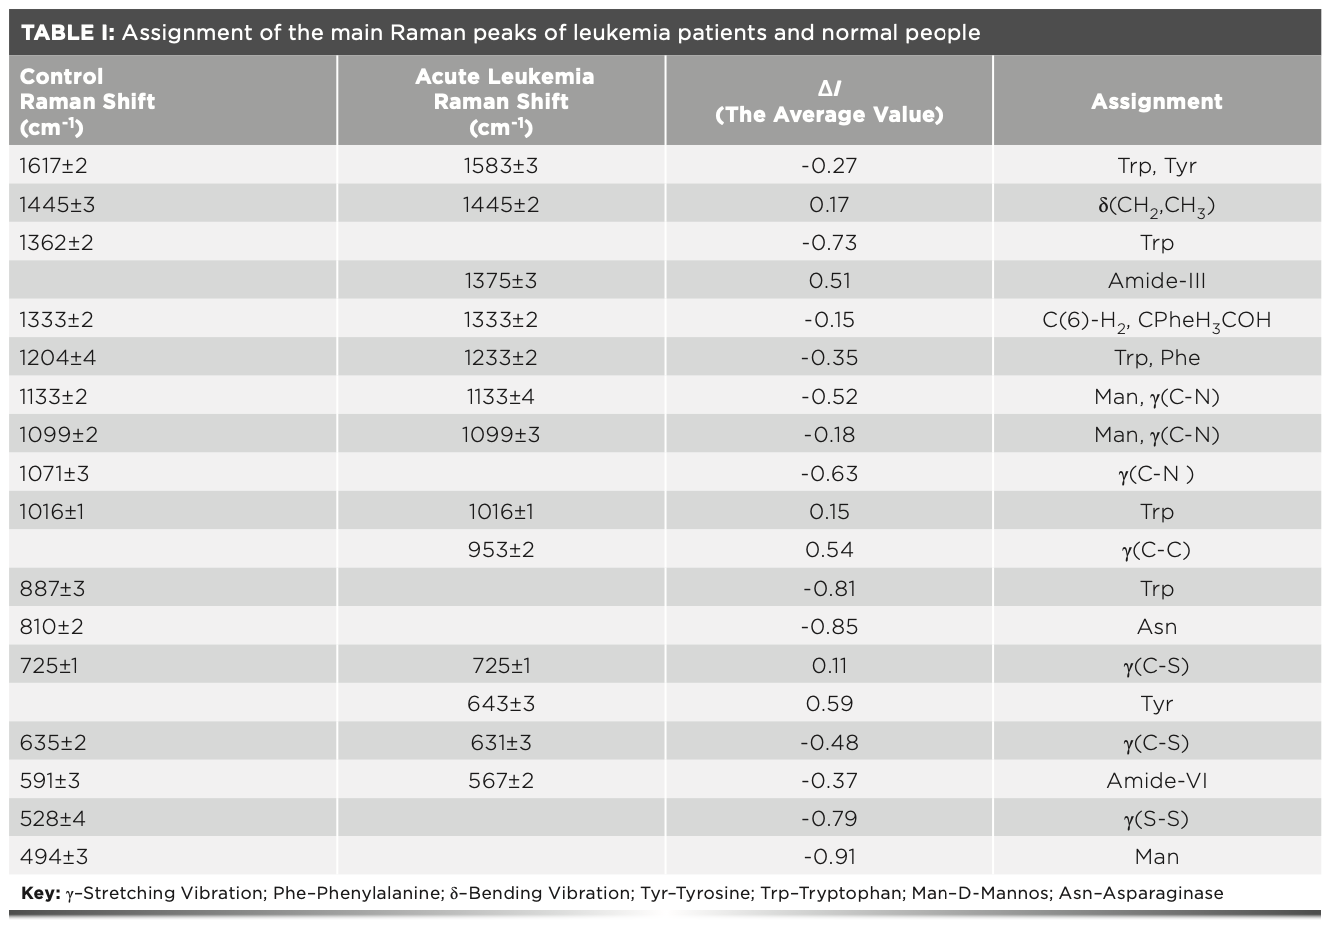
The spectral line of the protein backbone conformation changes significantly: 528 cm-1 in the Raman peak of healthy human serum belongs to the disulfide bond in the protein structure. The characteristic spectrum of stretching vibration disappears in the serum of patients with acute leukemia. The spectral line contributed by amide VI in the serum of acute leukemia patients shifted from the normal 591 cm-1 to 567 cm-1, and the relative intensity was reduced by 37%. The Raman characteristic peaks 953 cm-1 and 1375 cm-1 contributed by the protein backbone C-C bond and amide III (19,20), respectively, increased by 51% and 54% in the patient’s serum, indicating that the protein backbone structure is almost broken and ordered.
The change in the protein side chain was also obvious: the spectrum line 635 cm-1 in the serum of healthy people belonged to the twisted conformation of the C-S bond of the protein side chain, and it shifted to 631 cm-1 in the serum of patients with acute leukemia, with the relative intensity being reduced by 48%. The line of the indole ring of tryptophan shifted from 1617 cm-1 to 1583 cm-1 in the serum of patients with acute leukemia, and the relative intensity was reduced by 27%. The characteristic peaks of 810 cm-1, 887 cm-1, 1071 cm-1, and 1362 cm-1 contributed by aspartic acid, amino acid C-N (21,22), and tryptophan in healthy human serum disappeared in acute leukemia patients. It can be seen that the amino acid content in the metabolites of acute leukemia patients was reduced. The spatial structure of the protein side chain was destroyed, and the protein became loose and disordered.
The D-mannose spectrum line at 494 cm-1 in carbohydrates disappeared in the serum of patients with acute leukemia, and the relative intensity of the characteristic peak at 1133 cm-1 was reduced by 53%, indicating that the serum of patients with acute leukemia was related to glycoproteins and carbohydrates.
Principal Components Analysis (PCA)
To improve the sensitivity of Raman spectroscopy, we established a PCA result. Principal component analysis is a statistical method of dimensionality reduction. It uses an orthogonal transformation to transform the original random vector whose components are related to a new random vector whose components are not related. The idea of PCA is to use fewer comprehensive variables. To replace the original variables simultaneously, it is required that these comprehensive variables reflect the information of the original variables as much as possible, and they are not related to each other (23). Then, the new matrix is transformed into a diagonal matrix, which is geometrically expressed as transforming the original coordinate system into a new orthogonal coordinate system. The new orthogonal coordinate system points to the p-orthogonal directions where the sample points are most dispersed before reducing the multidimensional variable system. This dimensional processing allows the system to be converted into a low-dimensional variable system with a higher precision; by constructing an appropriate value function, the low-dimensional system is further transformed into a one-dimensional (1D) system. After using PCA, we can select the first two principal components, or a couple of them, and draw the distribution of n samples on a two-dimensional (2D) plane based on the scores of the principal components, which can be visually seen from the graph. Doing so helps to find out the position of each sample in the principal component and then classify the sample, finding outliers far away from most sample points from the graph (24).
The calculation steps of PCA are as follows (25,26):
(1) Collection of the original index data p-dimensional random vector x = (x1, x2,...,xp)T, n samples are

where n > p. Construct a sample array and perform the following standardized transformations on the sample array elements:
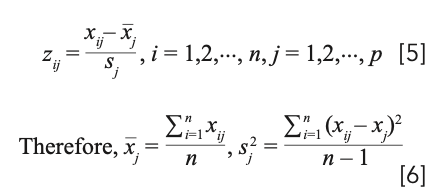
Calculate the normalized matrix as Z.
(2) Find the correlation coefficient matrix for the standardized matrix Z
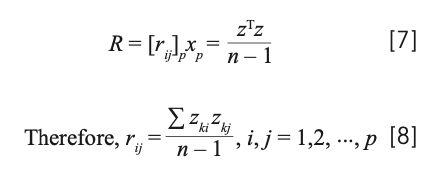
(3) Solve the characteristic equation of the sample correlation matrix R as

So we have the p matrix root of the matrix R and get a characteristic root to determine the principal component. Determine the value of m as the following equation

So that the utilization rate of information reaches over 85%, the following system of equations are solved

So we can get the unit eigenvector b0j
(4) Convert standardized indicator variables into main components

U1 is called first principal component, U2 is called second principal component, and so forth. Up is called the p (principal component).
(5) Perform a weighted summation on the m principal components to obtain the final evaluation value, and the weight is the variance contribution rate of each principal component.
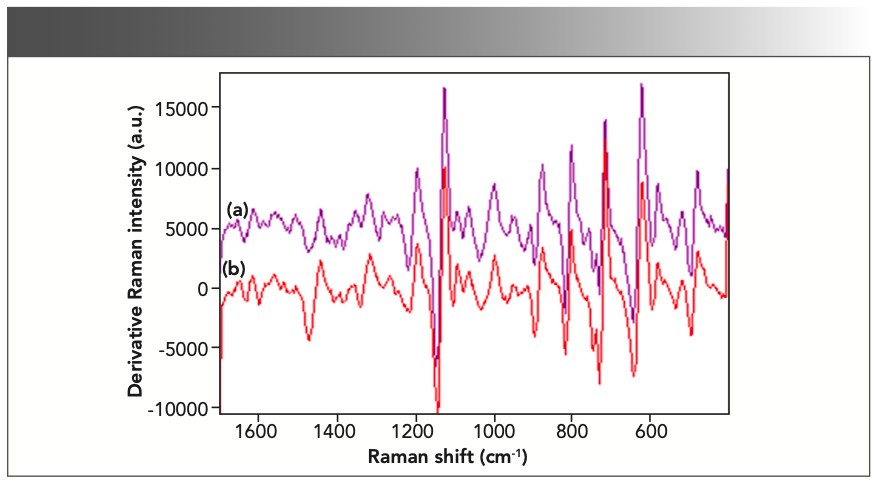
To improve the sensitivity of Raman spectrum recognition, we performed background subtraction, smoothing, derivation, and area normalization of the original spectrum data as shown in Figure 4. We selected the region of 400~1800 cm-1 in the Raman peak concentration to do multivariate statistical analysis, and we used Matlab 7.0 software to do the PCA analysis.
FIGURE 4: Mean SERS spectra of serum from (a) healthy and (b) acute leukemia are processed by baseline correction, second-order derivative, and area normalization.
PCA was performed on 19 vibration modes shared by 20 acute leukemia patient serum and 20 healthy human serum. The components whose cumulative variance contribution rate was greater than 85% were selected as the main components to achieve the extraction of spectral feature information. The first three principal components can be used to represent the main information on the original spectrum. The characteristic values and cumulative reliability of the principal components are shown in Table II.

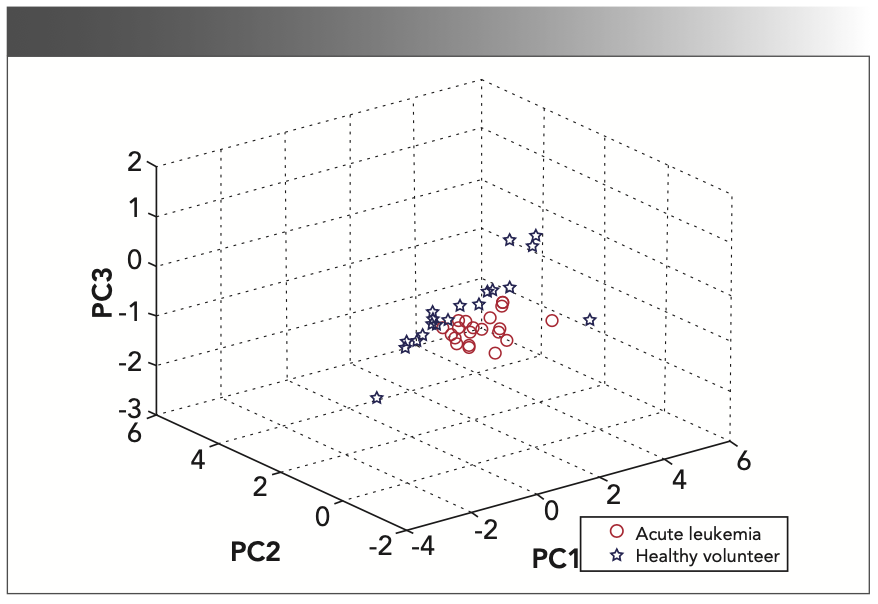
Figure 5 is a three-dimensional (3D) projection diagram of the main components 1, 2, and 3. As can be seen from Figure 5, “O” represents the serum of patients with acute leukemia, and “☆” represents the serum of healthy people. From the graph, we can intuitively see the serum of patients with acute leukemia and healthy people. The vibration peaks fall in different intervals, so that the samples can be classified and processed. The distribution of the main components of the serum of patients with acute leukemia is relatively scattered compared with healthy people. It may be because of the changes in certain components in the serum of patients with acute leukemia that the internal material distribution is uneven. It can be seen that the PCA method can accurately distinguish the serum of acute leukemia patients from healthy human serum.
FIGURE 5: Three-dimensional (3D) mapping of PCA from the acute leukemia group, and healthy volunteer group. Shown are the discrimination results of PCA from healthy volunteer group (o) and acute leukemia group (☆). They can be separated completely.
Conclusion
Through the comparative analysis of the SERS of the two serum, the difference in Raman signals between the serum of patients with leukemia and the serum of normal people was obtained. The results show that the protein, lipid, and carbohydrate content in the serum of leukemia patients decreased. The ordered structure of proteins in the serum of patients with acute leukemia changes, and the content of amino acids, glycoproteins, and carbohydrate-related substances in the serum decreases. After PCA analysis, the serum of patients with acute leukemia can be accurately distinguished from the serum of healthy people. These conclusions provide a favorable experimental basis for the diagnosis of leukemia and the study of the biochemical mechanism involved.
Acknowledgments
We thank the Provincial Natural Science Foundation of Shandong for financial support (Grant No. ZR2019PB010).
References
(1) D. Rohleder, W. Kiefer, and W. Petrich, Analyst 129(10), 906–911 (2004).
(2) K. Kneipp, A.S. Haka, et al, Appl. Spectrosc. 150(56), 300–312 (2002).
(3) Y. Daneshbod and L.J. Medeiros, Blood 129(8), 1046–1056 (2017).
(4) W.C. Chen, Y. Kang, H. Zhang, et al, Chin. Chem. Lett. 30(5), 110–116 (2019).
(5) C.R. Lee, S.J. Bae, M.S. Gong, K. Kim, and S.W. Joo, J. Raman Spectrosc. 33(29), 955–961 (2002).
(6) C. Garrido and B.E. Weiss-López, Spectrosc. Lett. 49(1), 98–104 (2016).
(7) P. Miskovsky, J. Hritz, et al, Photochem. Photobiol. 74(12), 172–183 (2001).
(8) A. Callegari, D. Tonti, and M. Chergui, Nano Lett. 11(3), 15650–15689 (2003).
(9) H.W. Han, X.L. Yan, R.X. Dong, et al, Appl. Phys. B. 94(4),667–672 (2009).
(10) Y.M. Xu and C.Z. Lu, Sci. China Life Sci. 48(3), 117–124 (1997).
(11) F.M. Zehentbauer, J. Rüger, and J. Kiefner, Spectroscopy 32(5), 104–112 (2017).
(12) Y.D. Lu, Y.S. Lin, Z. Zheng, et al, Biomed. Opt. Express 9(10), 47–58 (2018).
(13) S. Nie and S.R. Emory, Science 275(10), 1102–1106 (1997).
(14) M. Koch, C. Suhr, et al, J. Raman Spectrosc. 48(2), 112–120 (2017).
(15) DA Silva Wagner Rafael, S. Landulfo, and F.A. Barrinha, Lasers Med. Sci. 35(5), 1065–1073 (2019).
(16) S.Y. Feng, J.J.Pan, Y.Y. Wu, et al, Sci. China Life Sci. 54(9), 36–45 (2011).
(17) M.J. Connolly, K. Davies, et al, Nanomed.: Nanotechnol. Biol. Med. 12(6), 14–21 (2016).
(18) K. Matthias, S. Christian, R. Bernhard, et al, J. Raman Spectrosc. 48(2), 87–95 (2017).
(19) X.G. Shao, J.H. Pan, Y.Q. Wang, et al, Nanomed.: Nanotechnol. Biol. Med. 13(3), 65–74 (2017).
(20) B. Yan, B.Li, Z.N. Wen, X.Y. Luo, L.L. Xue, and L.J. Li, BMC Cancer 650, 15 (2015).
(21) S. Breuninger, H. Fischer, U. Schmidt, et al, Spectroscopy 34(6), 8–18 (2019).
(22) A. Pérez, Y.A. Prada, R. Cabanzo, et al, Sens. Bio-Sens. Res. 21(3), 40–45 (2018).
(23) R.X. Zhou, Y.H. Xiong, N. Wang, and X.Z. Wang, J. Sys. Sci. Information 7(5), 94–105 (2019).
(24) A. Park, S. Baek, and A. Diagnosis, J. IEIE 50(8), 178–187 (2013).
(25) D. Fernandesa, V. Almeidaa, et al, Anal. Methods 41(8), 45–52 (2016).
(26) X. Wang, Sun Yat-sen J. Humanit. (Natural Science and Medicine) 28(4), 50–60 (2007).
Hongwen Han is with the College of Science, Yantai Nanshan University, China. Jingjing Gong is with the College of Business, Yantai Nanshan University,Shandong, Yantai, China. Yannan Tian is with the College of Science, Yantai Nanshan University, China. Direct correspondence to Jingjing Gong at wengang411@163.com.●
AI-Powered SERS Spectroscopy Breakthrough Boosts Safety of Medicinal Food Products
April 16th 2025A new deep learning-enhanced spectroscopic platform—SERSome—developed by researchers in China and Finland, identifies medicinal and edible homologs (MEHs) with 98% accuracy. This innovation could revolutionize safety and quality control in the growing MEH market.
New Study Reveals Insights into Phenol’s Behavior in Ice
April 16th 2025A new study published in Spectrochimica Acta Part A by Dominik Heger and colleagues at Masaryk University reveals that phenol's photophysical properties change significantly when frozen, potentially enabling its breakdown by sunlight in icy environments.
AI-Driven Raman Spectroscopy Paves the Way for Precision Cancer Immunotherapy
April 15th 2025Researchers are using AI-enabled Raman spectroscopy to enhance the development, administration, and response prediction of cancer immunotherapies. This innovative, label-free method provides detailed insights into tumor-immune microenvironments, aiming to optimize personalized immunotherapy and other treatment strategies and improve patient outcomes.
Advanced Raman Spectroscopy Method Boosts Precision in Drug Component Detection
April 7th 2025Researchers in China have developed a rapid, non-destructive Raman spectroscopy method that accurately detects active components in complex drug formulations by combining advanced algorithms to eliminate noise and fluorescence interference.