Analysis of Pharmaceuticals in Environmental Samples with Ultrahigh-Definition LC–QTOF-MS and Accurate Mass: How Much Resolving Power is Enough?
Two examples are presented, sulfa antibiotics in water and stanazolol fragmentation, to answer the question of how much resolving power is enough for work with small molecules.
Accurate mass analysis of sulfa antibiotics and anabolic steroids in water samples or water extracts was carried out using ultrahigh-pressure liquid chromatography (UHPLC) coupled to ultrahigh-definition (high-resolution) quadrupole time-of-flight mass spectrometry (QTOF-MS). European Union regulations for identification points of banned veterinary drugs using high resolution (>20,000 FWHM) are demonstrated for the first time with QTOF-MS.
European Union regulations for the high-resolution analysis of banned veterinary drugs in food and food products requires the use of resolving power equal to or exceeding 10,000 using the 10% valley definition, which is equal to 20,000 resolving power using the full width at half maximum (FWHM) method (1,2). This European Union method assigns identification points for each accurate mass — 2 points by mass spectrometry (MS) or 2.5 points by MS-MS — and a total of at least 4 points are required for correct identification (1). The concept of identification points by this system has been advocated for environmental water samples in several publications using liquid chromatography–quadrupole time-of-flight MS (LC–QTOF-MS) (3). However, in all published examples using TOF-MS, the minimum required resolving power of 10,000 at 10% valley (20,000 FWHM) has not been shown by TOF-MS. The reason is that, until recently, TOF-MS systems have not been able to resolve small fragment ions of pharmaceuticals (with an m/z < 150) at 20,000 (FWHM). This article shows that it is now possible to reach and exceed the resolving power requirement of 10,000 at 10% valley (20,000 FWHM) for antibiotics, anabolic steroids, and other pharmaceuticals in aqueous samples. Furthermore, it is possible to distinguish isobaric product ions of the anabolic steroid stanazolol that differ by either CH2CH2 or N2, which is a mass difference of 0.0252 mass units (4,5). This is a fragmentation pattern with resolution that was thought only to be possible with Fourier transform MS (FT-MS) or FT-MS orbital trap instruments (5). In fact, we were able to exceed the results of both of these instruments (5) through a broader range of m/z ions from masses as low as m/z 69 to the protonated molecule at m/z 279, giving resolving power exceeding the 20,000 (FWHM) requirement and answering the question of how much resolving power is enough for work with small molecules (with m/z < 300) in veterinary drugs or banned substances. These analyses are carried out with mass measurements at ~1 ppm mass accuracy using both MS and MS-MS techniques. This article discusses two examples: sulfa antibiotics in water and stanazolol fragmentation, according to European Union regulations on analytical methods for monitoring the presence of banned veterinary drugs in food (1,2).
Experimental Conditions
A model 1290 ultrahigh-pressure liquid chromatography (UHPLC) system (Agilent Technologies) was used for high-resolution chromatographic separation of a suite of sulfa antibiotics with a mobile phase of 0.1% formic acid in water and acetonitrile. The column was a 50 mm × 2.1 mm, 1.8-μm dp C18 Eclipse Plus HD (Agilent) with a 10-min gradient. A 5–10 μL volume of sample was injected that consisted of a 1 ppm solution of each of the analytes or analyte mixtures, depending on the sensitivity of the analyte. The gradient started at 90% B with a hold of 2 min followed by a linear gradient to 100% of A, for a total gradient of 10 min, where mobile-phase B is reagent-grade water (Sigma-Aldrich) with 0.1% formic acid (Sigma-Aldrich) and mobile-phase A is acetonitrile (Burdick and Jackson).
Mass spectrometry was conducted using a model 6540 liquid chromatograph–quadrupole-time-of-flight mass spectrometer (Agilent) with the following conditions: 375 °C for the sheath gas temperature, 11 L/min for the sheath gas flow, 250 °C for the gas temperature, 10 L/min for the desolvation gas flow rate, 45 psi for the nebulizer pressure, 4000 V for the capillary voltage in positive ion mode, and 0 V for the nozzle voltage. The fragmentor voltage was set from 100 to 190 V, and all other mass spectrometer parameters remained at autotune conditions.
Results and Discussion
Identification of Sulfa Antibiotics in Food and Water
Figure 1 shows the UHPLC chromatogram for three sulfa antibiotics: sulfamethazine, sulfamerazine, and sulfadimethoxine. Two of these antibiotics (sulfamethazine and sulfamerazine) are used in hog feed at parts-per-million levels, and sulfadimethoxine is used in water for caged birds; thus, it is possible for these products to appear in food or water samples. Indeed, the presence of sulfa antibiotics is commonly reported in water samples affected by wastewater effluents. Therefore, it is important to have a method that can easily identify these compounds with a resolution that meets the European Union criteria of identification points for either food or water samples (1,2,5).
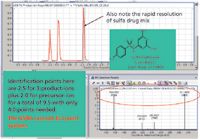
Figure 1: Ultrahigh-definition LCâQTOF-MS analysis of a sulfa drug mix found in water.
The three drugs were separated in less than 3 min with a rapid gradient and peak widths of 6 s at the base (Figure 1). The accurate masses and resolving power for the MH+ ion and each of the product ions are also shown in Figure 1 for sulfadimethoxine. The accurate masses were all within 0.5 mDa of the exact calculated mass for each analyte, which is equal to the accurate mass of an electron (6). Using the European Union guidelines for identification points of banned veterinary drugs, the MH+ ion receives 2 points and each of the three product ions using MS-MS receives 2.5 points, for a total of 9.5 identification points (Figure 1). The resolving power of greater than 10,000 (10% valley) or 20,000 (FWHM) is exceeded for all ions. There is a diagnostic ion of the sulfa drug family with an exact mass of m/z 156.0114, which is shown in Figure 2. This ion occurs in each of the sulfa antibiotics; thus, the accurate mass of this ion can be used to scan for other sulfa drugs or metabolites. The resolving power again exceeds the minimum value of 20,000 (FWHM) for this ion. The European Union regulations do not stipulate an accurate mass, but a simple calculation shows low error values on accurate mass. It is also noted that there is another isobaric ion at m/z 156, with an accurate mass of 156.0768, which is the other half of the sulfadimethoxine molecule (Figure 2).
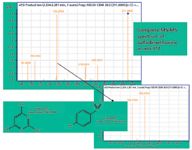
Figure 2: Isobaric product ions at m/z 156.
For example, the number of formulas within the measured accurate mass of sulfadimethoxine at errors of 10 ppm, 5 ppm, and 2 ppm decreases from 10 possible formulas at 10 ppm to six at 5 ppm to only two at 2 ppm, using a composition of the elements C, H, N, O, S, and P. These are reasonable elements to enter into the calculator, given the isotopic cluster shown in Figure 3 for sulfadimethoxine. In fact, the large relative isotopic mass defect for the A+2 ion in the isotopic cluster, shown in Figure 3, demonstrates that S is present in the molecule; thus, only the correct formula for sulfadimethoxine is found at the 2 ppm mass error limit. The use of the relative isotopic mass defect to limit molecular formulas is a powerful tool that has been applied for unknown analysis (4,7).

Figure 3: Isotopic cluster for sulfadimethoxine showing the A+1 and A+2 ions, showing the relative isotopic mass defect of S (3,7).
Generally, the error limits on accuracy are set at 5 ppm based on publication requirements in the literature for unknown analysis. However, one quickly sees that it is insufficient when faced with the number of formulas that may exist. Thus, we would recommend accuracies of <2 ppm for high resolution and accurate mass analysis for small molecules with a molecular weight < 500.
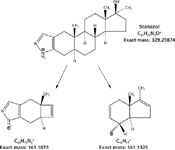
Figure 4: Isobaric product ions from the banned anabolic steroid stanazolol, which differ in mass by the mass of CH2CH2 and N2 or 0.0252 mass units.
Stanazolol: Resolving Product Ions with LC–QTOF-MS
The neutral losses of N2, CH2CH2, and CO all result in a mass unit difference of 28, and perhaps, may represent one of the greatest challenges to MS-MS analysis by high resolution and accurate mass analysis (5). Nielen and colleagues (5) examined such losses in the fragmentation of stanazolol, a banned anabolic steroid that gives a series of neutral losses, with isobaric product ions that differ by the loss of either CH2CH2 or N2, which is a difference in mass between these two losses that is equal to 0.0252 mass units. In particular, they showed that both FT-MS and FT-orbital trap MS were capable of separating such differences at a resolving power of ~50,000 (FWHM) by orbital trap and ~100,000 (FWHM) by FT-MS. Furthermore, they found that this separation of isobaric products ions was not possible at that time by LC–QTOF-MS. Using high-resolution accurate-mass analysis with ultrahigh-definition LC–QTOF-MS, this separation of masses is now possible. We have repeated their experiment with stanazolol, conducting both chromatography and MS-MS at >40,000 (FWHM) maximum mass resolving power at m/z 1521 by LC–QTOF-MS with ultrahigh-definition mass resolution. The exact masses of the product ions for stanazolol (m/z 329.25874) are shown in Figure 4 at m/z 161.1073 and m/z 161.1325. Figure 5 shows the measured accurate mass for these two product ions using ultrahigh-definition LC–QTOF-MS. These ions represent isobaric fragments that differ by the mass difference of CH2CH2 and N2. The exact calculated mass difference between these two neutral losses is 0.0252 mass units versus the measured mass of 0.00249. Table I shows the 10 isobaric losses that occur within the stanazolol molecule when the MS-MS experiment is carried out. Note that the average mean loss for all of the fragments is 0.0252, which exactly matches the calculated mass difference between CH2CH2 and N2, with a standard deviation of 0.0002 mass units, which is less than 1%. The accurate mass for all fragments is approximately 1 ppm across the mass range and resolving power is approximately 25,000 (FWHM) for the smallest fragments, which is illustrated in Figure 5. Thus, LC–QTOF-MS has met the challenge presented by stanazolol and the European Union regulation of high-resolution MS in both accurate mass and resolving power. The banned anabolic steroid, stanazolol, could be positively identified with these product ions and its MH+ by high resolution, thus satisfying the EU requirements of having more than 4.0 identification points. In fact, these data are equal to 2.0 + 10(2.5) points, for a total of 27.0 identification points. These data answer the question in the title of this article of how much resolving power is enough for small molecules of less than 500 molecular weight, at least with respect to the European Union regulations, which are a well thought out definition for high-resolution MS (8).

Figure 5: The m/z 161 product ions are isobaric fragments of stanazolol with different formulas for each product ion. The resolving power of 25,000 easily separates and identifies the two product ions with 2.5 identification points for each product ion.
Conclusions
Ultrahigh definition LC–QTOF-MS can provide a resolving power of >40,000 (FWHM) at maximum tune mass (m/z 2721.8948) and is fully capable of providing a resolving power of >20,000 (FWHM) for the smallest fragment ions, while maintaining the ability for fast chromatography, an accomplishment that is unique to LC–QTOF-MS instrumentation. These specifications allow the unequivocal identification of banned veterinary drugs, such as stanazolol, in food, and also the analysis of pharmaceuticals and antibiotics in water samples with the highest analytical confidence. This analysis thus answers the question of how much resolving power is enough for these small molecules and satisfies the EU requirement for high-resolution MS.
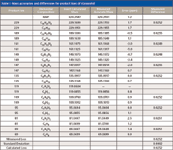
Table I: Mass accuracies and differences for product ions of stanazolol
E. Michael Thurman and Imma Ferrer are with the Center for Environmental Mass Spectrometry in the Department of Environment Engineering at the University of Colorado, in Boulder, Colorado.
Jerry Zweigenbaum is with Agilent Technologies, in Wilmington, Delaware.
References
(1) Commission of the European Communities, "Commission Decision of 12 August 2002 Implementing Council Directive 96/23/EC Concerning the Performance of Analytical Methods and the Interpretation of Results," Official J. Eur. Communities, L 221, 8 (2002) (O.J. L 22⅛ 17.8.2002; Commission Decision 2002/657/EC).
(2) E.M. Thurman, I. Ferrer, and J.A. Zweigenbaum, Anal. Chem. 78, 6703–6708 (2006).
(3) F. Hernandez, J.V. Sancho, and M. Ibanez, in Liquid Chromatography Time-of-Flight Mass Spectrometry, I. Ferrer and E.M. Thurman, Eds. (John Wiley & Sons, Inc., New York, 2009).
(4) E.M. Thurman and I. Ferrer, in Liquid Chromatography Time-of-Flight Mass Spectrometry, I. Ferrer and E.M. Thurman, Eds. (John Wiley & Sons, Inc., New York, 2009).
(5) M.W.F. Nielen, M.C. Van Engelen, R. Zuiderent, and R. Ramaker, Anal. Chim. Acta 586, 122–129 (2007).
(6) I. Ferrer and E.M. Thurman, Anal. Chem. 77, 3394–3400 (2005).
(7) E.M. Thurman and I. Ferrer, Anal. Bioanal. Chem. 397, 2807–2816 (2010).
(8) A.A.M. Stolker, E. Dijkman, W. Niesing, and E.A. Hogendoorn, in Liquid Chromatography/Mass Spectrometry, MS/MS and Time-of-Flight MS, I. Ferrer and E.M. Thurman, Eds. (American Chemical Society, Washington, DC, 2003), pp. 32–51.
LIBS Illuminates the Hidden Health Risks of Indoor Welding and Soldering
April 23rd 2025A new dual-spectroscopy approach reveals real-time pollution threats in indoor workspaces. Chinese researchers have pioneered the use of laser-induced breakdown spectroscopy (LIBS) and aerosol mass spectrometry to uncover and monitor harmful heavy metal and dust emissions from soldering and welding in real-time. These complementary tools offer a fast, accurate means to evaluate air quality threats in industrial and indoor environments—where people spend most of their time.
NIR Spectroscopy Explored as Sustainable Approach to Detecting Bovine Mastitis
April 23rd 2025A new study published in Applied Food Research demonstrates that near-infrared spectroscopy (NIRS) can effectively detect subclinical bovine mastitis in milk, offering a fast, non-invasive method to guide targeted antibiotic treatment and support sustainable dairy practices.