The Analysis of Semivolatile Compounds in Environmental and Crude Vegetable Extracts by Ion-Trap Mass Spectrometry
Special Issues
Today's ion traps use advanced scanning techniques such as automatic gain control, axial modulation, and triple resonance scanning, resulting in efficient control of both ionization and optimal storage of ions in the trap during analysis. These instruments provide excellent sensitivity and quantitative data, even in "dirty" samples.
Although quadrupole mass spectrometry (MS) technology is used predominantly in environmental sample analyses, ion-trap MS is a valid alternative for US EPA gas chromatography (GC)–MS methods. EPA Methods 525.2, 524.2, and more recently Method 521 all contain ion-trap data supporting validation of the method (1–3). Later versions of SW-846 Method 8270, for the analysis of semivolatile compounds in soil and wastewater matrices, refer to ion-trap MS as an accepted technology (4).
Data will be presented that clearly demonstrate that an ion trap, when properly set up for the analysis, can meet EPA 8270 quality control requirements easily. Also, accurate quantitation will be shown in heavy matrices, such as in diesel fuel oil and crude vegetable extracts.
Introduction
Early ion traps could not provide a routine, powerful quantitative tool for analytical chemists. Ions were formed by a fixed time duration pulse of electrons that were ejected from the trap by linearly increasing the amplitude of the radio frequency (rf) voltage, causing ions of successive mass-to-charge ratio (m/z) to become unstable in the axial direction and exit the trap through a series of holes in the end-cap. The trap operated at elevated temperatures, required for chromatography, which increased the rate of air and water permeation into the vacuum chamber. The enormous background of water caused ion–molecule reactions and produced a mixture of electron ionization (EI) and chemical ionization (CI) spectra. The relatively limited mass resolution using instability ejection, along with the CI reactions, resulted in poor quality spectra and incorrect mass assignments. A fixed ionization time, along with high air and water background caused by a larger than optimum number of ions stored in the trap, resulted in loss of mass resolution and accuracy. During the development of the first commercial instrument, it was discovered that certain classes of compounds had masses that were shifted up or down in mass relative to masses in the calibration spectra. The end result: Poor quantitation and spectral fidelity were observed. The instrument could not be used for reliable routine quantitative analysis.
The development of resonant ion ejection scanning, commonly called axial modulation, increased the mass resolution to unit resolution over the entire mass range. The increased power of microprocessors available during the late 1980s allowed more sophisticated mass centroiding algorithms to be applied. Automatic gain control also was implemented to ensure that the number of ions in the trap was constant and always optimum as the sample concentration changed. In addition, inert coatings such as SilChrom on the surfaces of trap electrodes provided an improved response to several classes of chemical compounds.

Table I: DFTPP tuning criteria in USEPA Method 8270 with values coming from the spectrum at left
Although modern ion traps have incorporated numerous innovative technical improvements affecting spectral quality, the perception of the ion trap as a reliable mass analyzer was compromised. Early adopters found the instruments unstable and difficult to use. It was not possible to obtain quality full-scan data useful for library searches to identify unknowns. Quadrupole instruments at the time were better suited for analysis of environmental and other "dirty" matrices because they were not subject to space charging and ion–molecule reactions.

Figure 1
The following data clearly demonstrate that today's ion traps provide excellent quantitative and qualitative analysis, even in the most challenging matrices.

Table II: Initial calibration, continuing calibration, and system performance check compounds for USEPA 8270
Experimental
EPA Method 8270 Overview
EPA Method 8270 is a challenging environmental method with chemically broad and diverse target analytes. It is well known by users of the method that many problems encountered are not due to the mass spectrometer (the detector). Compounds such as nitrophenols and other nitro-compounds can degrade easily on active sites in injection ports and on analytical columns. Phthalates at low levels are especially problematic during sample preparation; other compounds, such as pentachlorophenol, are thermally labile or photosensitive. Some of the targets do not even belong in the method — they are much more amenable to high performance liquid chromatography (HPLC) or LC–MS analysis. In addition to these challenges, the types of extracts encountered range from relatively clean groundwater samples to heavily contaminated soil samples that contain low-mass hydrocarbons that can add significant background contamination in full scan MS.

Table II: Continues
Ion-Trap Data: Tuning and Calibration for EPA 8270
Table I represents data collected on a 2000 GC–MS system (Varian, Inc., Palo Alto, California) set up properly for EPA Method 8270. All tune, calibration, and system performance check solutions pass the quality control requirements in the method. Decafluorotriphenyl phosphine (DFTPP) is used to ensure that the MS system is properly tuned. A "quadrupole like" spectrum of DFTPP is obtained, demonstrating excellent mass accuracy and resolution (Figure 1).
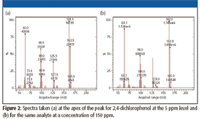
Figure 2
The compounds listed in Table II represent a subset of EPA Method 8270 analytes that are monitored commonly in routine environmental laboratories. The percent relative standard deviation (%RSD) of the individual compound response factors and correlation coefficients across the calibration range from 1 ppm to 160 ppm are presented. The continuing calibration check compounds (CCCs) are used to ensure that the original calibration curve is valid for subsequent analytical runs. The SPCC (system performance check compounds) is used to monitor the system for the buildup of active sites because dirty environmental extracts eventually contaminate the GC injection liner and head of the analytical column.
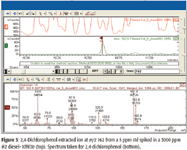
Figure 3
Ion-Trap Data: Heavy Diesel Fuel and Motor Oil Matrix
Ion traps are quite capable of producing mass spectra that are consistent across the calibration range when they are set up properly to run Method 8270. An example in Figure 2 represents a spectrum taken at the low and high concentration standards. This clearly demonstrates that the spectra obtained are not concentration dependent in the ion trap. Problems with ion–molecule reactions only occur when the trap becomes overloaded with ions, which may result from GC injector split ratios that are too low, resulting in too much sample entering the GC–MS. All MS analyzers and analytical columns have limits for the amount of material injected. Because ion traps have inherently more sensitivity than quadrupole instruments, higher split ratios can be used to increase method sensitivity and at the same time minimize the amount of sample entering the GC–MS system. This adds to the overall robustness of the analytical method.
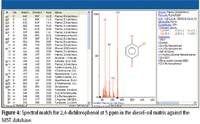
Figure 4
The spectra that are generated also match well with the National Institute of Standards and Technology (NIST) or other mass spectral databases, which for the most part contain spectra generated on quadrupole instruments. Fit–reverse fits of 900 or greater are achieved routinely on ion traps, even in the presence of heavy matrix interference, as demonstrated in Figures 3 and 4. Target quantitation ions are extracted from the matrix easily, and the resulting library search yields excellent results against the NIST. (2,4-Dichlorophenol is shown in the examples.)
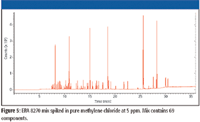
Figure 5
One way to evaluate quantitation in an ion trap is to compare response factors for calibration curves prepared in pure standard with those in a heavy matrix. A calibration curve using a model 4000-MS ion-trap system (Varian) at low, mid, and high levels for Method 8270 (5 ppm, 50 ppm, and 150 ppm, respectively) was prepared in pure solvent (methylene chloride). In addition, these same calibration levels were prepared in methylene chloride containing a mixture of both #2 diesel fuel oil and 10W-30 motor oil at a concentration of 3000 ppm (Figures 5 and 6).
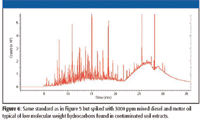
Figure 6
Figure 7 shows a typical example comparison of calibration curves for fluoranthene. The average relative standard deviation (RSD) of the response factors across the calibration range in-matrix and in pure solvent were nearly identical (about 5% different), indicating reliable quantitation in a complex matrix. Some of the target compounds, however, had a high bias at the low end of the calibration range (5 ppm) due to components that are naturally present in the diesel fuel/oil spikes. These compounds included phthalates and some polynuclear aromatic compounds. Also, some phenols in the matrix spikes had variable recoveries because the matrix itself "passivates" liners or degrades in the injection port. These issues are not related to ion-trap MS; they would be present in any analytical GC–MS system.
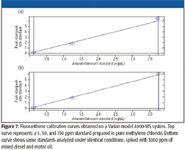
Figure 7
Crude Vegetable Extracts
In this analysis, a vegetable sample extract is prepared by cryo-milling followed by a micro liquid–liquid extraction procedure known as QuECHERS (5). Very little cleanup is performed, and as a result, the extracts present a significant challenge to any analytical GC–MS system. Figure 8 is a total ion chromatogram of a pesticides calibration standard at 5 ppb prepared in a highly colored (green) mixed vegetable extract. Despite the obvious large amount of matrix, pesticides can be identified and quantified easily. For example, Figure 9 compares an extracted ion chromatogram of atraton at 5 ppb in the matrix and in pure solvent.
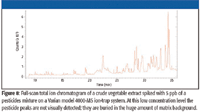
Figure 8
Calibration curves typically are prepared in-matrix for this method, because the matrix will tend to passivate injector liners and columns, causing variable response factors between standards prepared in pure solvent and those prepared in-matrix. This again is purely a GC inlet issue, not at all related to problems with the detector or MS. Figure 10 demonstrates excellent linearity for chlorpyrifos prepared in-matrix.
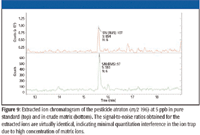
Figure 9
Not only can the ion trap provide excellent quantitative data for this application; it also provides excellent spectral integrity under these demanding conditions, as illustrated in Figure 11.
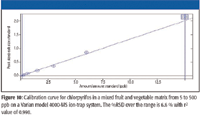
Figure 10
Conclusions
Early ion-trap designs were not suitable for routine analysis and did not produce reliable quantitation and spectral fidelity. Today's ion-trap technology handles large populations of ions, maintaining spectral fidelity, mass resolution, and quantitative analysis. The ion-trap data presented here meet the challenges of heavily contaminated environmental and crude vegetable extracts, making these instruments valuable analytical tools. US EPA Method 8270 and other environmental methods can be performed routinely with ion traps. Quantitation of target analytes at very low concentrations in heavy matrices is the key advantage of today's ion traps.
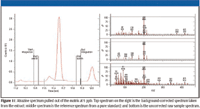
Figure 11
John E. George, III and Greg Wells are with Varian, Inc., Palo Alto, California.
References
(1) J.W. Munch and M.V. Bassett, US EPA Method 521: Determination of Nitrosamines in Drinking Water by Solid Phase Extraction and Capillary Column Gas Chromatography with Large Volume Injection Tandem Mass Spectrometry (MS/MS), Version 1.0, Sept. 2004.
(2) J.W. Munch (Ed.), US EPA 524.2: Measurement of Purgable Organic Compounds in Water by Capillary Column Gas Chromatography/Mass Spectrometry, Revision 4.1, 1995.
(3) J.W. Eichelberger, T.D. Behymer, W.L. Budde, J.W. Munch, and J.A. Shoemaker, US EPA Method 525.2: Determination of Organic Compounds in Drinking Water by Liquid–Solid Extraction and Capillary Gas Chromatography/Mass Spectrometry; Revision 2.0, 1988.
(4) Method 8270D: Semivolatile Organic Compounds by Gas Chromatography/Mass Spectrometry (GC/MS), SW-846.
(5) M. Anastassiades, S.J. Lehotay, D. Stajnbaher, and F. Schenck, J. AOAC Int. 86, 412–431 (2003).

High-Speed Laser MS for Precise, Prep-Free Environmental Particle Tracking
April 21st 2025Scientists at Oak Ridge National Laboratory have demonstrated that a fast, laser-based mass spectrometry method—LA-ICP-TOF-MS—can accurately detect and identify airborne environmental particles, including toxic metal particles like ruthenium, without the need for complex sample preparation. The work offers a breakthrough in rapid, high-resolution analysis of environmental pollutants.
Trending on Spectroscopy: The Top Content of 2024
December 30th 2024In 2024, we launched multiple content series, covered major conferences, presented two awards, and continued our monthly Analytically Speaking episodes. Below, you'll find a selection of the most popular content from Spectroscopy over the past year.