Atline Analysis of Commercial Graphene Products with Raman Spectroscopy
Graphene exhibits special properties, such as high strength and high electrical and thermal conductivity and as such is highly desirable for key electronic components. A new Raman spectroscopy sampling technique has been applied to the characterization of batches of graphene that provides a simple, at-line method for obtaining key product data.
Successful adoption of graphene materials requires simplified techniques that can provide representative, atline data to ensure the quality and repeatability of high-volume manufacturing processes. A new Raman spectroscopy sampling technique has been applied to the characterization of batches of graphene product that provides a simple, atline method for obtaining key product data. The technique is simple to operate and does not require highly skilled operators. Atline analysis with a portable Raman spectrometer is used to monitor every batch of graphene product manufactured by a graphene supplier, confirming that the products are low defect, high-aspect ratio graphene platelets. The analysis of the 2D band indicates that the average graphene platelet is <5 layers thick.
Graphene has gained a large amount of attention in the scientific and engineering communities and is currently being explored extensively for its properties, such as high strength and high electrical and thermal conductivity (1,2). Graphene has been proposed as a highly suitable material for memory chips, batteries, touchscreens, composites, sensors, barrier films, and even medicine and drug delivery systems (3,4).
Currently, graphene materials are being applied to industrial markets for rubbers and composites, fire retardancy products, construction materials, and energy storage (5). Standard methods for the characterization of graphene materials support the establishment of internationally accepted nomenclature and categorization of graphene-like materials (6). Much analysis of graphene requires applying sophisticated techniques only available at research and speciality measurement laboratories. For successful adoption of graphene materials in industrial applications, there is a need for simplified techniques that can provide representative, atline data to ensure the quality and repeatability of high-volume manufacturing processes. In the study presented here, a new Raman spectroscopy sampling technique has been applied to the characterization of batches of graphene product that provides a simple, atline method for obtaining key product data.
Raman spectroscopy is a tool that allows for effective identification of the sp2-carbon lattices found in graphite, graphene, and carbon nanotubes. Raman spectroscopy provides chemical and structural information based on the vibrational and rotational modes of a molecule. The samples are irradiated with a monochromatic laser and emit inelastically scattered radiation, which is then collected by the spectrometer. Raman spectroscopy has been widely used for characterizing carbon allotropes, and the technique has been valuable for the identification and quantification of these materials.
Raman spectroscopy is recommended for the analysis of graphene materials by the National Physical Laboratory (NPL) and the British Standards Institute (BSI) (7,8). The identity of graphene in Raman spectra is determined by the presence of a disorder (D) band at 1350 cm-1, a graphitic (G) band at 1585 cm-1, and a 2D band at approximately 2700 cm-1 (9). The intensity ratio of the D and G bands (ID/IG) measures the level of defects and the 2D band indicates platelet thickness. The presence of multilayer graphene in more than 10 layers or graphite is identified by a shoulder in the Raman spectrum at 2720 to 2740 cm-1.
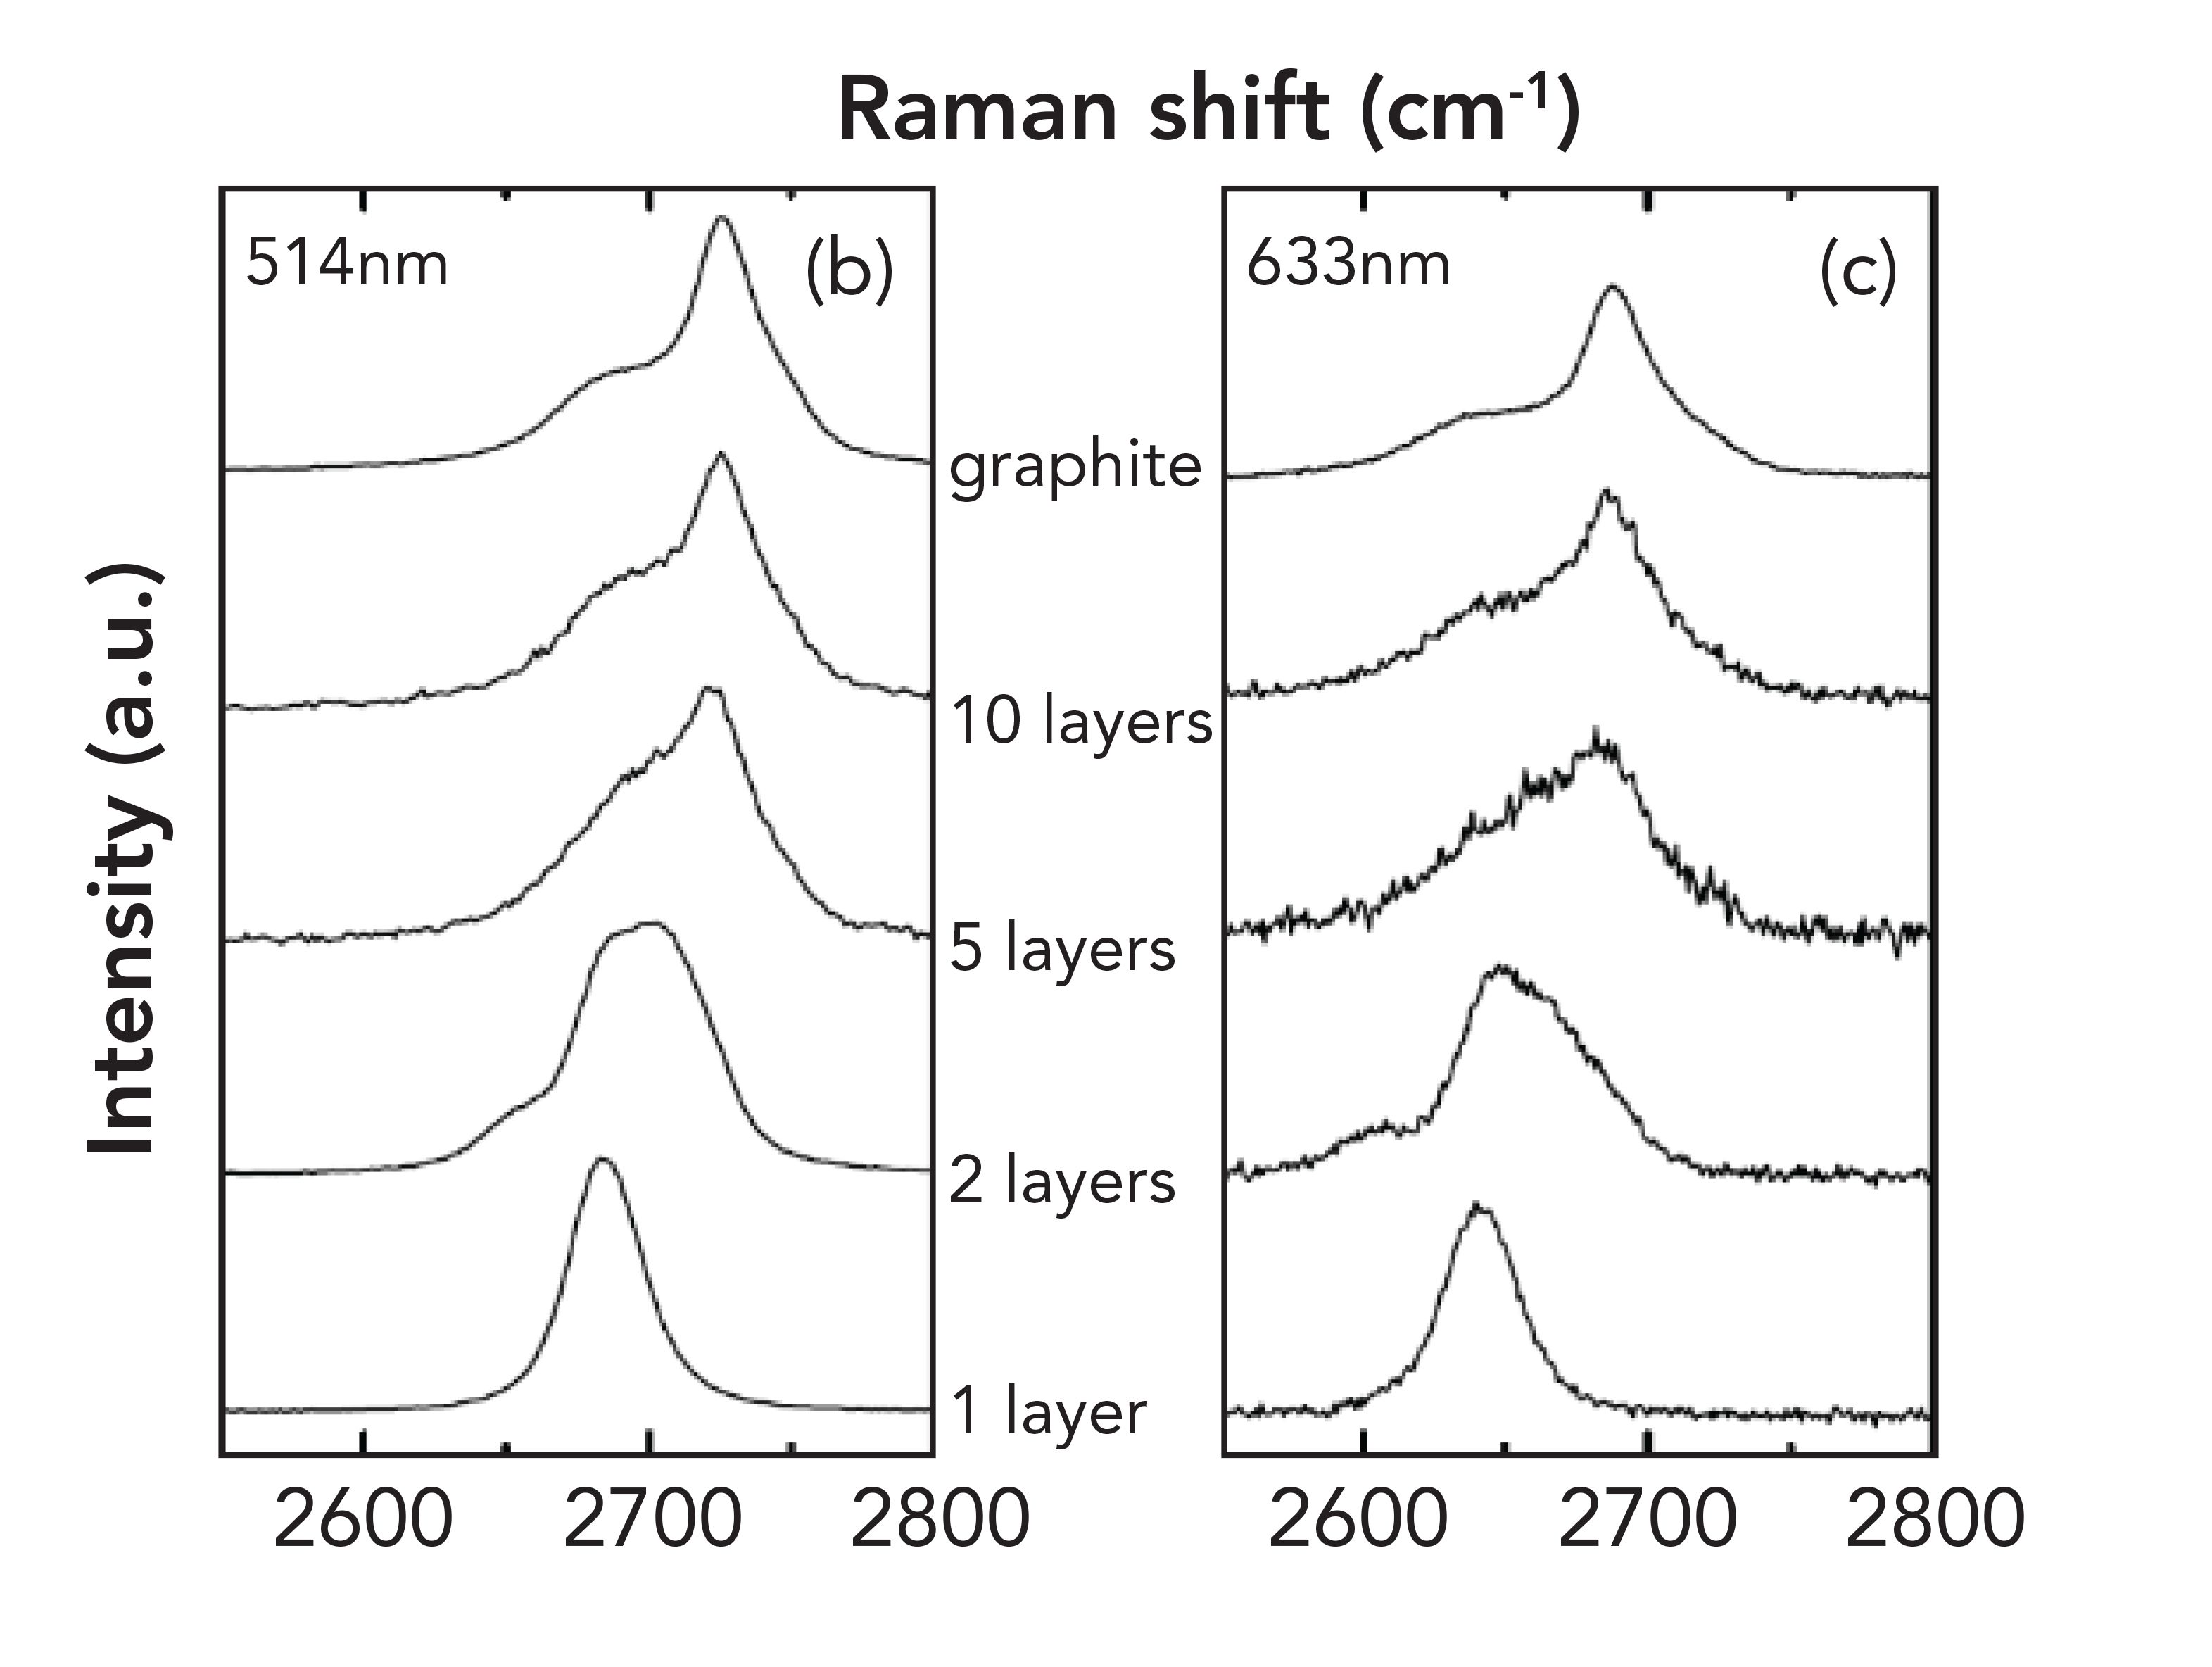
Figure 1 shows the differences within the 2D bands related to the quantity of the layers present. A band at 2720 to 2740 cm-1 is clearly evident in the graphene materials with 5 and 10 layers. The spectrum of the 10-layer material is very similar to that of graphite.
Figure 1: (b) Spectra at 514 nm with the number of layers, (c) Spectra at 633 nm with the number of layers, reproduced with permission from the literature (9).
Recent research on electrochemically exfoliated graphenes demonstrates the challenges in interpreting Raman data, including the need for representative sampling and the important impact of sample treatment prior to analysis (10).
Raman analysis of graphene products has traditionally been performed using confocal Raman microscopy. Although Raman microscopy is a useful and effective technique for research laboratories because it provides information on a microscopic scale, it is less useful for quality control and atline testing. The data cannot be considered representative of bulk products and a highly skilled operator is typically required. A new method has been developed that utilizes a portable Raman spectrometer with a large-spot, remote sampling accessory. This method enables rapid, representative analysis of graphene products directly at the manufacturing plant, ensuring excellent batch-to-batch quality control.
Materials and Methods
PureGraph graphene powders were provided by First Graphene Ltd. The PureGraph products are high aspect-ratio graphene nanoplatelet powders manufactured by the electrochemical exfoliation of Sri Lankan vein graphite. Samples of graphene powders were analyzed and received without any further sample preparation or manipulation. Sample powders were placed directly onto glass specimen holders. The samples were tested using a B&W Tek i-Raman Plus 532H system with a fiber-optic probe at 30 mW laser power at the sample and 60-s integration time with four averages (11). Samples were analyzed in an enclosure during data acquisition. The results are displayed with the anti-biasing and Savitzky-Golay smoothing algorithm.
Results and Discussion
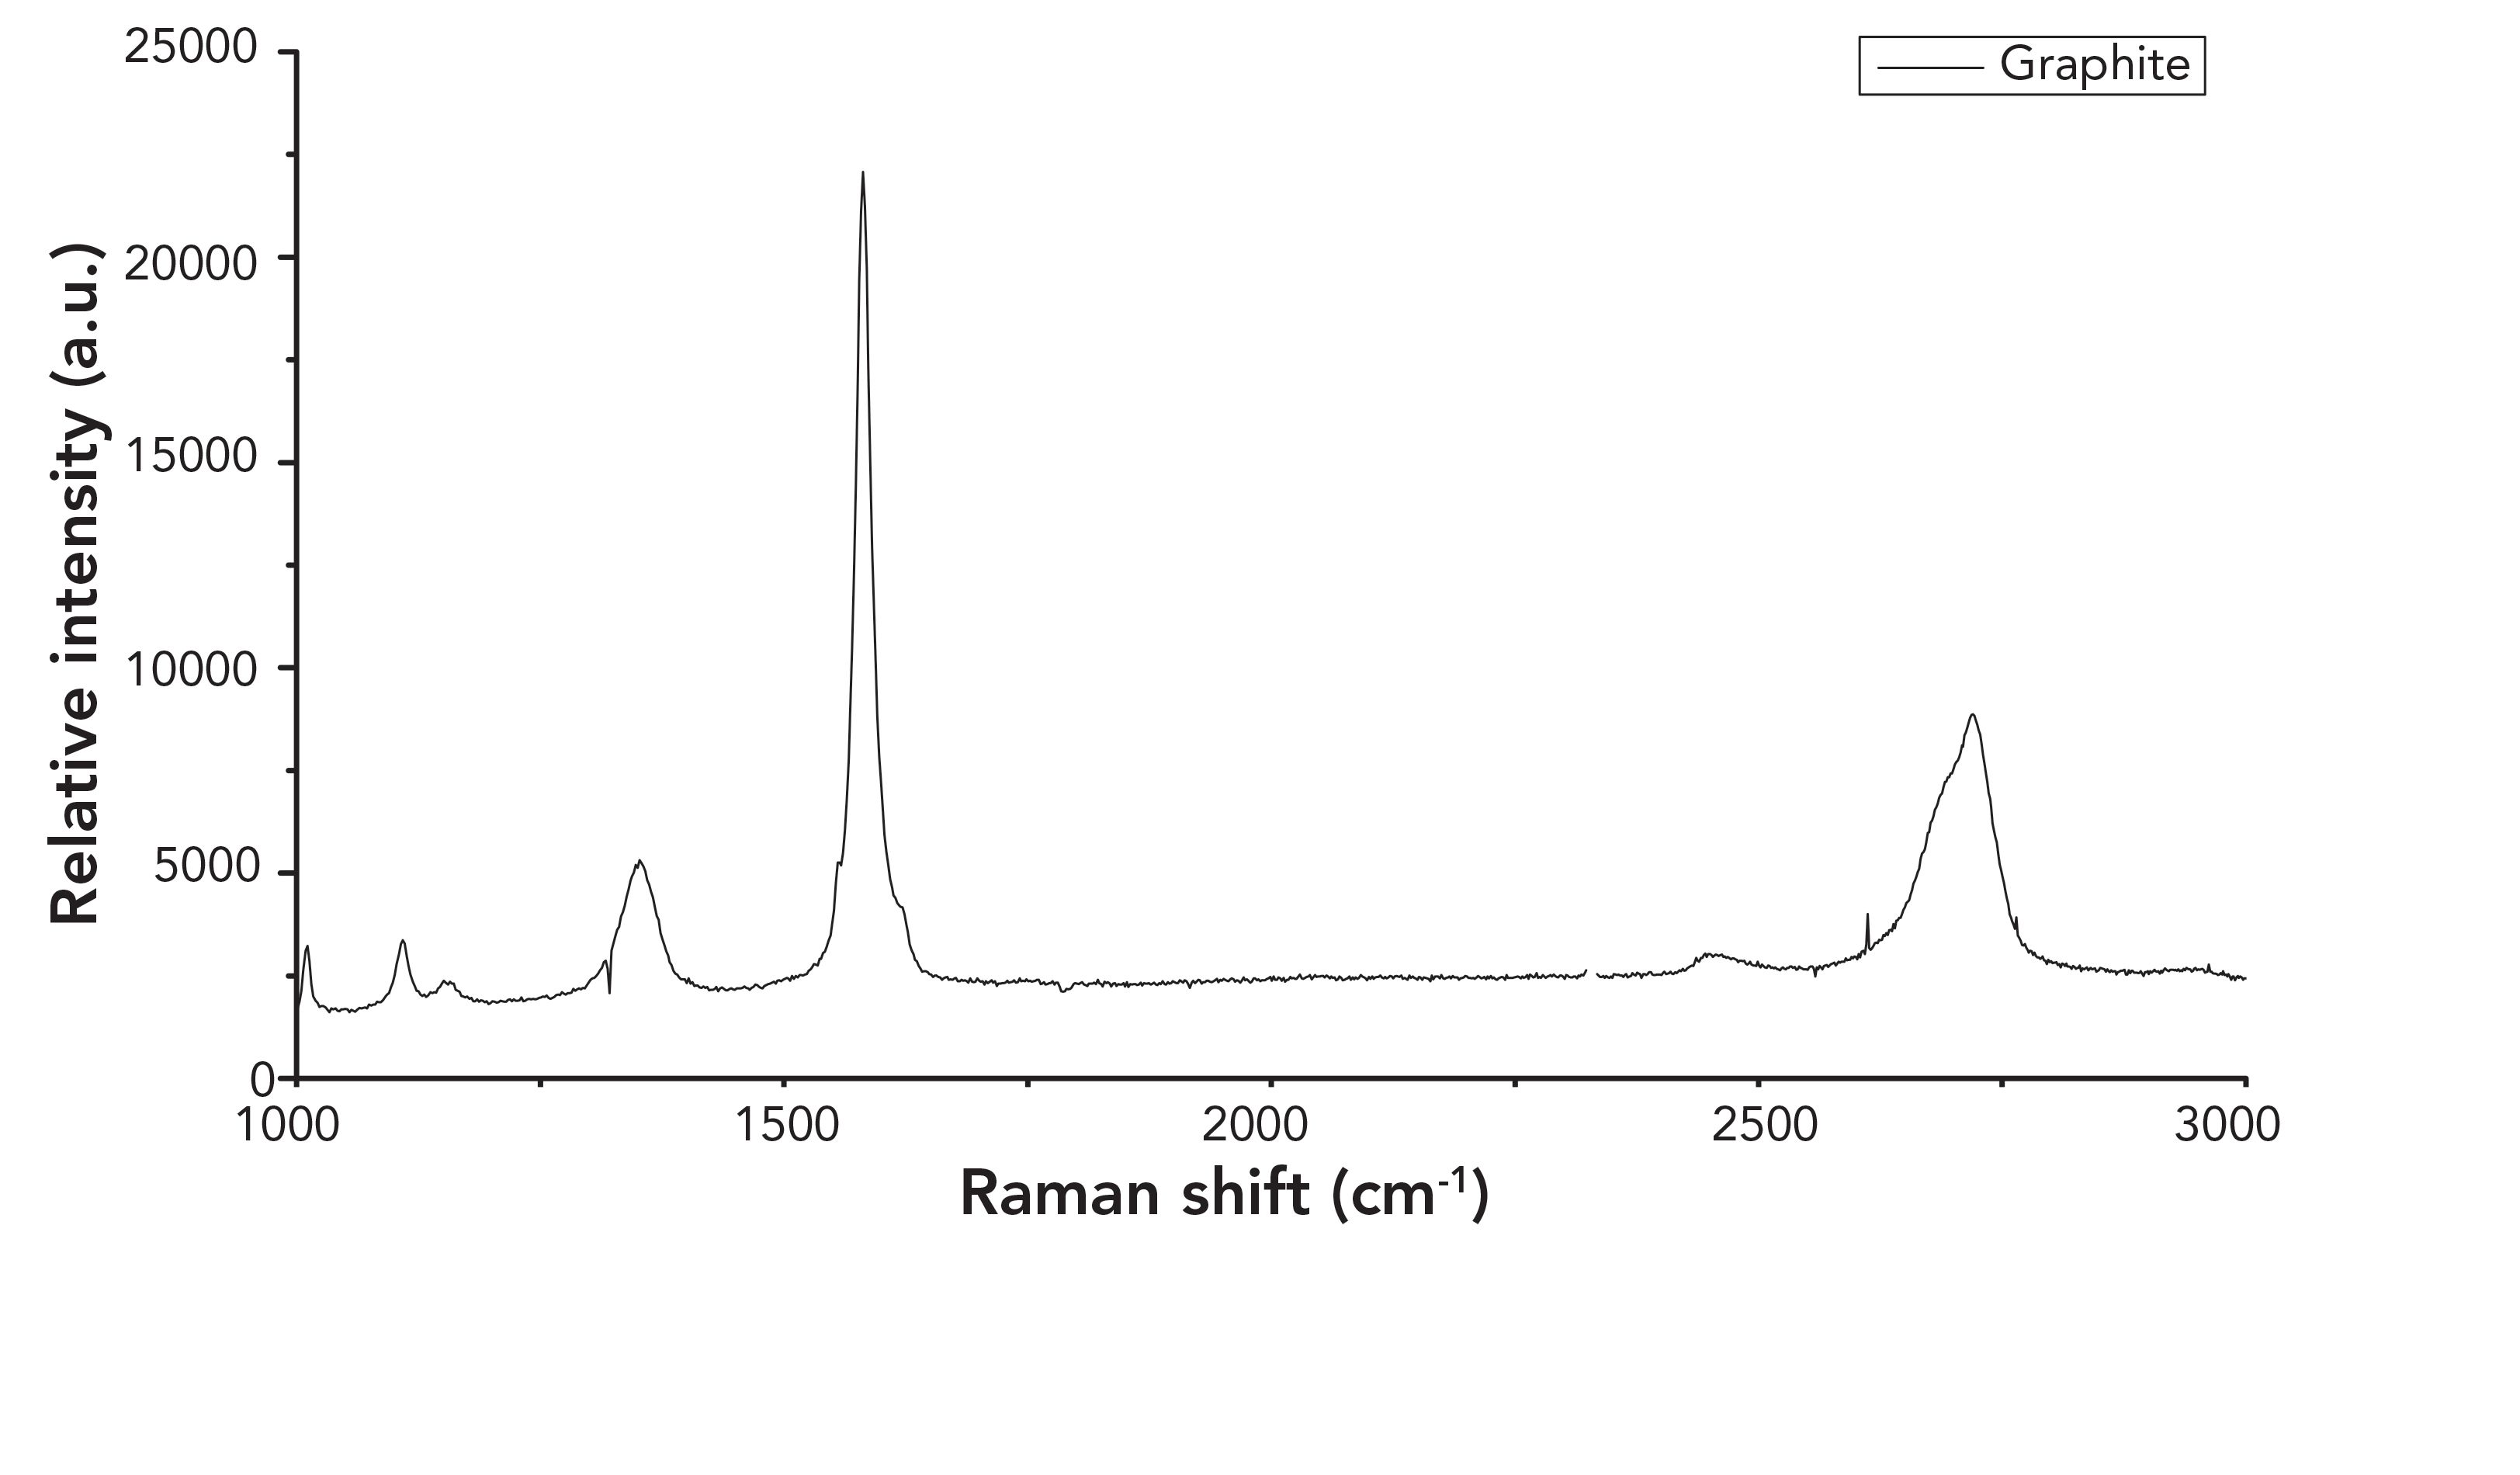
Figures 2 and 3 show the spectra obtained for the graphene products and vein graphite raw materials. Spectra of the PureGraph samples show prominent D, G, and 2D bands present at 1350 cm-1, 1585 cm-1, and 2700 cm-1, respectively. An approach based on published methods was used to analyze the level of defect in the graphene structure by examining the ratio between the D and the G bands. The G band is a result of in-plane vibrations of sp2-bonded carbon atoms whereas the D band results from out-of-plane vibrations attributed to the presence of structural defects. The lower the value of the ID/IG ratio, the greater the quality (more graphene-like properties) of the graphene sample. Some major causes of defects are: the presence of vacancies as sp3-carbon, the presence of graphene oxide, the presence of amorphous carbon, and of course, the platelet edges.
Figure 2: Raman spectra of PureGraph 5 (red), 10 (green), and 20 (blue) graphene products.
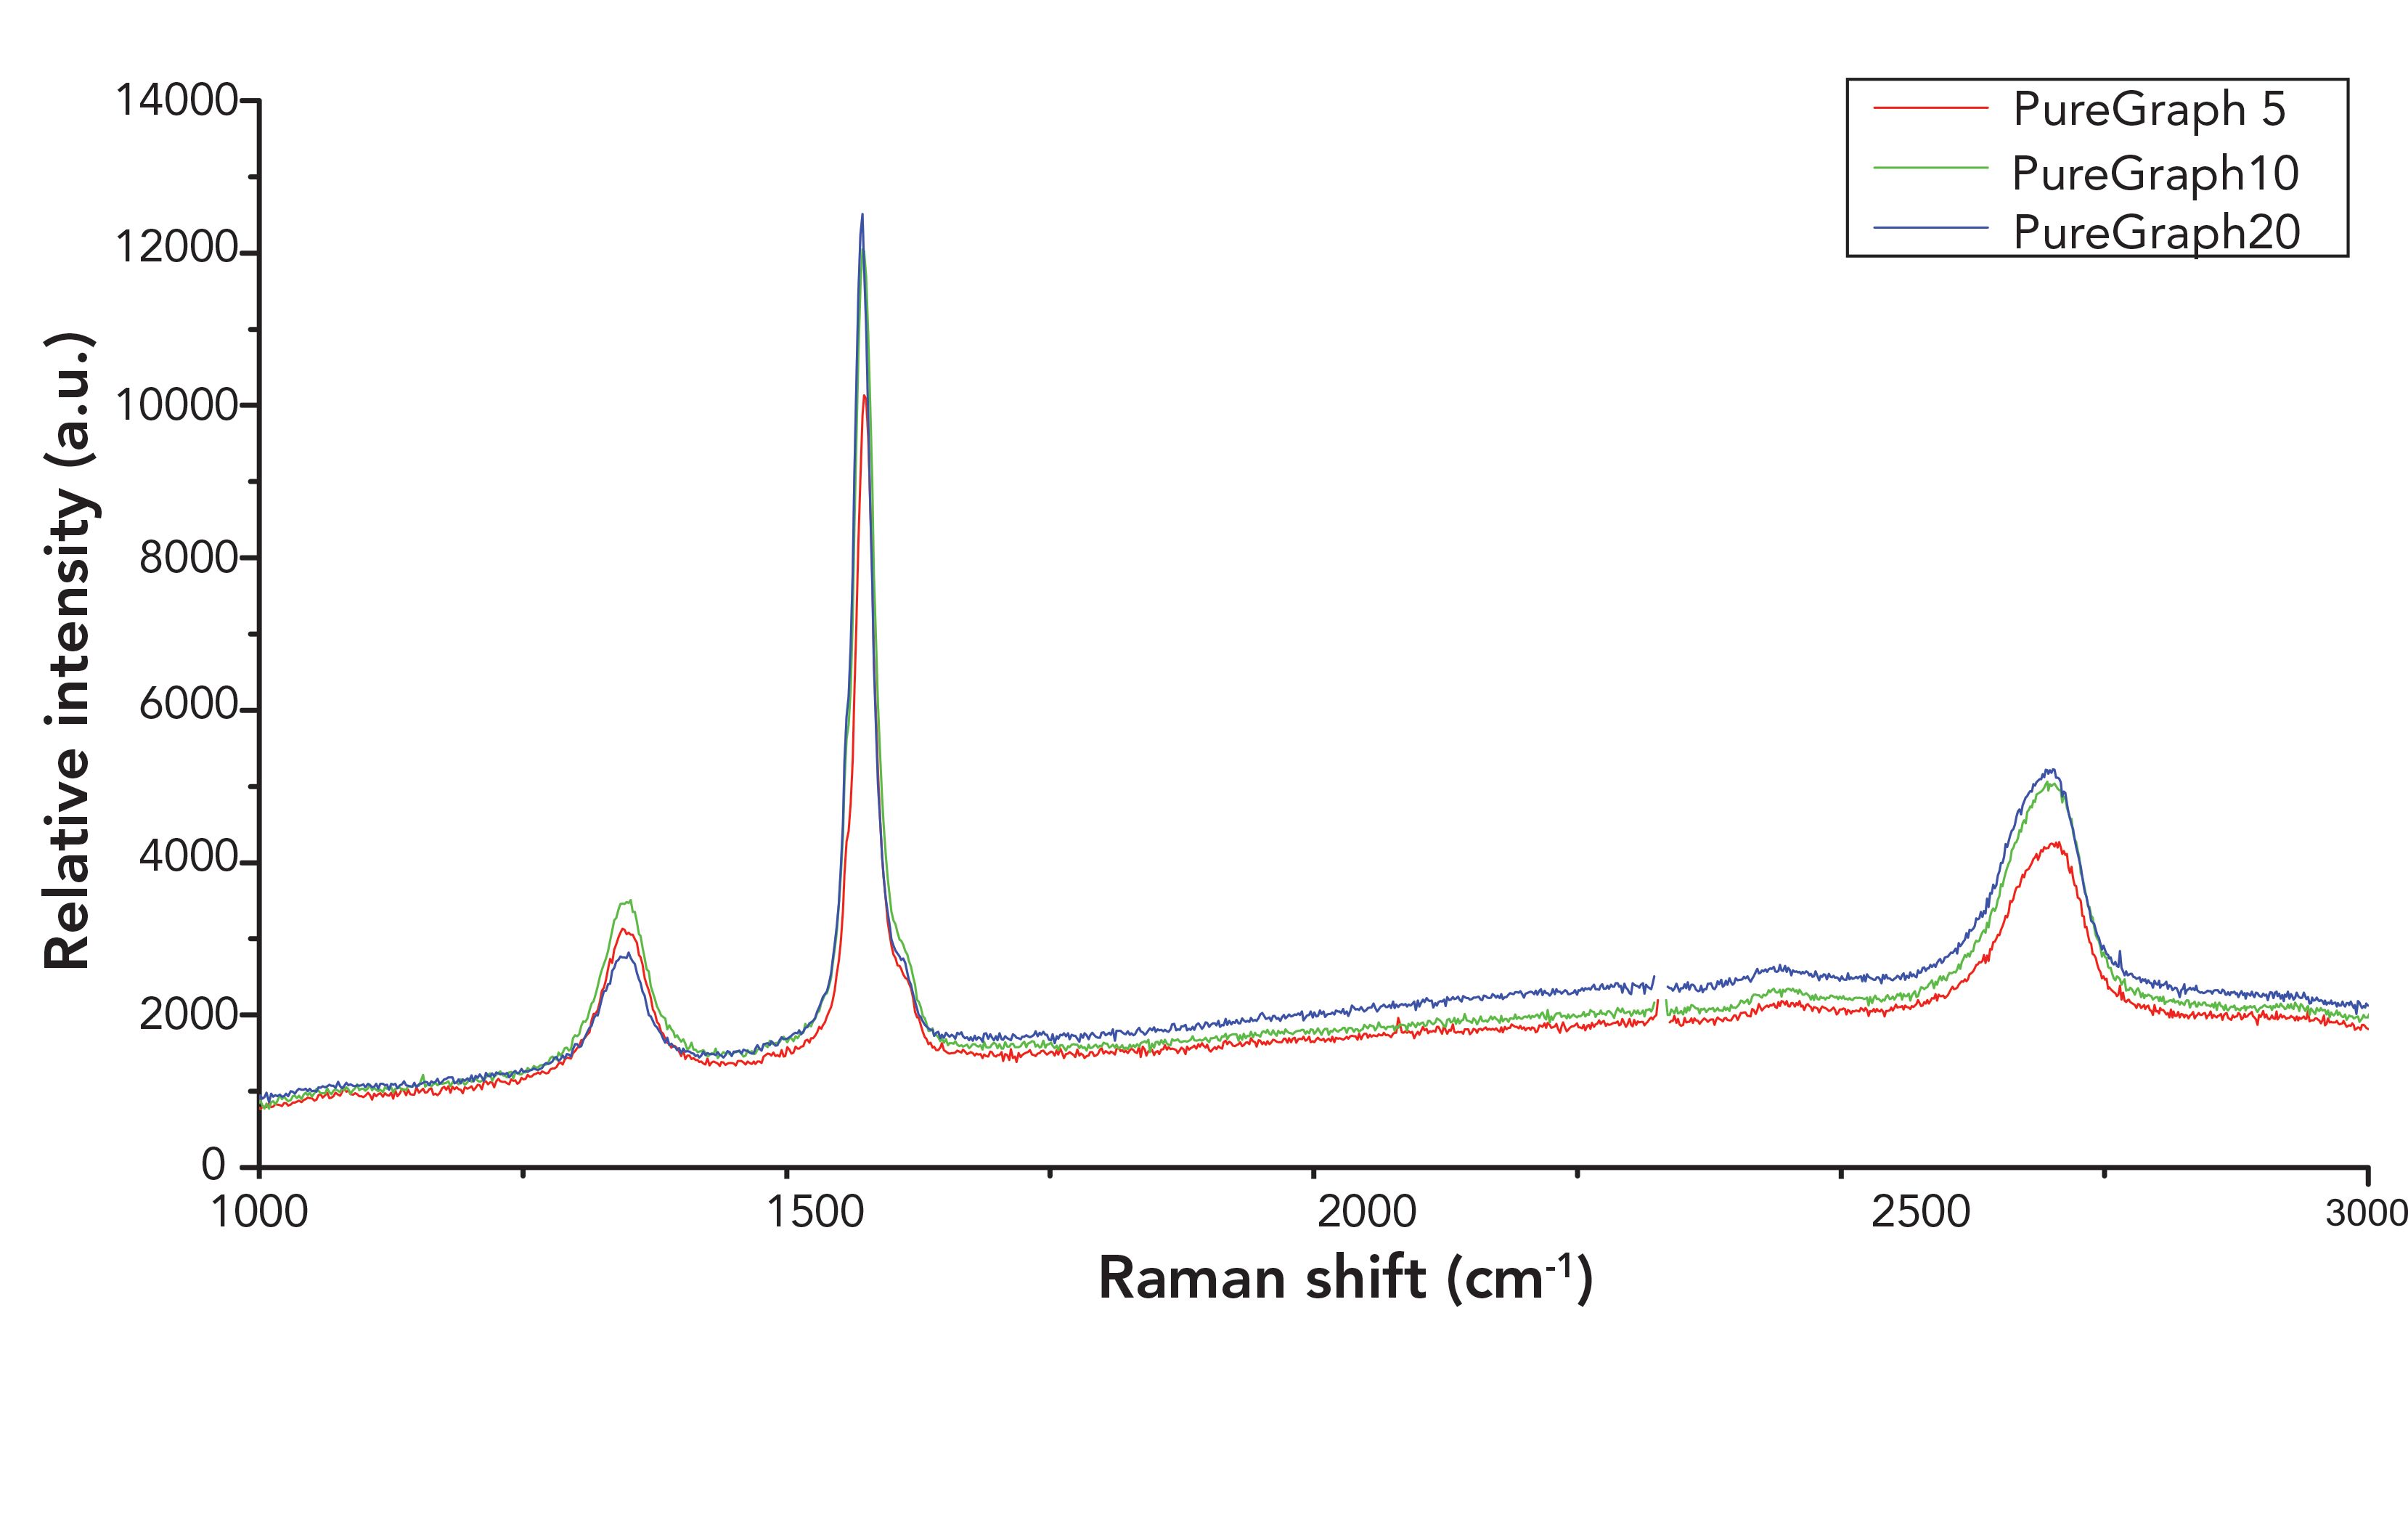
Figure 3: Raman spectrum of vein graphite raw material.
The samples show a low defect ratio (ID/IG) of 0.17 for 5 (red) and 10 (green), and 0.12 for 20 (blue). The low values of the ID/IG for PureGraph are indicative of a low level of defects in the product. This is consistent with independent oxygen analysis of the PureGraph products performed by micro-elemental analysis, which shows typical bulk oxygen levels between 1 and 2% w/w.
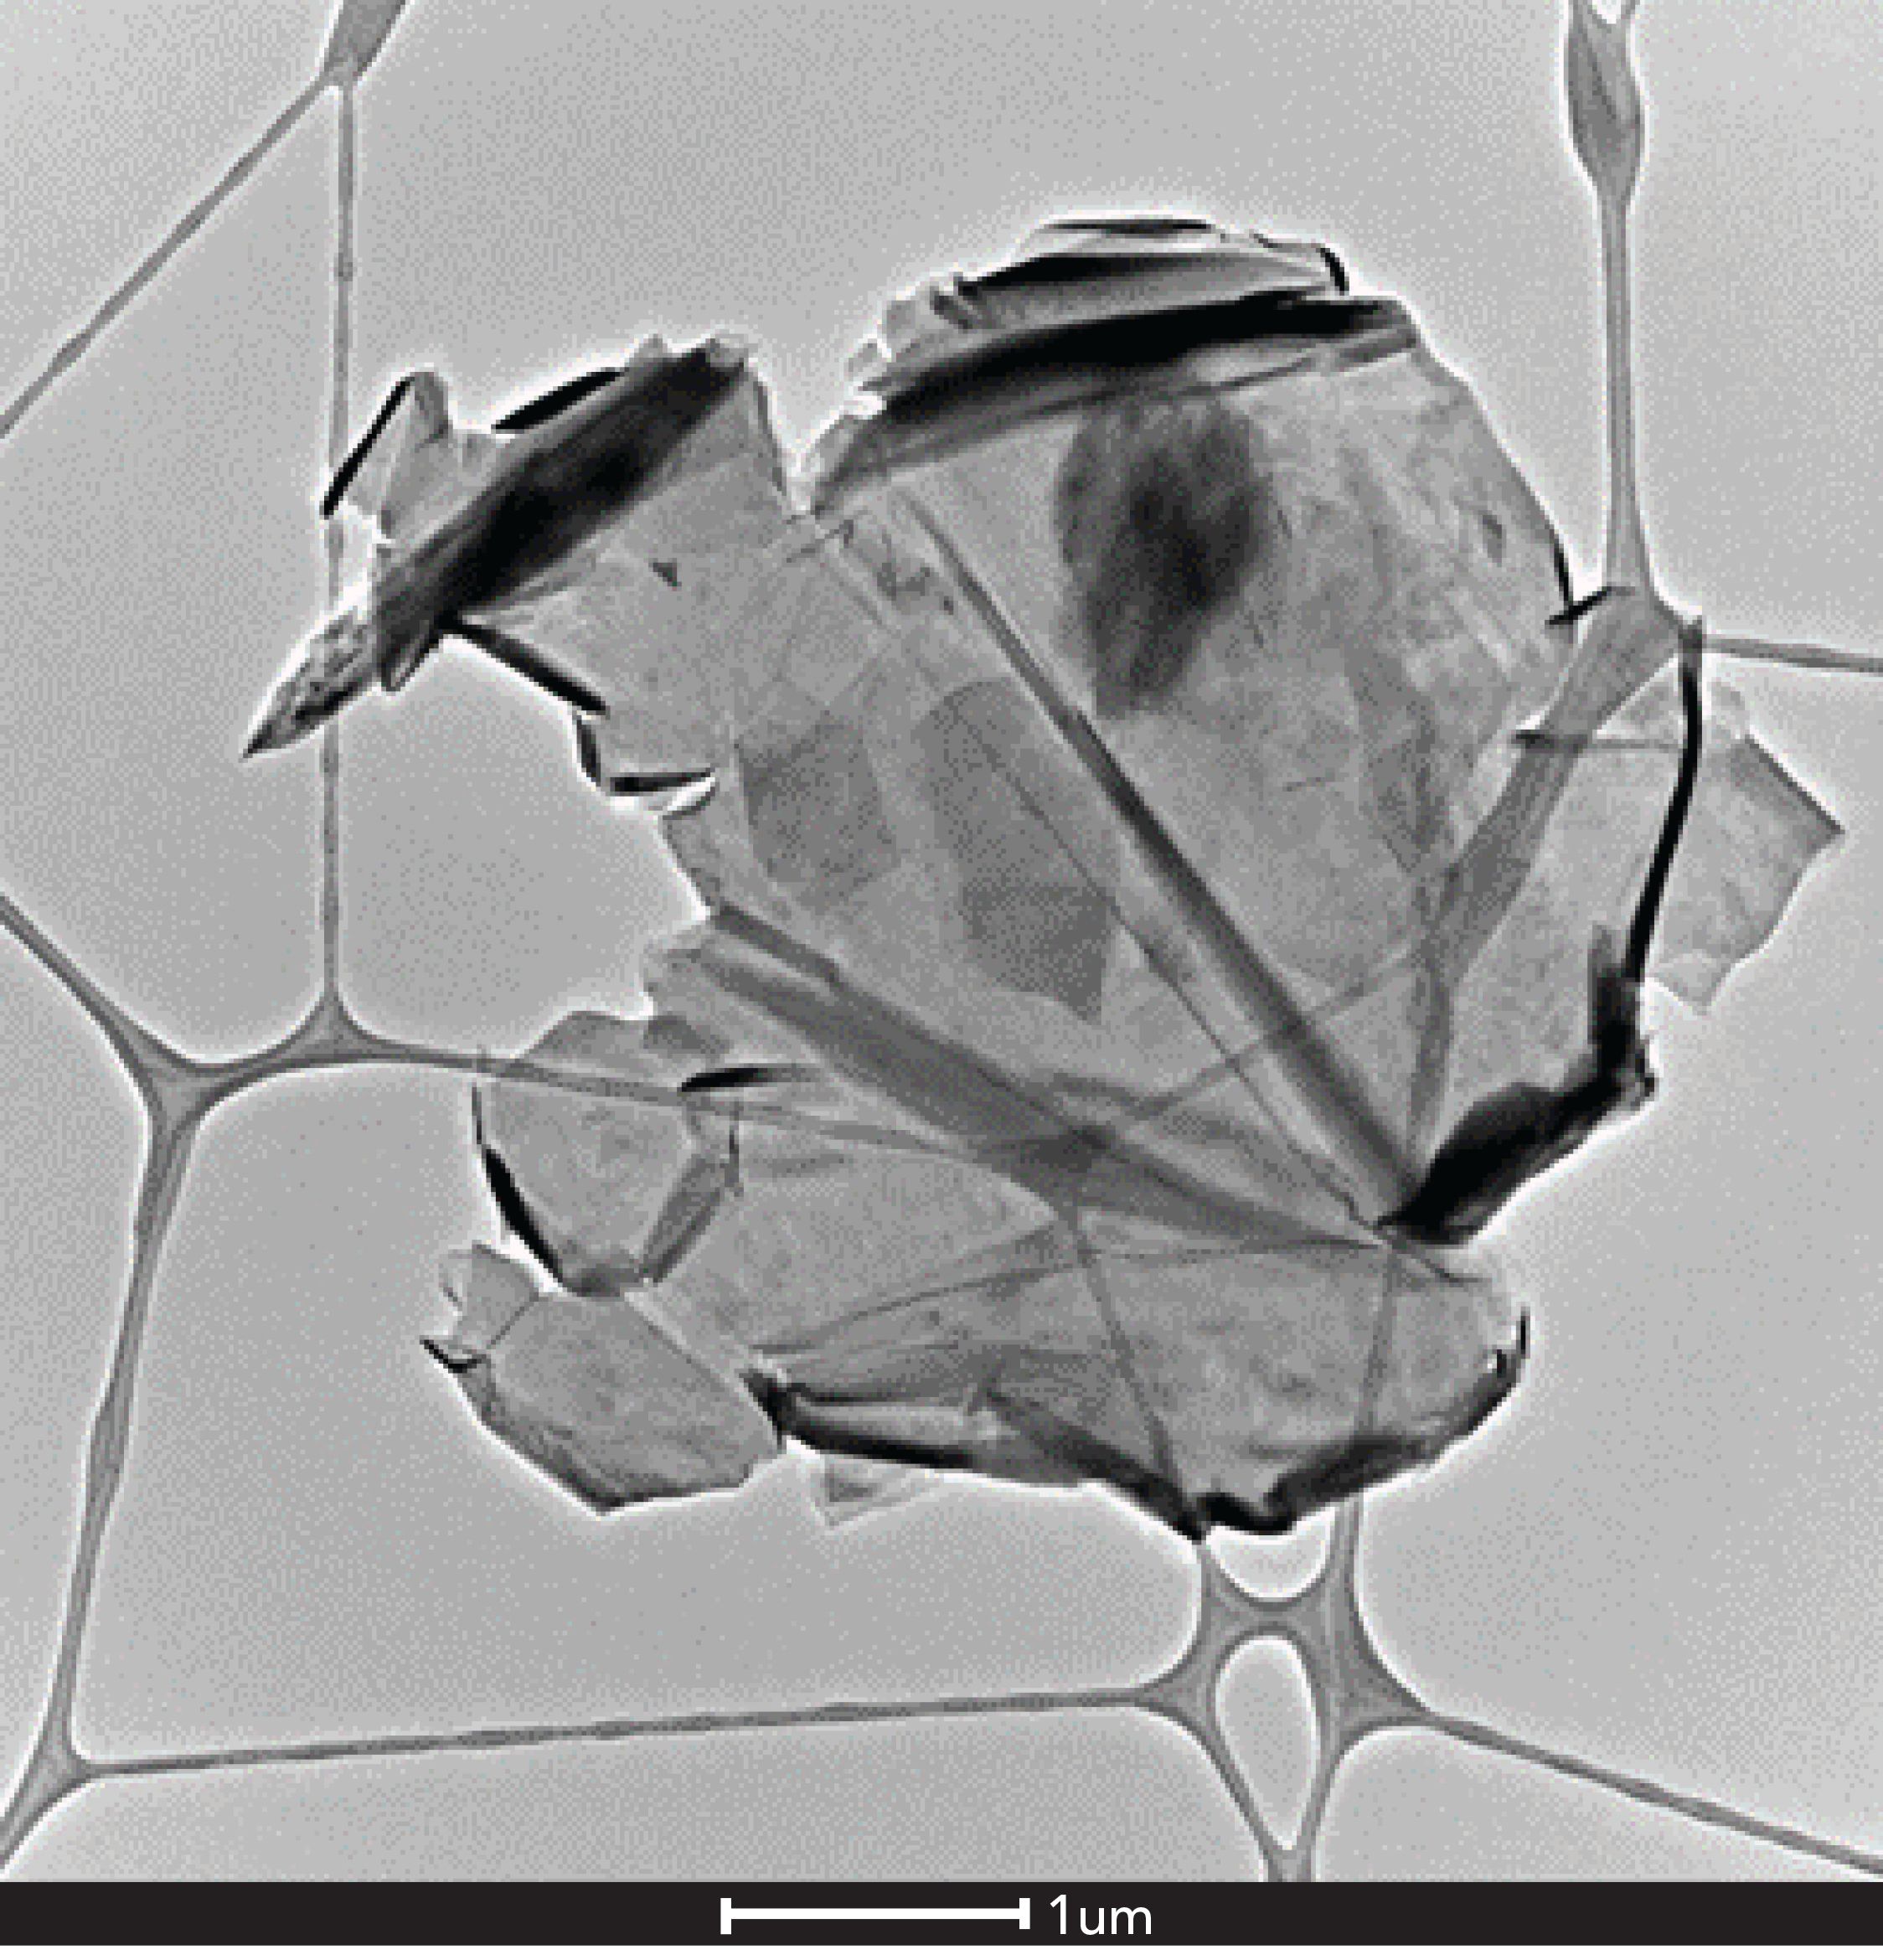
Figure 4 shows an overlay of PureGraph samples against graphite raw material. The samples clearly show the absence of the graphitic band at 2720 to 2740 cm-1. The 2D band of PureGraph products is indicative of fewer than 5 carbon layers (8). The Raman spectroscopy results indicating few-layer graphenes are consistent with microscopy analysis, supporting transmission electron microscopy images of the PureGraph 5 product are shown in Figure 5.
Figure 4: Raman spectra 2D band overlay of PureGraph 5 (red), 10 (green), and 20 (blue), and vein graphite raw material (black).
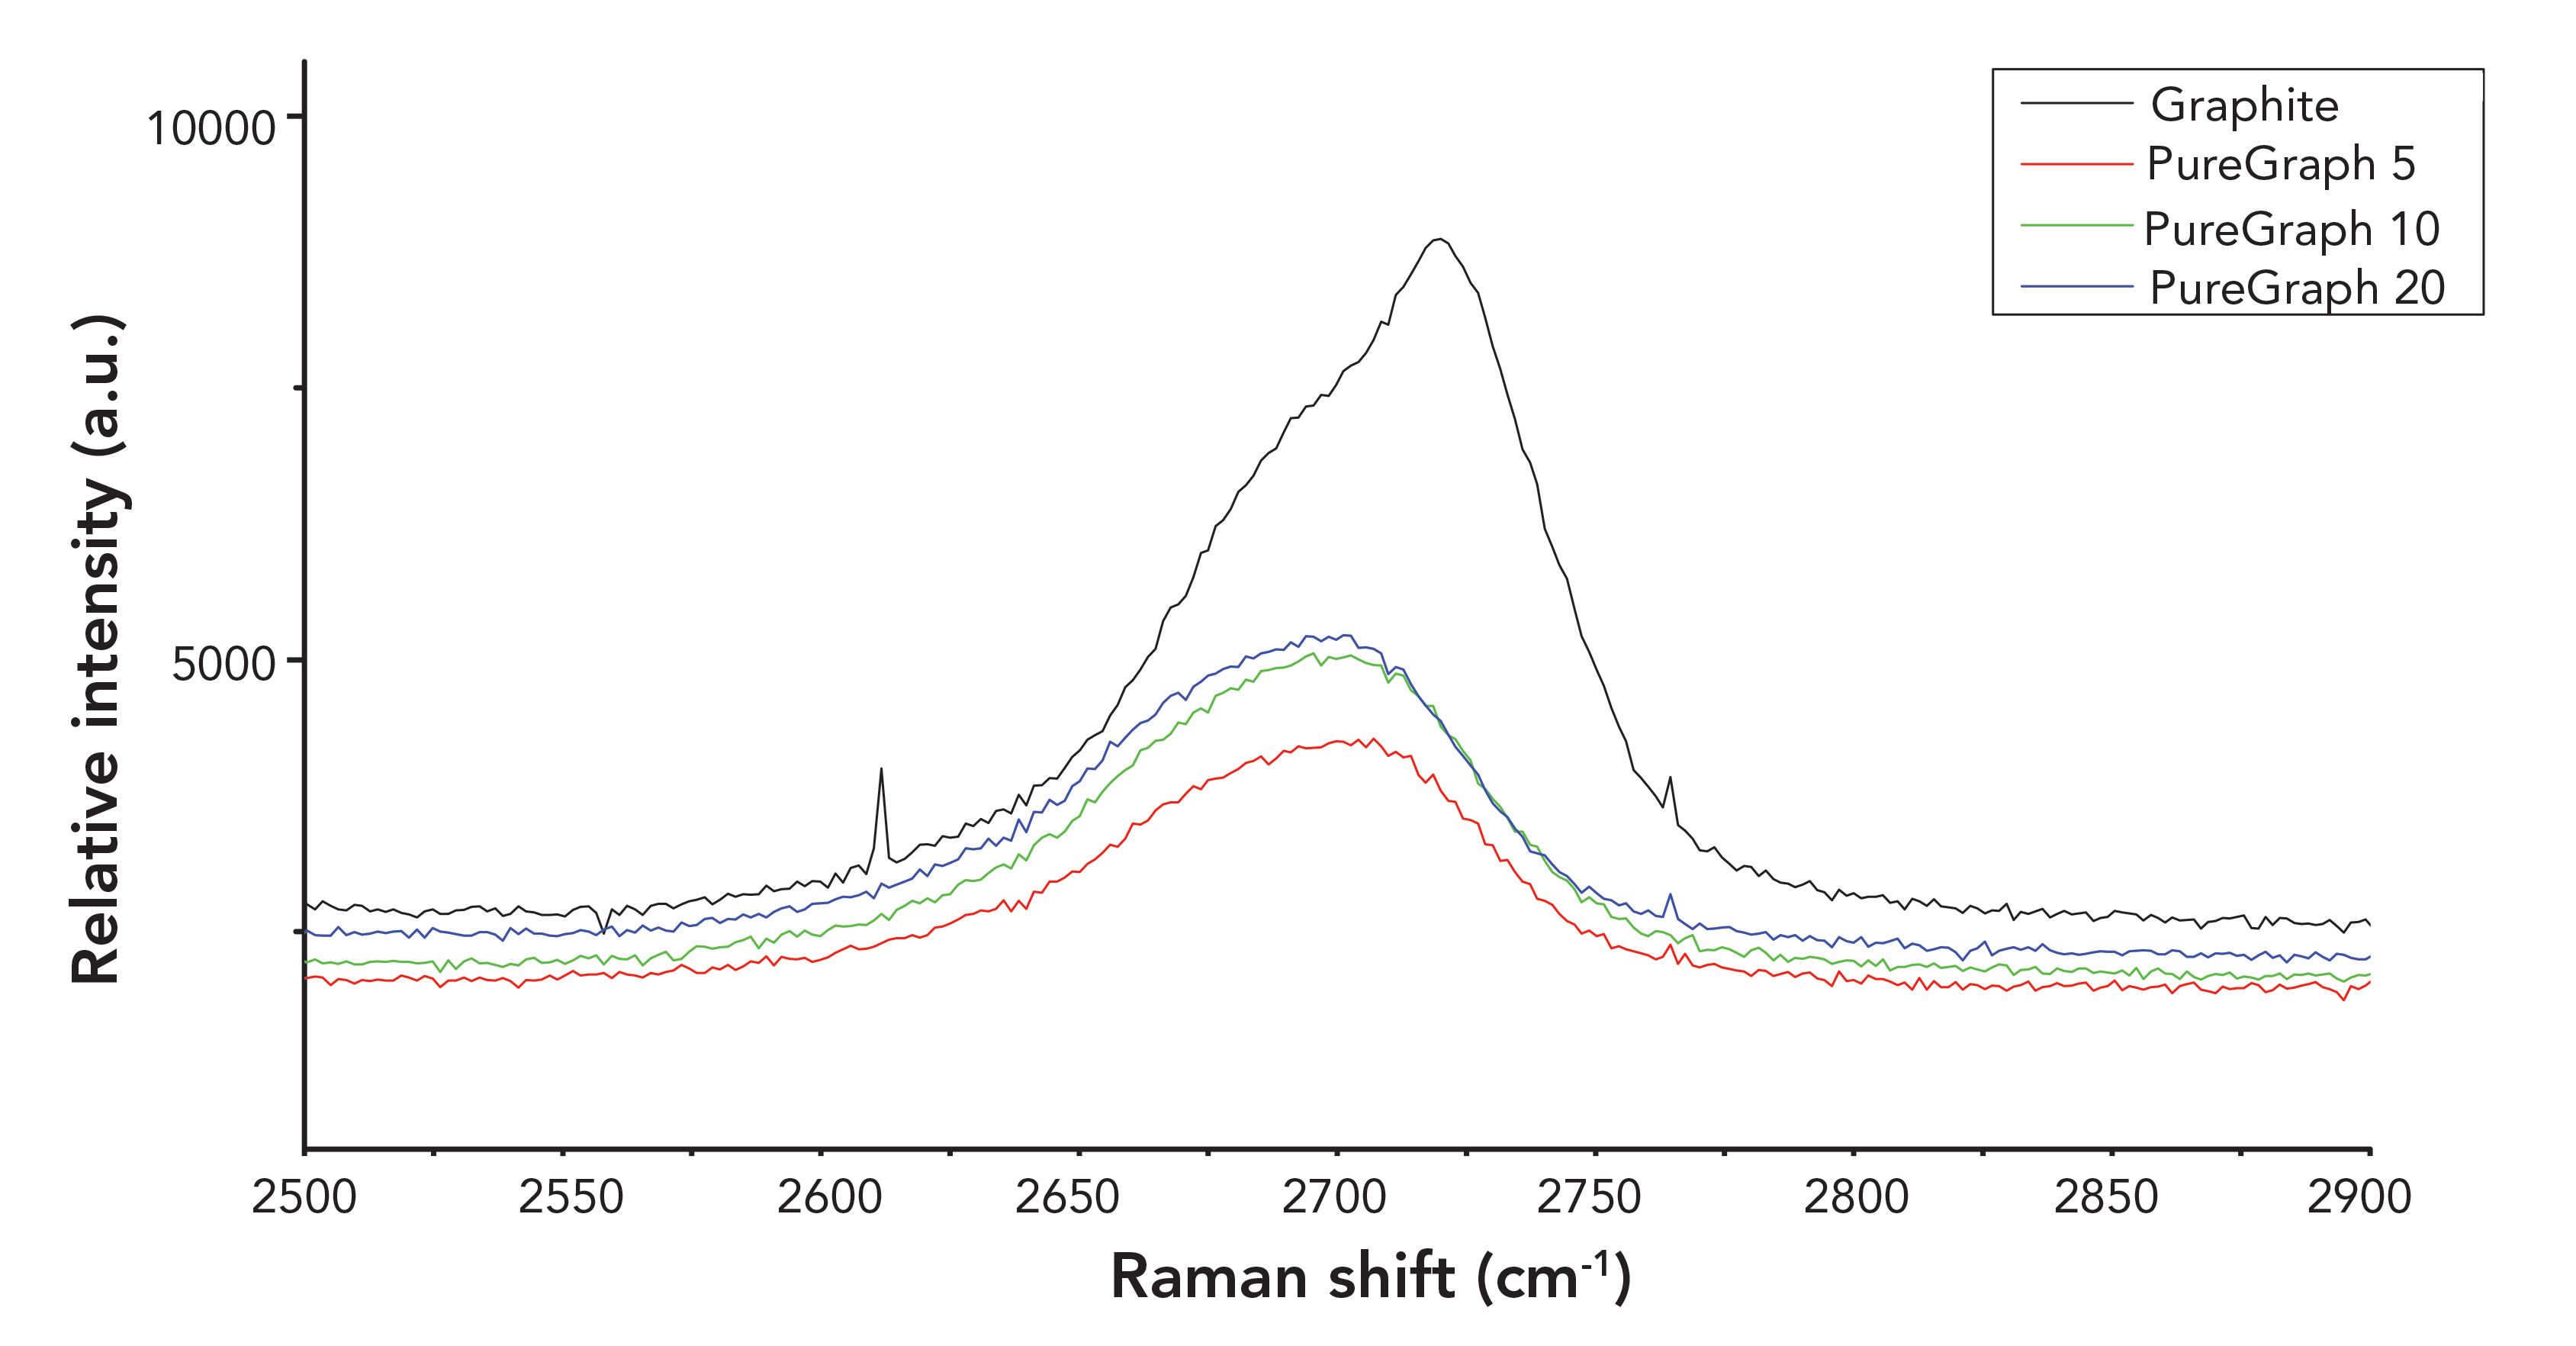
Figure 5: Transmission electron microscopic image of PureGraph 5 showing transparent few layer platelets. The darker areas at the top of the platelet are due to scrolling of the extremely thin carbon layers.
Conclusion
Atline analysis of graphene can be performed by portable Raman spectroscopy with simple equipment and no pretreatment, giving instant and representative batch data. The technique is simple to operate and does not require highly skilled operators. Atline Raman spectroscopy analysis is currently used to monitor every batch of graphene manufactured by First Graphene Ltd. Portable Raman spectroscopy confirms that the products examined in this study are low defect, high-aspect ratio graphene platelets. The analysis of the 2D band indicates that the average graphene platelet is <5 layers thick.
References
- K. Geim and K.S. Novoselov, Nat. Mater. 6, 183–192 (2007).
- K.S. Novoselov, A.K. Geim, S.V. Morozov, D. Jiang, Y. Zhang, S.V. Dubonos, I.V. Grigorieva, and A.A. Firsov, Science 306, 666 (2004).
- J. Phiri, P. Gane, and T.C. Maloney, Mater. Sci. Eng. 215, 9–28 (2017).
- C. Ahn, S.W. Fong, Y. Kim, S. Lee, A. Sood, C.M. Neumann, M. Asheghi, K.E. Goodson, E. Pop, and H.S.P. Wong, Nano Lett. 15, 6809–6814 (2015).
- First Graphene, Applications. firstgraphene.net/applications/ (accessed October 2020).
- International Organization for Standardization (ISO), ISO/TS 80004-13:2017, Nanotechnologies — Vocabulary — Part 13: Graphene and related two-dimensional (2D) materials (ISO, Geneva, Switzerland).
- A.J. Pollard, K.R. Paton, C.A. Clifford, E. Legge, A. Oikonomou, S. Haigh, C. Casiraghi, L. Nguyen, and D. Kelly, Characterisation of the Structure of Graphene (NPL, Middlesex, United Kingdom, 2017).
- British Standards Institute, PAS 1201:2018 Properties of Graphene Flakes – Guide BSI (British Standards Institute, London, United Kingdom, 2018)
- A.C. Ferrari, F. Bonaccorso, A. Lombardo, T. Hasan, Z. Sun, and L. Colombo, Phys. Lett. Rev. 97, 187–401 (2006).
- V. Nagyte, D.J. Kelly, A. Felten, G. Picardi, Y. Shin, A. Alieva, R.E. Worsley, K. Parvez, S. Dehm, R. Krupke, S.J. Haigh, A. Oikonomou, A.J. Pollard, and C. Casiraghi, Nano Lett. 20(5), 3411–3419 (2020).
- B&W Tek, Inc., Portable Raman Spectrometer. http://bwtek.com/products/i-raman-plus/ (accessed October 2020).
Dawid Polanski and Enrique Lozano Diz are with B&W Tek, Inc. Michael Watson and Andy Goodwin are with First Graphene Ltd. Direct correspondence to: michael.watson@firstgraphene.net

AI-Powered SERS Spectroscopy Breakthrough Boosts Safety of Medicinal Food Products
April 16th 2025A new deep learning-enhanced spectroscopic platform—SERSome—developed by researchers in China and Finland, identifies medicinal and edible homologs (MEHs) with 98% accuracy. This innovation could revolutionize safety and quality control in the growing MEH market.
New Raman Spectroscopy Method Enhances Real-Time Monitoring Across Fermentation Processes
April 15th 2025Researchers at Delft University of Technology have developed a novel method using single compound spectra to enhance the transferability and accuracy of Raman spectroscopy models for real-time fermentation monitoring.
Nanometer-Scale Studies Using Tip Enhanced Raman Spectroscopy
February 8th 2013Volker Deckert, the winner of the 2013 Charles Mann Award, is advancing the use of tip enhanced Raman spectroscopy (TERS) to push the lateral resolution of vibrational spectroscopy well below the Abbe limit, to achieve single-molecule sensitivity. Because the tip can be moved with sub-nanometer precision, structural information with unmatched spatial resolution can be achieved without the need of specific labels.