Catalytic Kinetic Fluorimetric Detection of Trace Amounts of Bismuth
A catalytic kinetic fluorescence method for the detection of trace bismuth (III) was developed, which focuses on the fading reaction of hydrogen peroxide that oxidizes eosin Y under the acidity of pH 4.50 and 90 oC. Experiments showed that bismuth could catalyze the oxidation of eosin Y by hydrogen peroxide; simultaneously, the fluorescence in- tensity was weakened or lost. The linear relationship between bismuth and eosin Y can be used to determine trace amounts of bismuth. The results showed that the concentration of bismuth in the range of 4.0 × 10⁻⁴ to 4.0 × 10⁻³ μg/L showed a good linear relationship with lg(I0F /IF), the correlation coefficient was 0.9971, and the detection limit of the method was 1.9 × 10⁻⁵ μg/L. The method could be used for the determination of bismuth in human hair and water samples.
Bismuth is known as the “green metal” and is widely used in the medical and health industry. Bismuth has a significant role in the treatment of gastric diseases such as gastric ulcers. In addition, bismuth is also used in semiconductor materials, cosmetics, dyes, biomedical science, combustion aids, and other industries (1–3). Therefore, it is significant to study methods for the determination of bismuth in the environment. Currently, measurement methods for bismuth mainly include resonance light scattering spectrometry (RLS), atomic absorption spectrometry (AAS), ethylenediaminetetraacetic acid (EDTA) titration, extraction spectrophotometry, flow injection analysis (FIA), inhibition kinetic spectrophotometry, inductively coupled plasma–atomic emission spectrometry (ICP-AES), adsorptive stripping voltammetry, and fluorescence spectrometry (4–13). Kinetic spectrophotometry has the advantages of high sensitivity and simple operation and has been extensively discussed in reports of determination of trace elements. Therefore, kinetic spectrophotometry has become a very important method for the analysis and detection of microtrace elements (14–20). Three-dimensional fluorescence spectroscopy is a new fluorescence analysis technology that was developed within the past 10 years. It is a function of two wavelength parameters, of excitation and emission. The three-dimensional fluorescence spectrum can be displayed by a three-dimensional stereogram or a planar contour map, which has the advantages of simplicity and intuitiveness (21–23).
It was found that trace amounts of bismuth had a significant catalytic effect on the reaction of eosin Y with hydrogen peroxide under pH 4.50 and 90 oC. A novel catalytic kinetic fluorescence method was established for the determination of trace bismuth. The method has a low detection limit, high sensitivity, and simple operation. It also has the ability to determine trace bismuth in human hair and sewage samples.
Experimental
Apparatus
The fluorescence measurements were carried out with an F-7100 fluorescence spectrophotometer (Hitachi). Absorption spectra were recorded on a U-3900H UV-Vis spectrophotometer (Hitachi). The pH was measured by a pHS-3C meter (Shanghai Leici Instruments). The solution was heated in a HH-2 thermostatic water bath (Shanghai Lichen Instrument Technology).
Reagents
The stock solution of bismuth (0.1000 g/L) was prepared as follows: 0.2320 g of Bi(NO3)3 x 5H2O (Tianjin Comeo Chemical Reagent Development Center, China) dis- solved in 10 mL of nitric acid solution (φ = 25%) and diluted to 1000 mL. The stock solution was diluted to 0.1000 μg/L as a standard working solution with water, 25% nitric acid solution, 0.20 mg/mL (w/v) eosin Y solution, 3% (v/v) hydrogen peroxide solution, and 1.00% (w/v) EDTA solution. The reagents were of analytical regent (AR) grade, and doubly distilled water was used throughout this work.
Experimental Method
At a pH of 4.50, 1.50 mL of 0.20 mg/ mL eosin Y solution, 5.00 mL of 3% H2O2 solution, and 0.1000 μg/L in different volumes of the standard solution of bismuth were poured into a 25-mL colorimetric tube with stopper. The mixture was diluted to the mark with water and mixed thoroughly. The solution was heated in a 90 oC water bath for 15 min before it was cooled to room temperature. The solution was then cooled with cold running water for 5 min before 2 mL of 1% EDTA was added to terminate the reaction. The fluorescence spectra of the system were recorded at λex = 515 nm and λem = 542 nm, and the absorbance was measured in a 1-cm cell at the wavelength of the maximum absorbance against a reagent blank. The variation of the fluorescence intensities was denoted as the relative fluorescence intensity lg(I0F/IF), or ΔI = I0F - IF. When the relative intensity was calculated, a standard curve within a specific concentration range was made. F and F0 were the fluorescence intensities of system and reagent blank, respectively.
Results and Discussion
Verification Test
The verification test examined whether bismuth catalyzed with eosin Y and caused the discoloration in the presence of hydrogen peroxide. If it does, the eosin Y system should see a reduction in its fluorescence intensity and show a linear relationship. To determine the accuracy of the verification test, a reference was selected, according to the principles of the experiment.
FIGURE 1: Effect of Bi(III) on the discoloration of eosin Y.
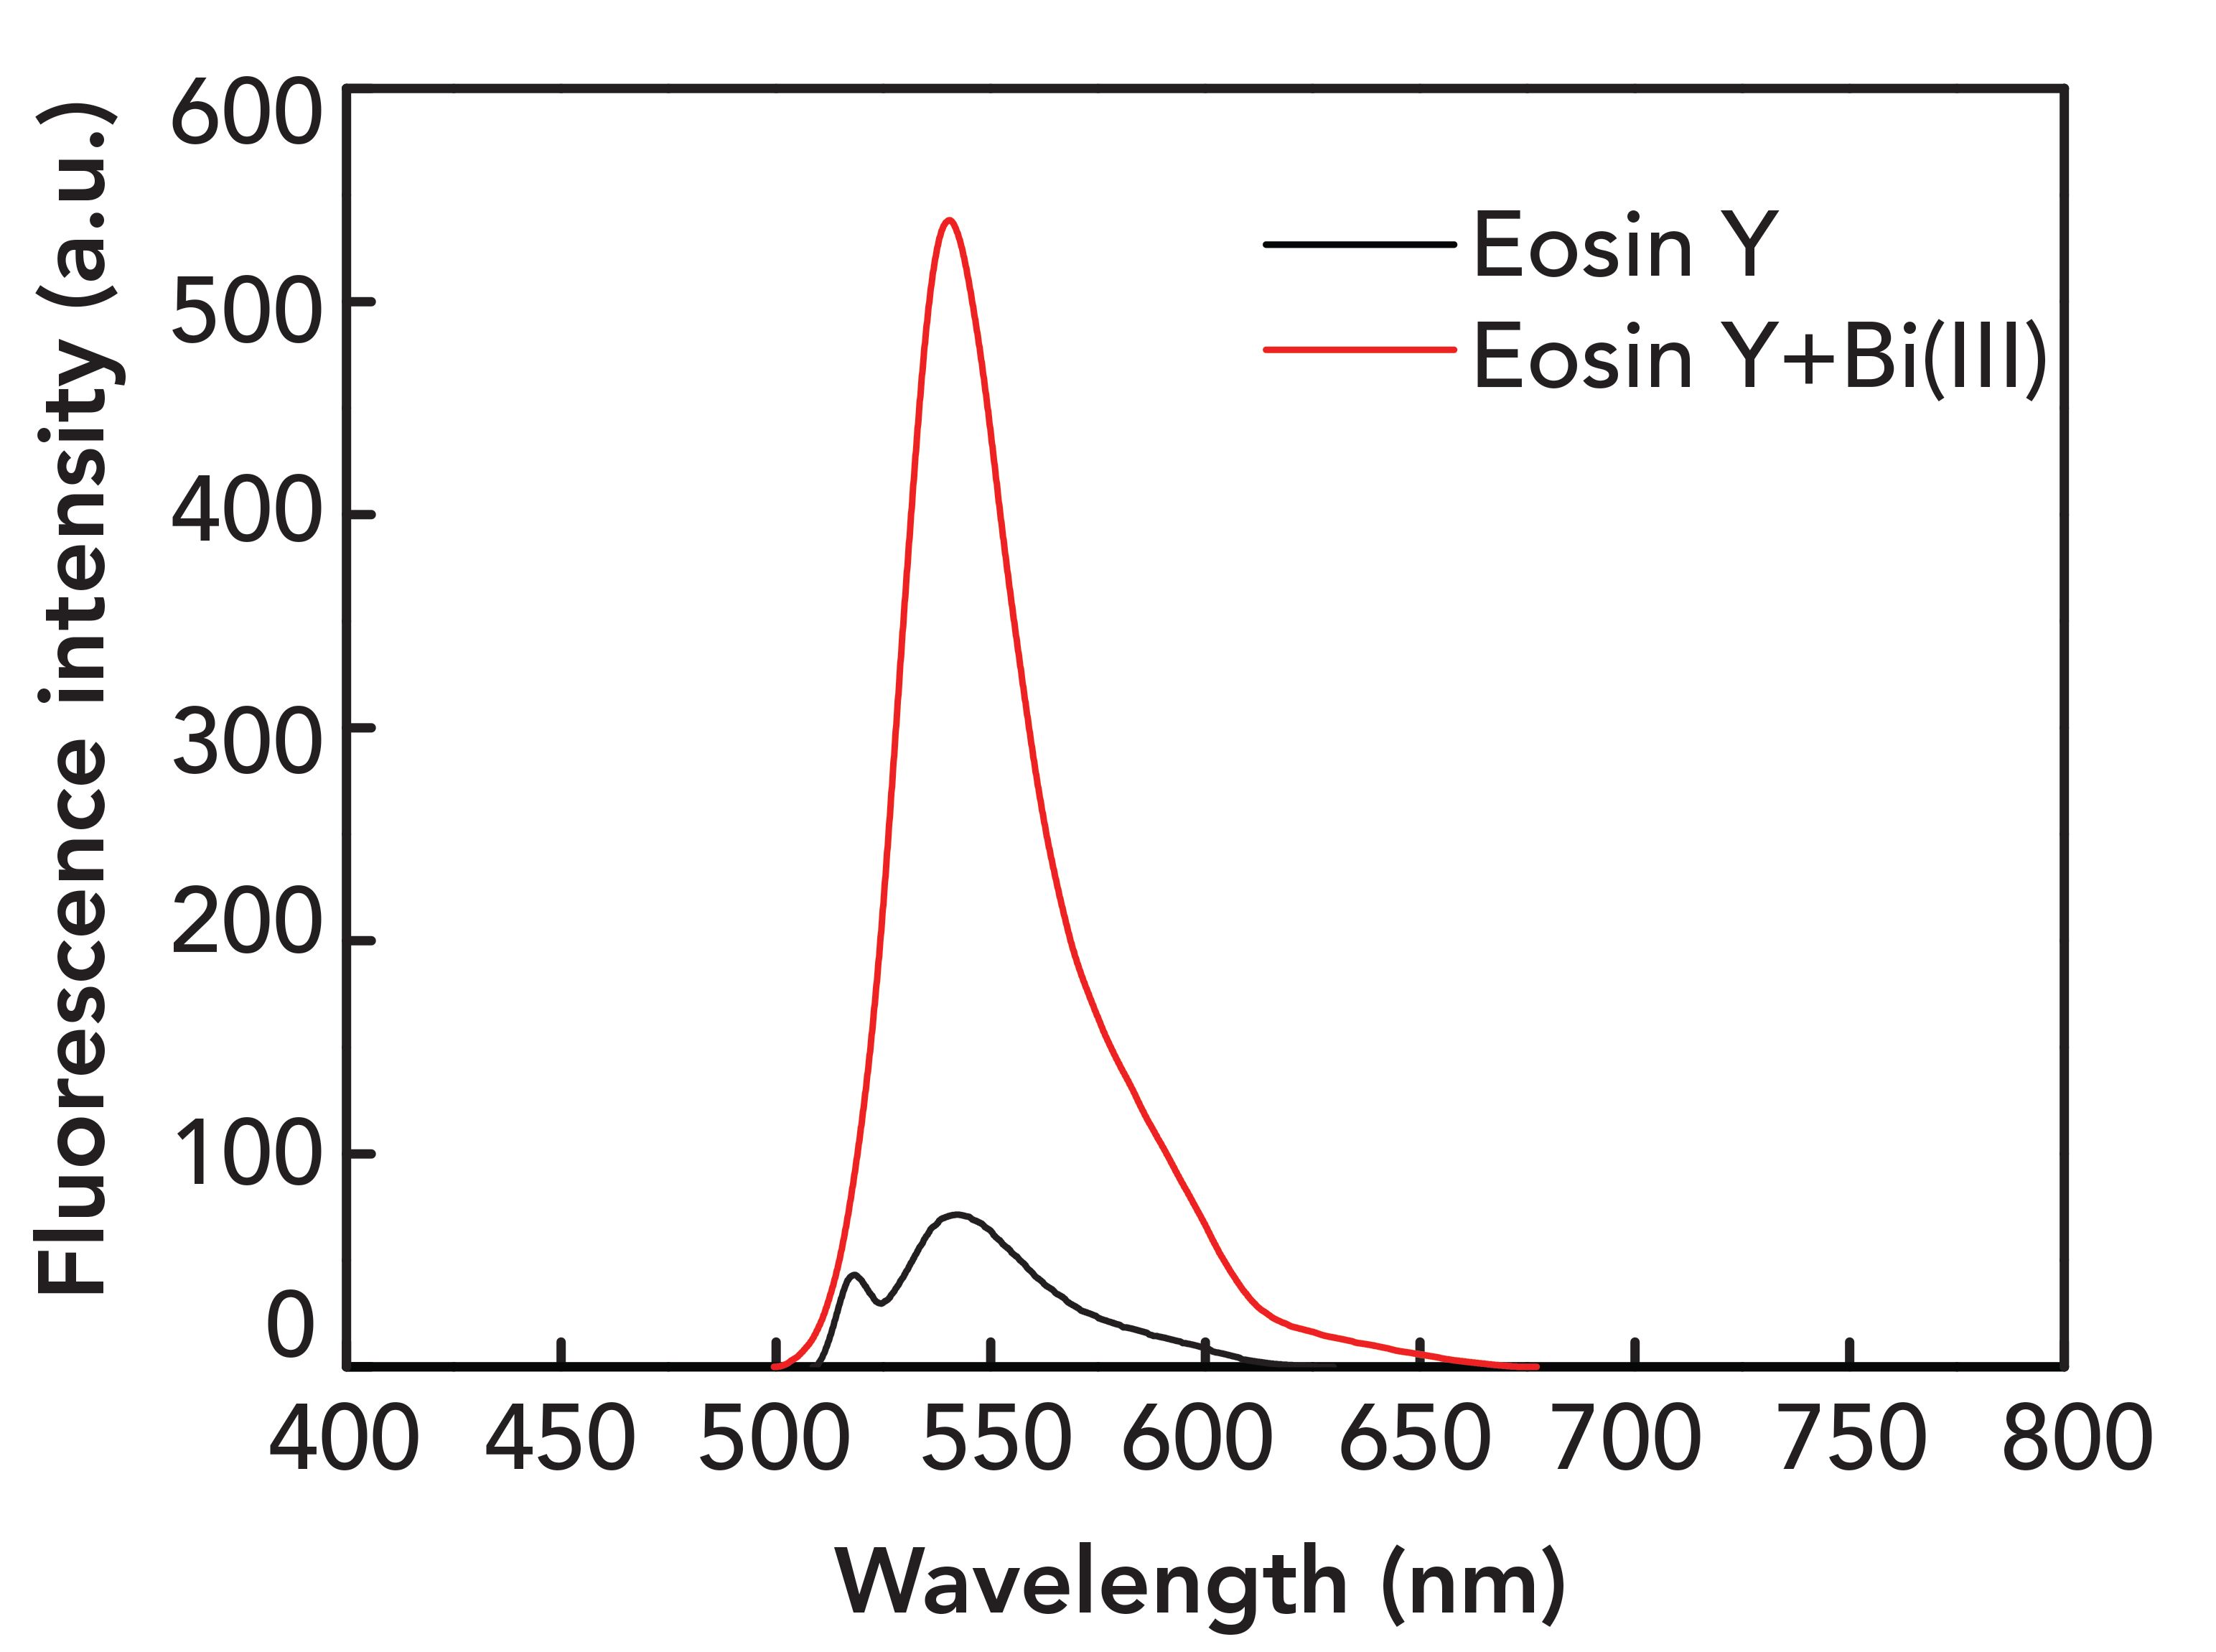
There were two prepared sets of comparative experiments, according to the experimental conditions. In one of them, 0.50 mL of bismuth was added, and in the other, no bismuth was added. The fluorescence intensity spectrum was measured after the reaction concluded. As shown in Figure 1, the fluorescence intensity was excellent when bismuth was not added, and the fluorescence intensity decreased after adding bismuth. Therefore, bismuth can reduce the fluorescence intensity of eosin Y.
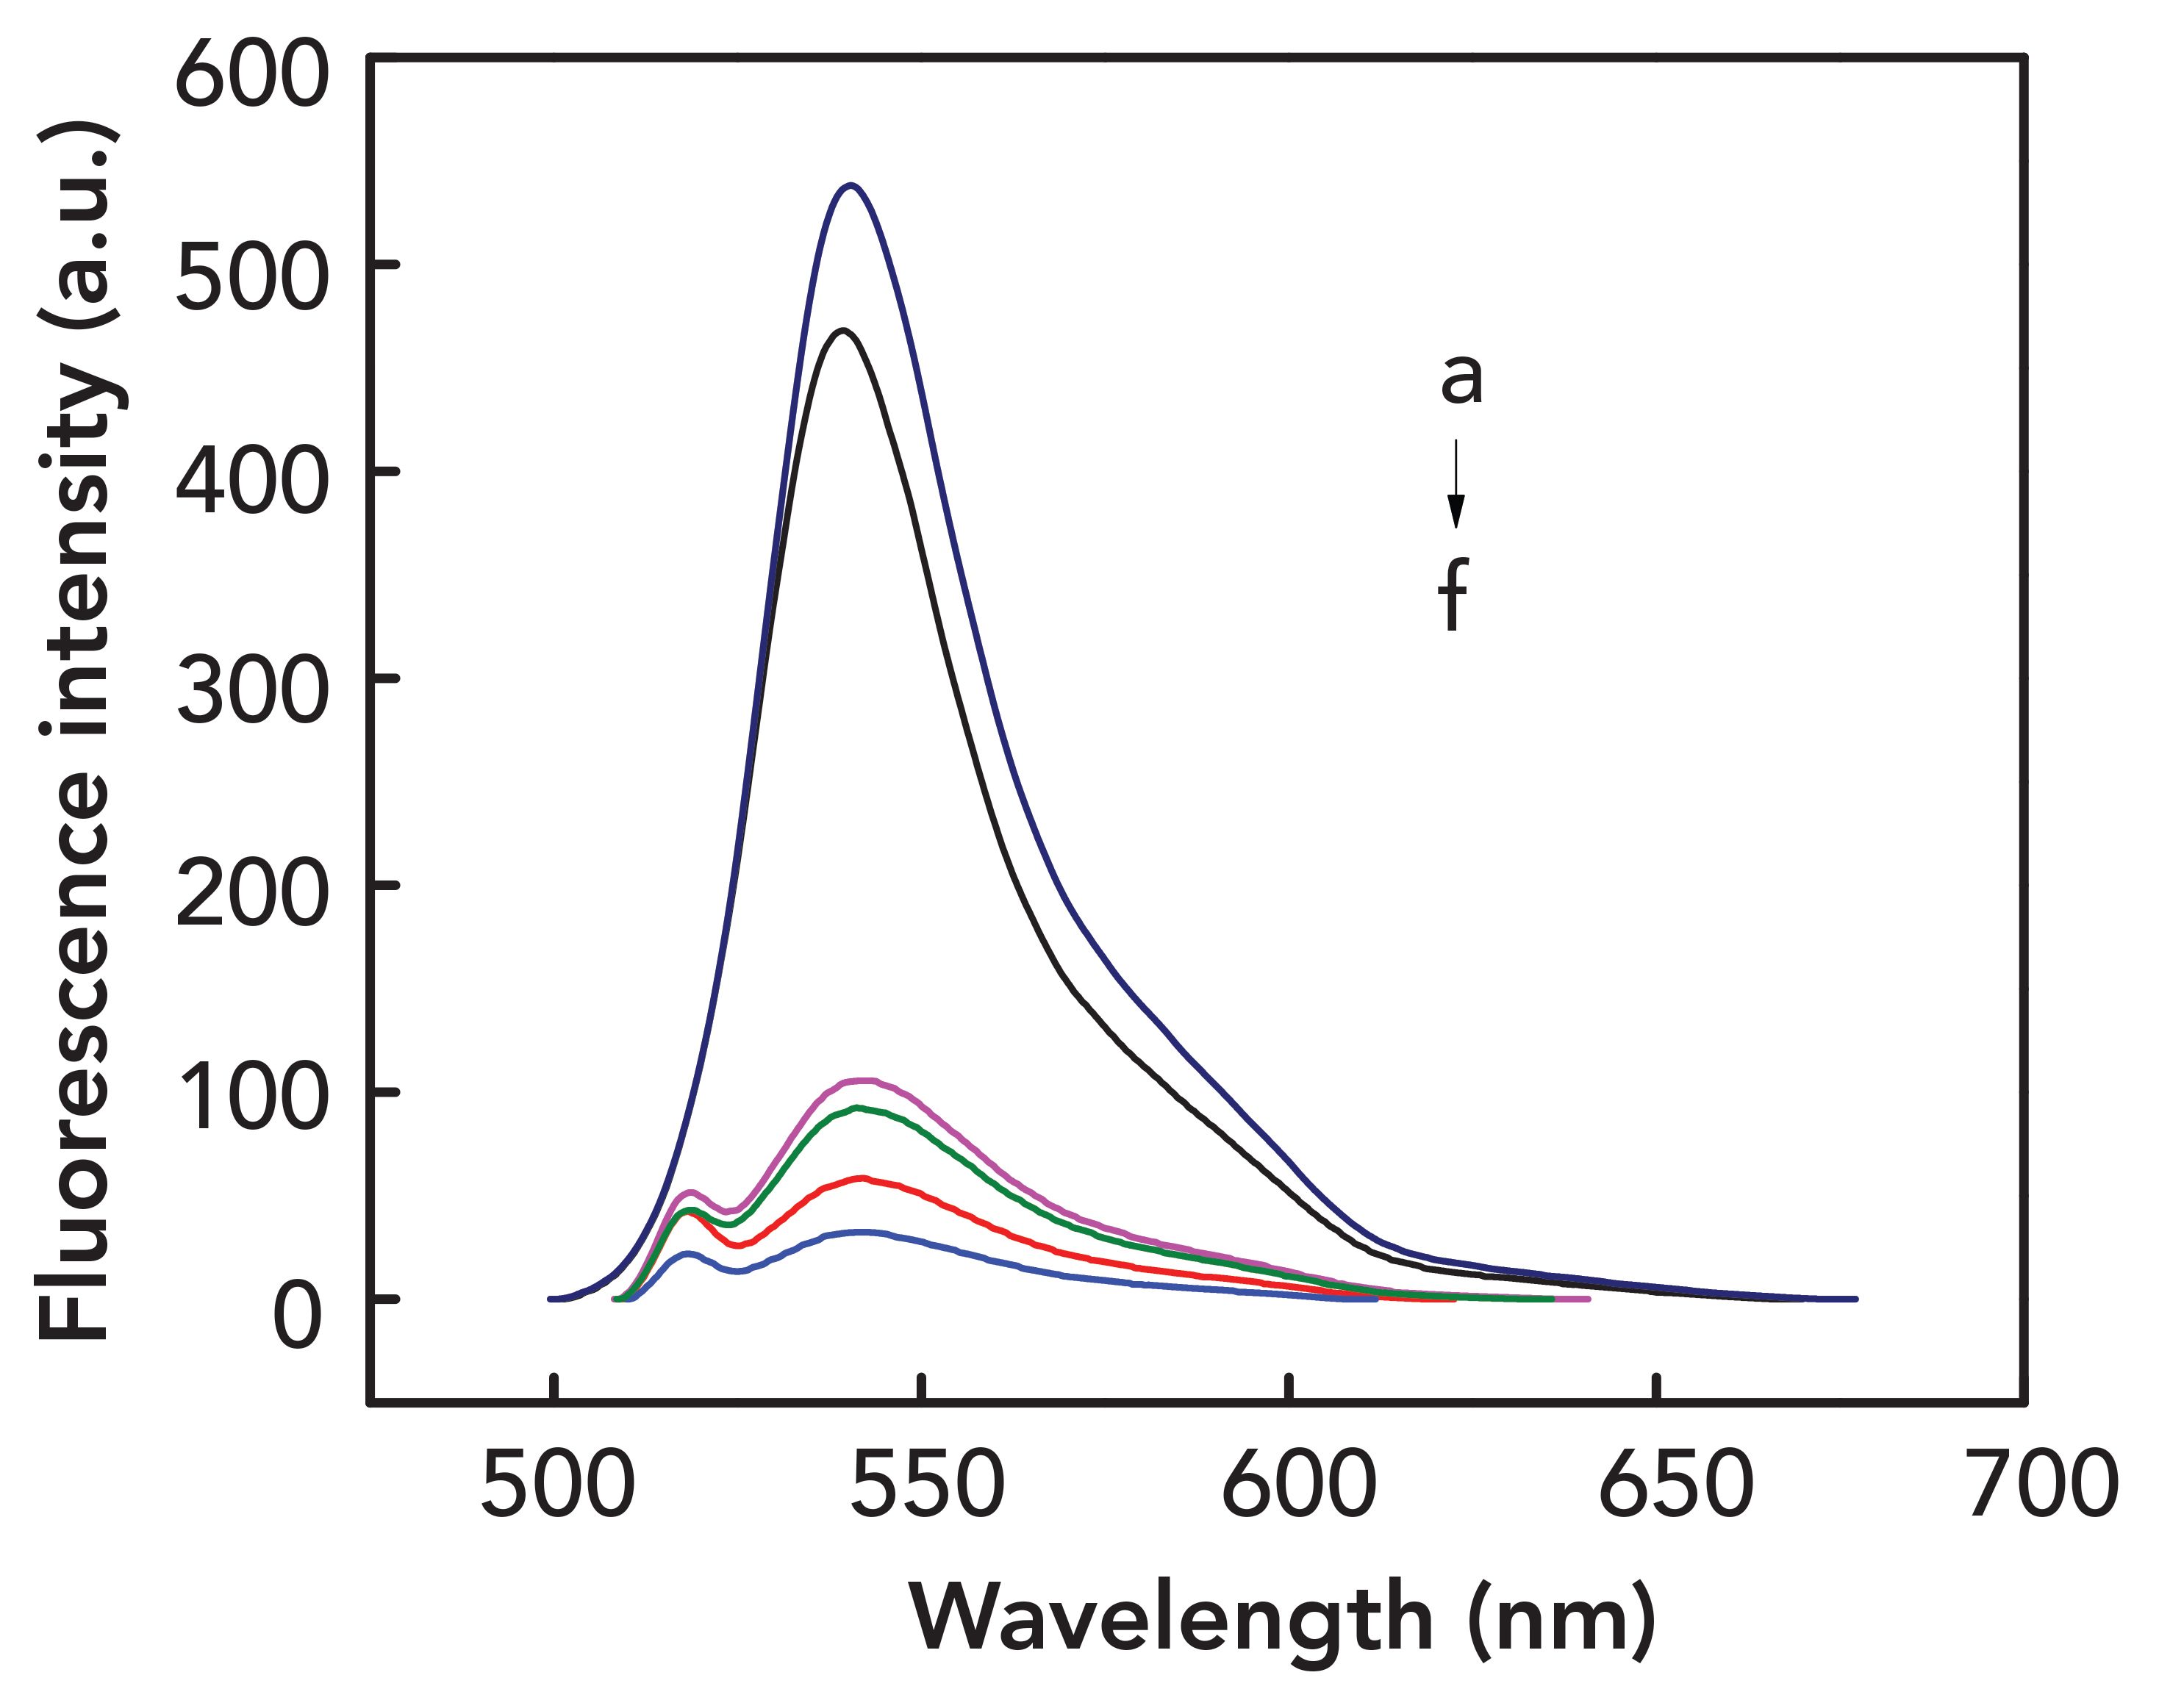
FIGURE 2: Fluorescence spectra of eosin Y system (a) 1.00 mL eosin Y + 4.00 mL hydrogen peroxide + 2.00 mL EDTA; (b) 1.00 mL eosin Y + 4.00 mL hydro- gen peroxide; (c) 1.00 mL eosin Y + 2.00 mL EDTA + 0.50 mL bismuth solu- tion; (d) 1.00 mL eosin Y + 4.00 mL hydrogen peroxide + 2.00 mL EDTA + 0.50 mL bismuth solution; (e) 1.00 mL eosin Y + 0.50 mL bismuth solution; and (f) 1.00 mL eosin Y + 4.00 mL hydrogen peroxide + 0.50 mL bismuth solution.
System Fluorescence Spectrum
According to the experimental method, different component solutions were prepared to obtain the fluorescence intensity spectrum curve, as shown in Figure 2. From Figure 2, it is verified again that bismuth has a greater catalytic effect on the fading reaction of hydrogen peroxide–oxidized eosin Y, which meets the experimental principle. The fluorescence intensity shown in Figures 2a and 2b without bismuth is strong and the difference is very small, which is quite different from the weakened fluorescence intensity shown in Figure 2c, 2d, 2e, and 2f. At the same time, comparing Figure 2c and 2d, the fluorescence intensity of 2c without hydrogen peroxide is stronger, indicating that hydrogen peroxide has reacted with eosin Y and has a strong and measurable oxidation effect.
Three-Dimensional Atlas
FIGURE 3: Three-dimensional fluorescence plane contour spectrum of blank solution.
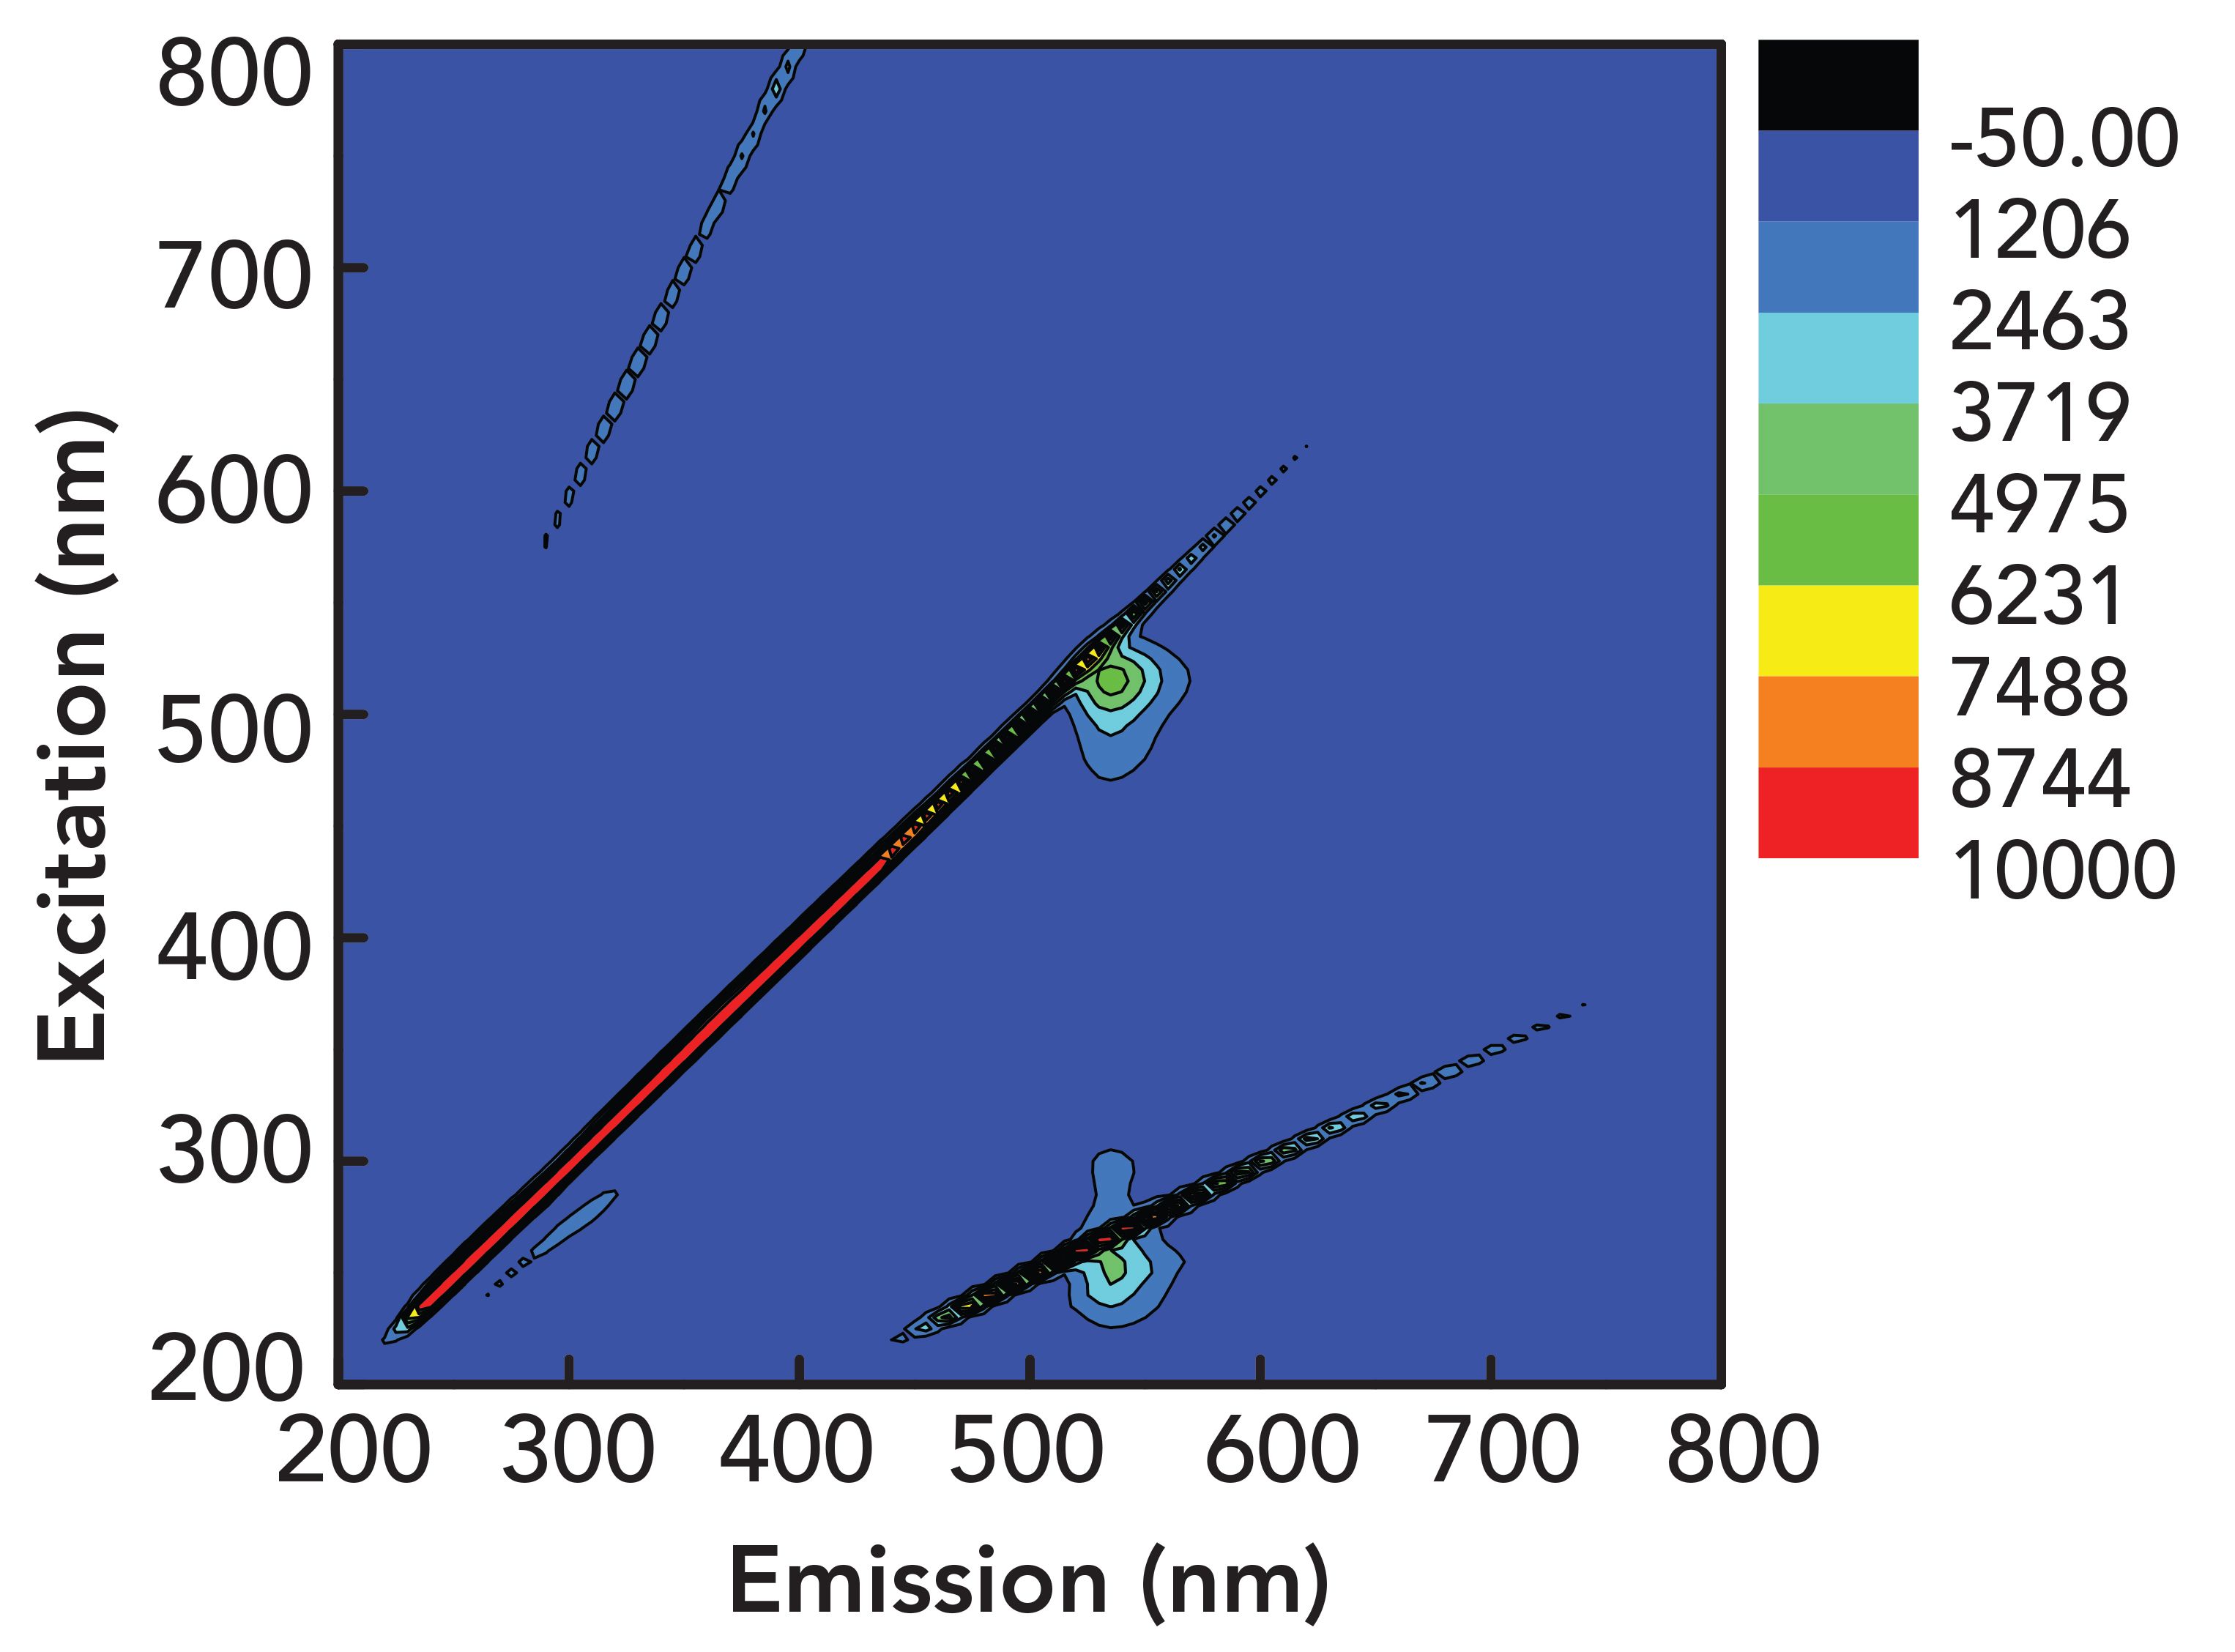
Figure 3 displays a three-dimensional fluorescence plane contour plot of a blank solution without bismuth. As shown in Figure 3, there are three spectral lines from the lower left corner to the upper right corner that are generated by Rayleigh scattering of the solution. These three lines are stronger in the shorter wavelength portion (bottom left corner), but weaken and disappear in the longer wavelength portion (upper right corner). Rayleigh scattering lines and fluorescence contour lines cross between 500 and 580 nm. As can be seen from the fluorescence 3-D graph of Figure 3, the fluorescence intensity is the largest at λex = 515 nm and λem = 542 nm.
Optimum Conditions for the Reaction
Effect of pH
Acidity has an important effect on the progress of the catalytic reaction. Under acidic conditions, bismuth can catalyze the oxidation of eosin Y by H2O2. The experiment was chosen to investigate the effect of H2O2 on the fluorescence intensity of Eosin Y when the pH was be- tween 2 and 6. The experimental results showed that when the pH value was between 4 and 5, the relative fluorescence intensity ΔI (ΔI = I0F- IF) was large and remained constant. The relative fluorescence intensity of the system was the largest at pH = 4.50, so that pH level was used in the experiment.
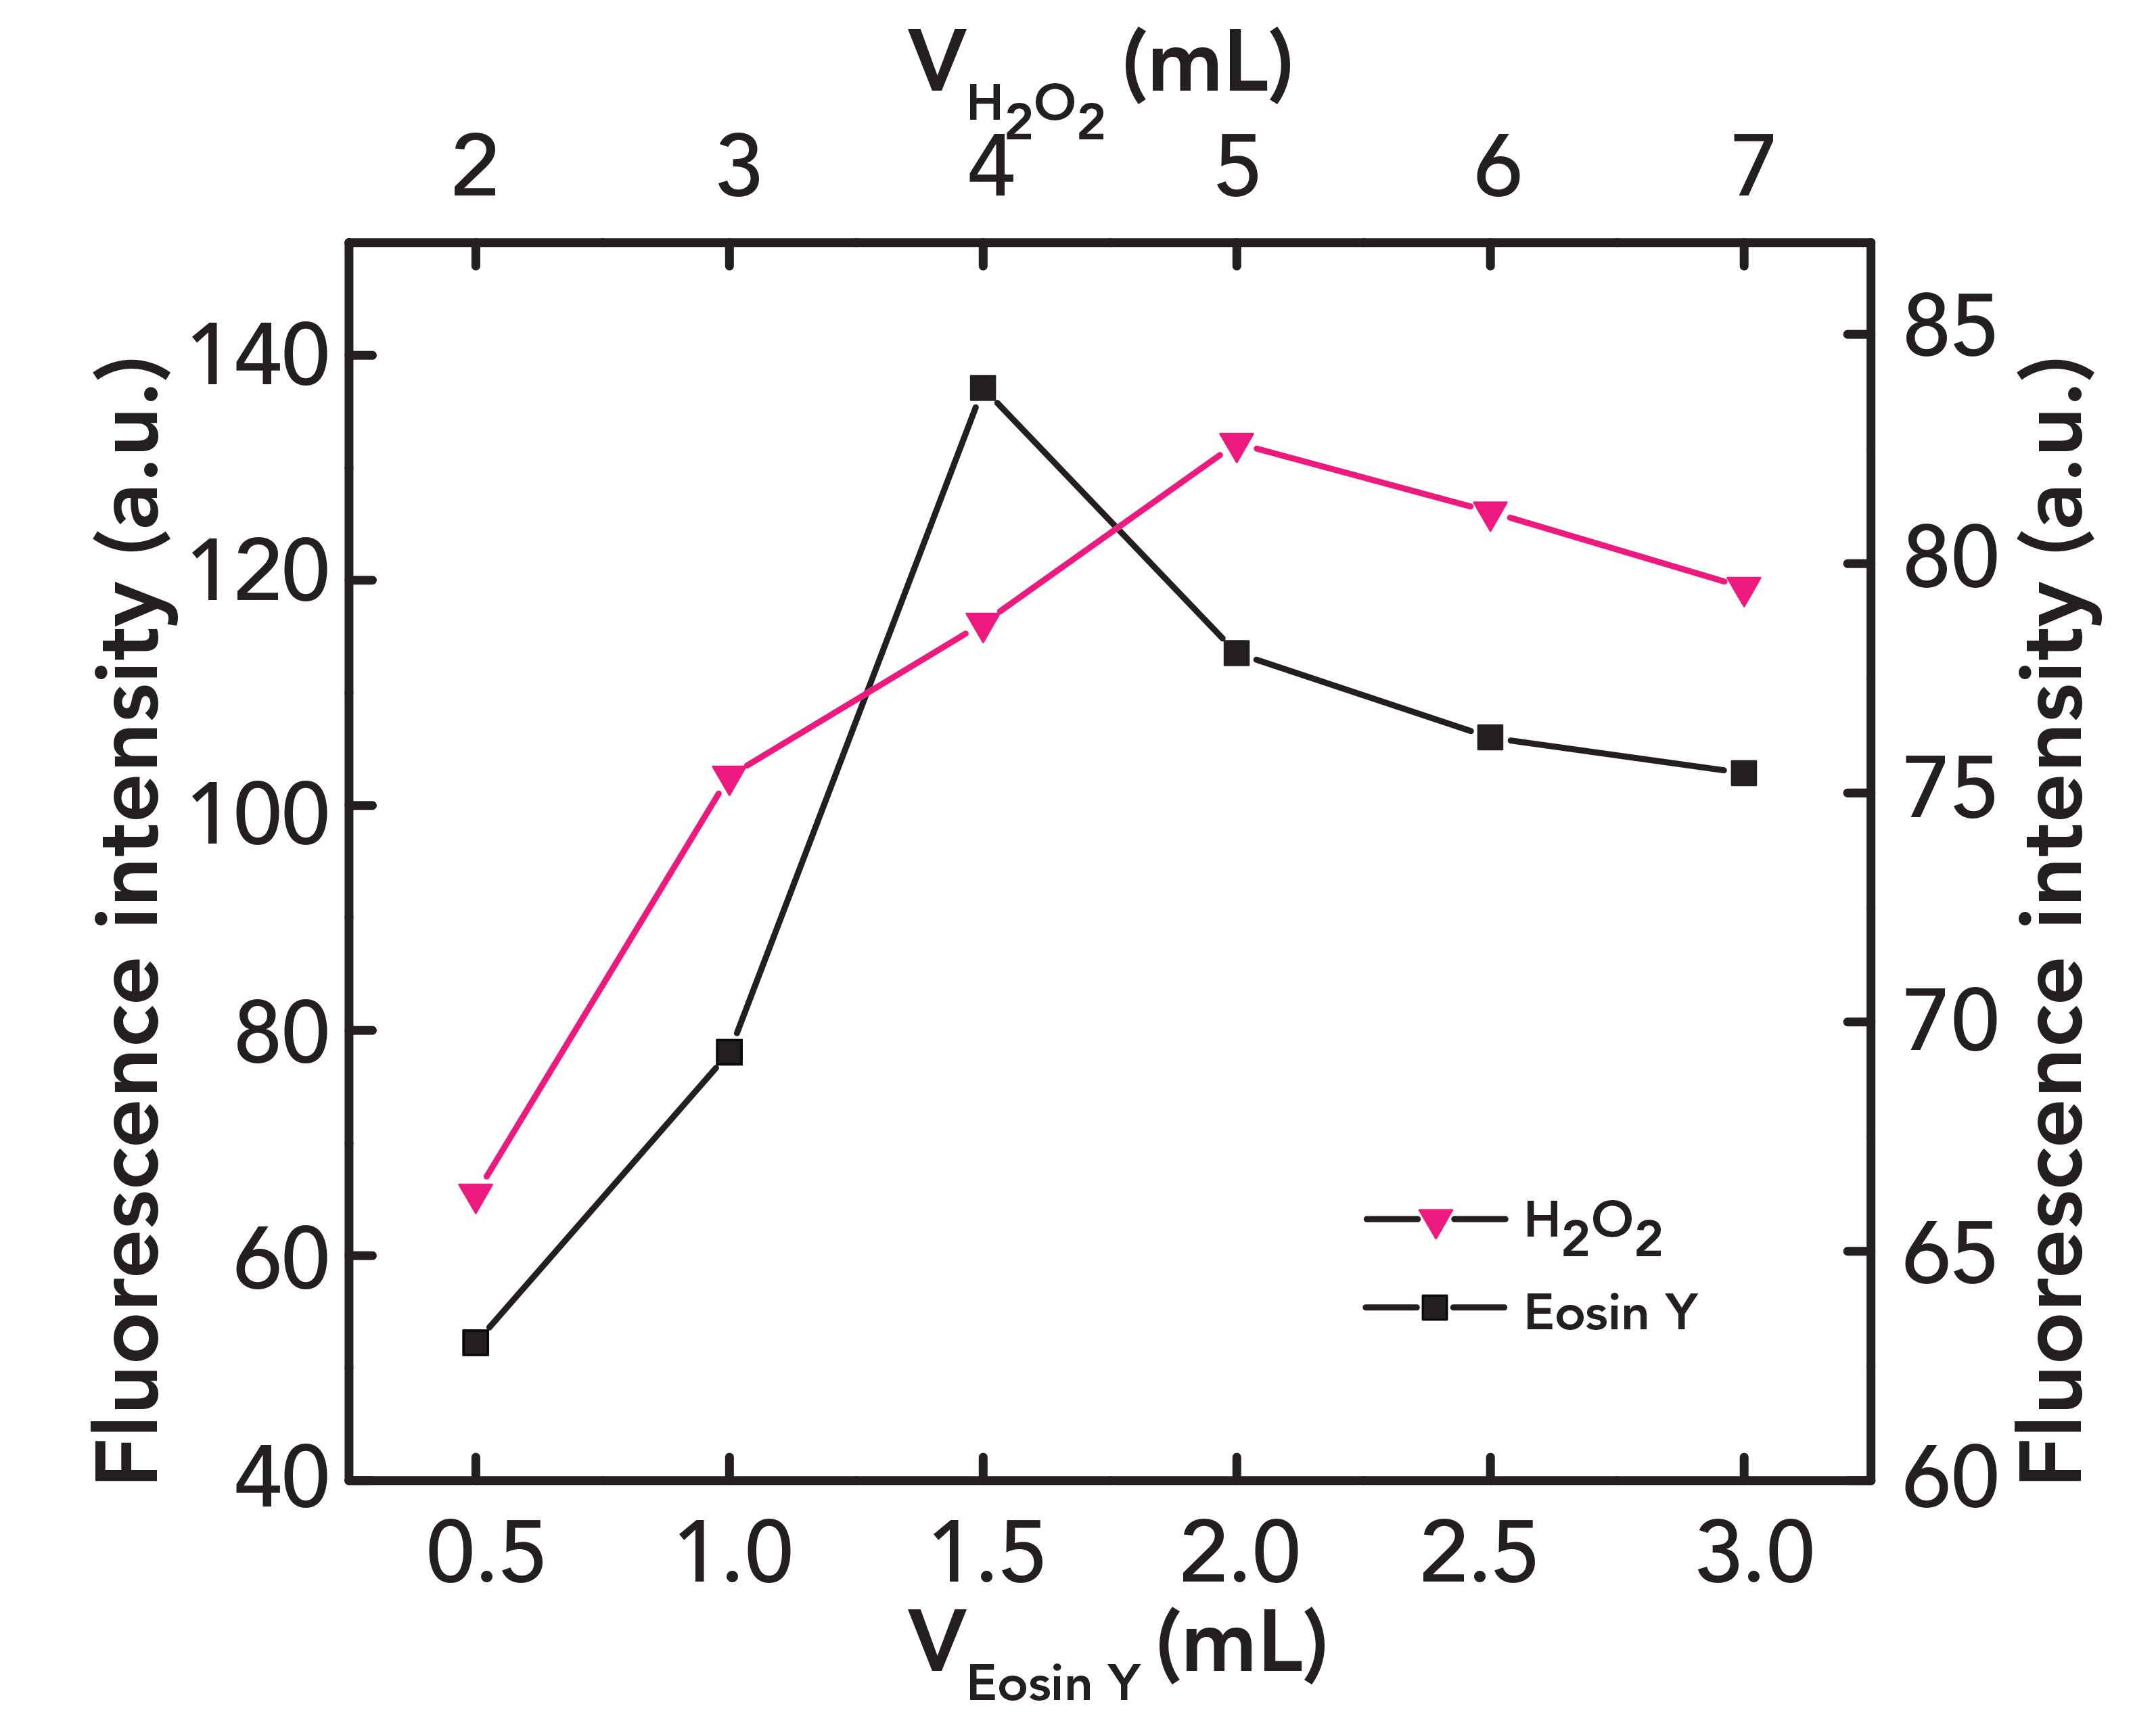
FIGURE 4: Effect of the amount of eosin Y and H2O2 on the fluorescence intensity of the system.
Selection of the Right
Amount of Eosin Y and H2O2
Too much or too little eosin Y will affect the results of the experiment. On the premise of ensuring that eosin Y has no self-extinguishing fluorescence, 0.50 to 3.00 mL of eosin Y was added, according to the experimental method. The results are shown in Figure 4. When 1.50 mL of eosin Y was added, the fluorescence intensity was the strongest, and it was stable. The fluorescence intensity was the worst when 0.50 mL of eosin Y was added. The fluorescence intensity was similar when 2.00 mL and 2.50 mL of eosin Y was added. Because the concentration of the developer is too high, self-absorption will occur, and the fluorescence intensity will decrease. The optimal amount of eosin Y was determined to be 1.50 mL. Under the selected test conditions, the experiment was carried out by changing the amount of H2O2 to investigate its effect on the catalytic reaction. As shown in Figure 4, increasing amounts of oxidant H O can speed up the catalytic reaction. When the amount of H2O2 is 5.00 mL, the fluorescence intensity is the strongest and stable. When the amount of H2O2 is too large, the excess oxidant greatly reduces the absorbance of noncatalytic reactions. Thus, the optimal amount of H2O2 was determined to be 5.00 mL.
Effect of Reaction Temperature and Time
Under the selected experimental conditions, the effect of the reaction temperature and time on the experimental reaction was investigated. The results showed that when the temperature was above 25 oC, the catalytic reaction sped up and the absorbance increased with increasing temperature. When the temperature was 90 oC, the relative fluorescence intensity of the system was the largest and stable. When the temperature was higher than 90 oC, the absorbance decreased because the temperature was too high. Thus, the optimal reaction temperature was determined to be 90 oC. Subsequently, the fluorescence emission intensity of the system at different reaction times (0–25 min) was measured at 90 oC. The results showed that the fluorescence intensity increased rapidly when the heating time was within 0–15 min, the fluorescence intensity decreased when the heating time was between 15–25 min, and the relative fluorescence emission intensity reached the maximum when the heating time was 15 min. Therefore, the optimal response time was determined to be 15 min. When the reaction was terminated with EDTA, the amount of 1.00% EDTA was 2.00 mL.
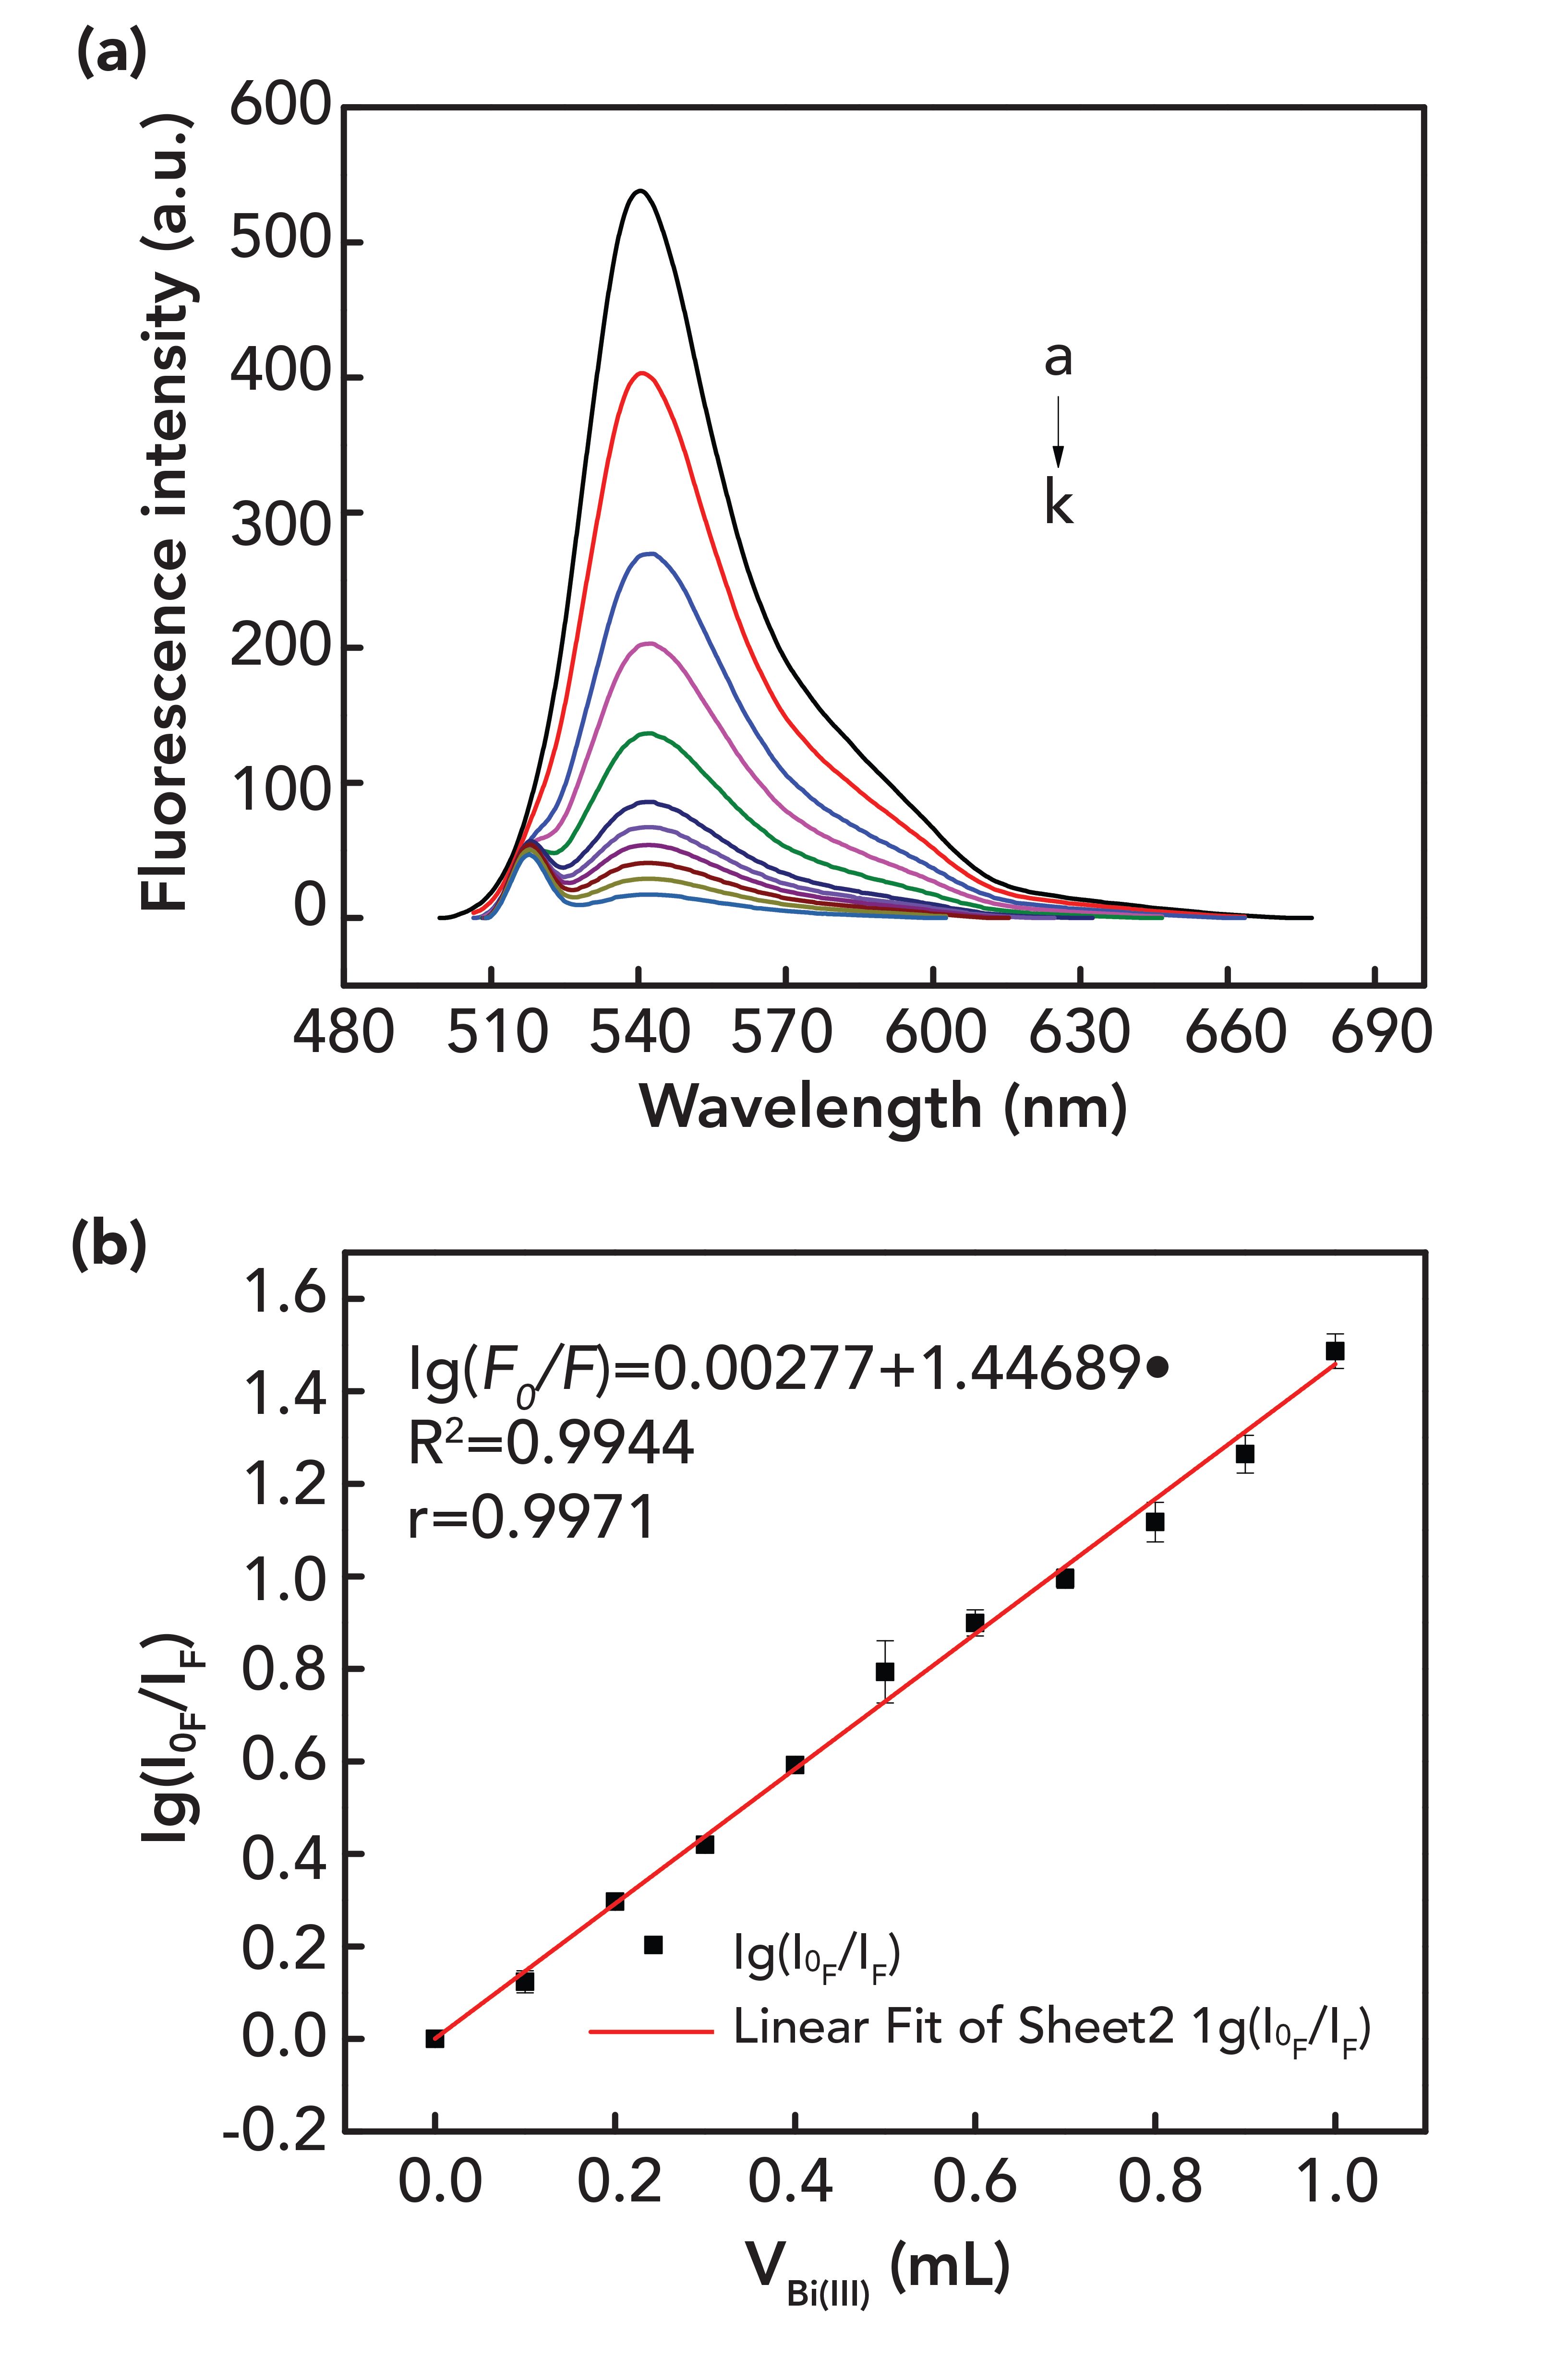
FIGURE 5: (a) Fluorescence spectrum of different amounts of bismuth solu- tion and (b) Standard working curve of the system: a–k: Eosin Y, 1.50 mL; H2O2, 5.00 mL; EDTA, 2.00 mL; bismuth, 0.10–1.00 mL (the actual concentration was 4.0 × 10⁻⁴ to 4.0 × 10⁻³ μg/L).
Work Curve and Detection Limit
According to the above experimental method, the calibration curve was established by conducting a series of similar experiments at various concentrations of bismuth within a certain concentration range. The results of these are shown in Figures 5a and 5b. The results show that the fluorescence intensity of the solution decreased with increasing concentrations of bismuth and when the volume of bismuth solution was 0.10–1.00 mL, that is, the actual concentration was 4.0 × 10⁻⁴ to 4.0 × 10⁻³ μg/L, there was a good linear relationship between the lg(I0F/IF) and the concentrations of bismuth. The linear regression equation has the form lg (I0F/IF) = 0.00277 + 1.44689ρBi3+(μg/L), and the correlation coefficient was 0.9971. The bismuth solutions of 0.20 mL and 1.00 mL were measured 21 times, and the relative standard deviations (RSD) were 3.20% and 1.97%, respectively. The sensitivity of this experimental method is based on the minimum amount of the test substance that can be detected, the detection limit was 1.9 × 10⁻⁵ μg/L.
FIGURE 6: The ultraviolet absorption intensity of the eosin Y system with different amounts of bismuth.
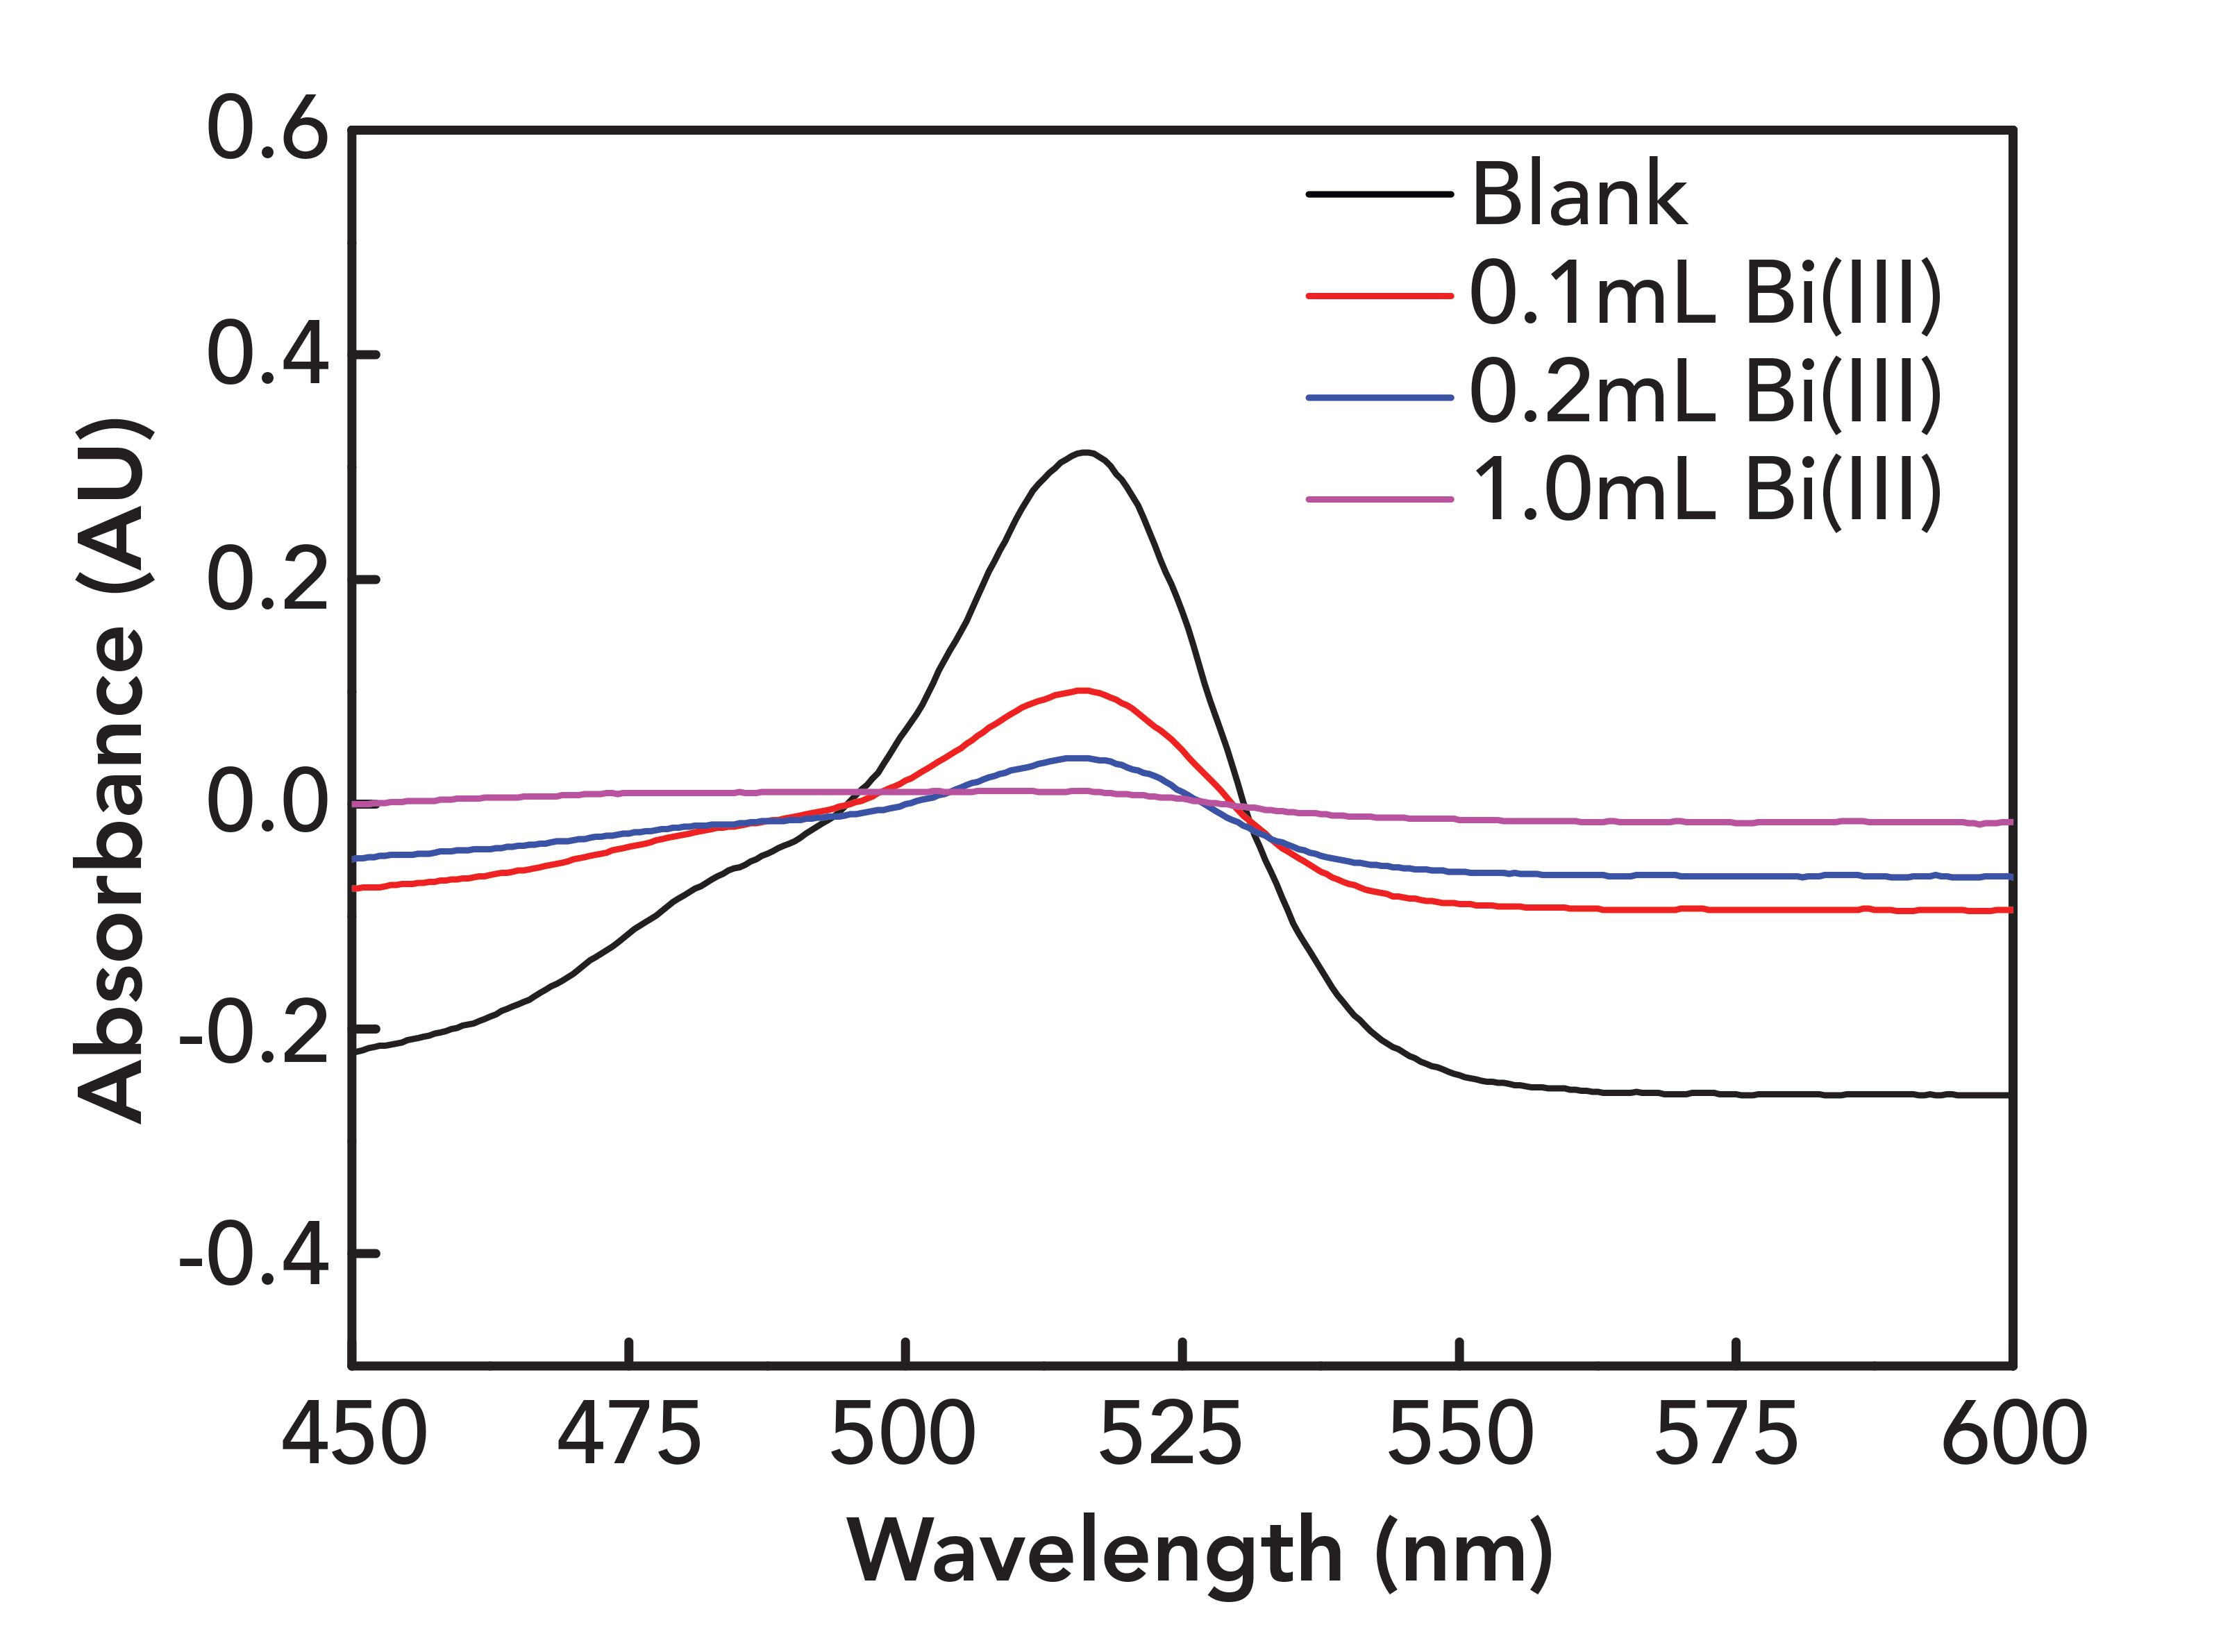
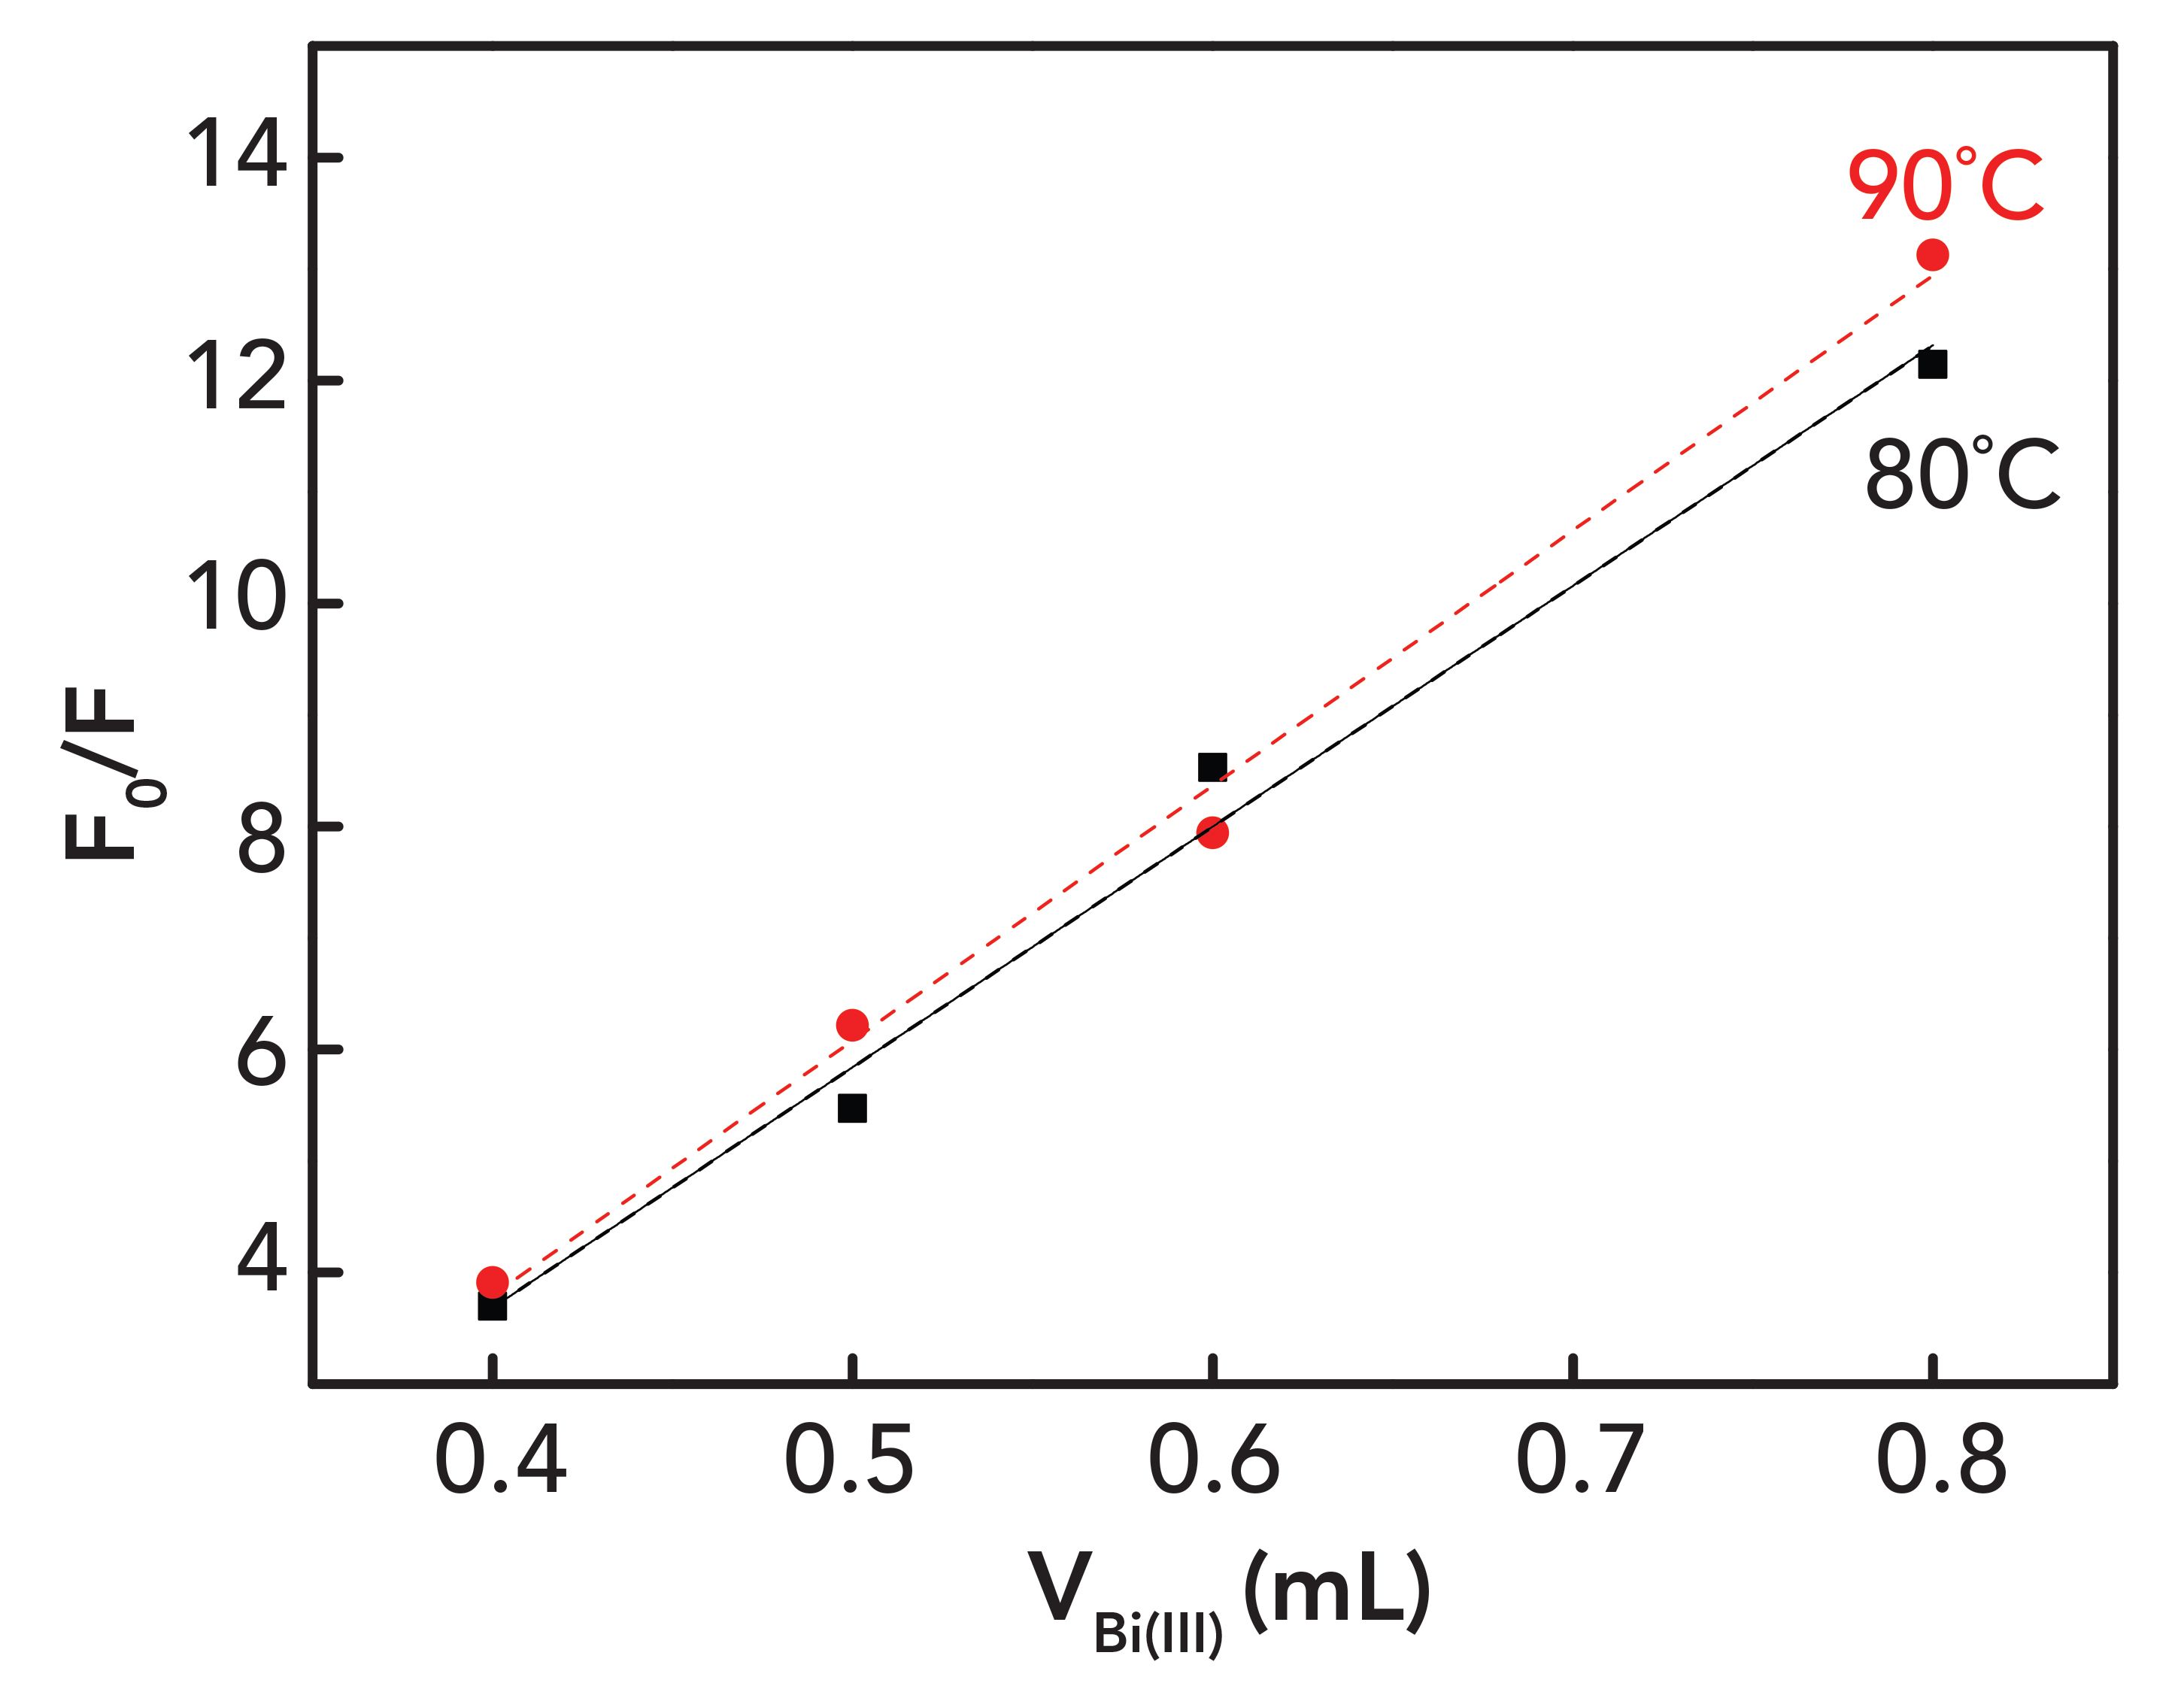
FIGURE 7: Linear relationship at different temperatures.
Selectivity of the Method
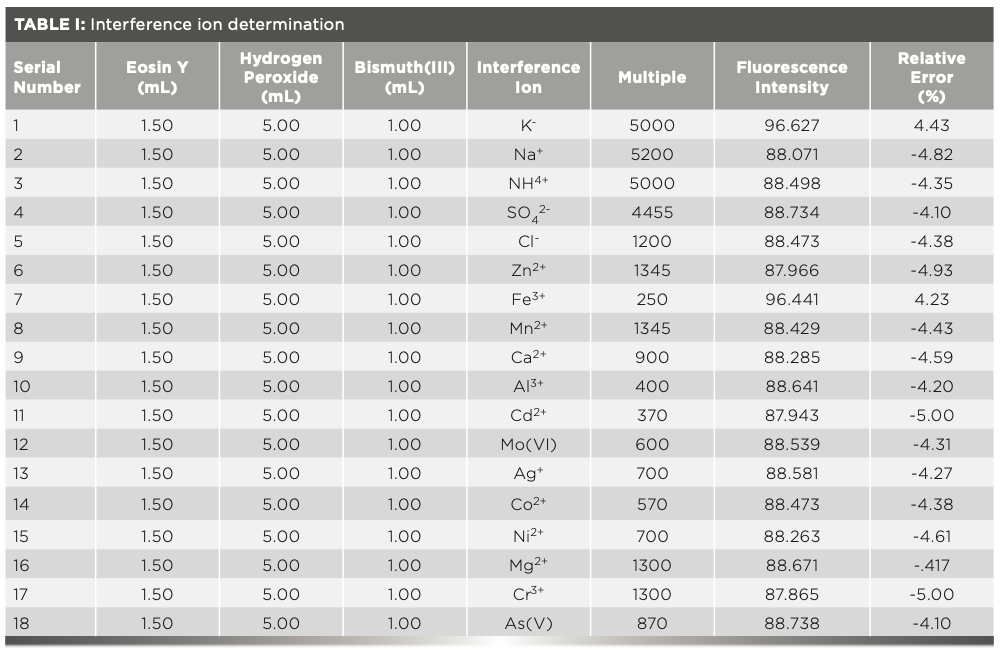
According to the procedure, if the coexisting ions cause a relative error of less than or equal to ±5% in the fluorescence intensity change of system, the common ions were considered to have few interferences for the determination of bismuth. The measurement results are shown in Table I.
Sample Analysis
Detection of Bismuth in Water Samples
A 100 mL sample of local sewage was poured into a volumetric flask for subsequent use and filtered with quick filter paper to remove insoluble impurities. Then, 50 mL of the filtrate was drawn into a beaker, then 1 mL of concentrated hydro- chloric acid, 2 mL of concentrated nitric acid, and the solution were added and heated on an electric furnace until the sewage evaporated to near dryness. When the sample reached room temperature, 1 mL of concentrated hydrochloric acid and a small amount of water was poured into the beaker. The beaker was then heated to boiling for several minutes and cooled to room temperature. The pH level was adjusted to 4.50, before the solution was transferred to a 100-mL volumetric flask. The mixture was diluted to the mark with water and mixed thoroughly. The measurement was performed according to the selected experimental method, and the spiked recovery experiment was performed at the same time. Table II shows these results.

Detection of Bismuth in Human Hair
Female human hair samples were digested by the wet nitrification method, in which a 3.006 g hair sample was washed with acetone and ultrapure water and dried, then added to a beaker, nitrated with 60 mL of a concentrated HNO3 and HClO4 solution [(5:1) v:v] at room temperature for 3 h, and heated on a hot plate until the brown smoke was gone. After it was cooled to room temperature, following the same procedure as above, 1.50 mL of eosin Y, 5.00 mL of hydrogen peroxide, 2.00 mL of EDTA solution, and 0.50 mL of bismuth solution were poured into the beaker before adding 0.00 mL, 0.50 mL, 1.00 mL, and 1.50 mL of human hair for reaction, respectively. The reaction was terminated, the residue was re-nitrated with 30 mL of a mixture of HNO3 and H2O2 [(2:1) v:v]. The final residue was dissolved in distilled water and transferred to a 50–mL volumetric flask to obtain a transparent solution for experiments. The measurement was performed according to the experimental method, and the results were shown in Table II.
FIGURE 8: A colored unsaturated lactone (R), containing two phenol light group! s, converting into a colorless dehydrogenated R—under its own acidity of pH = 4.50 and after heating at 100 degrees farenheit.
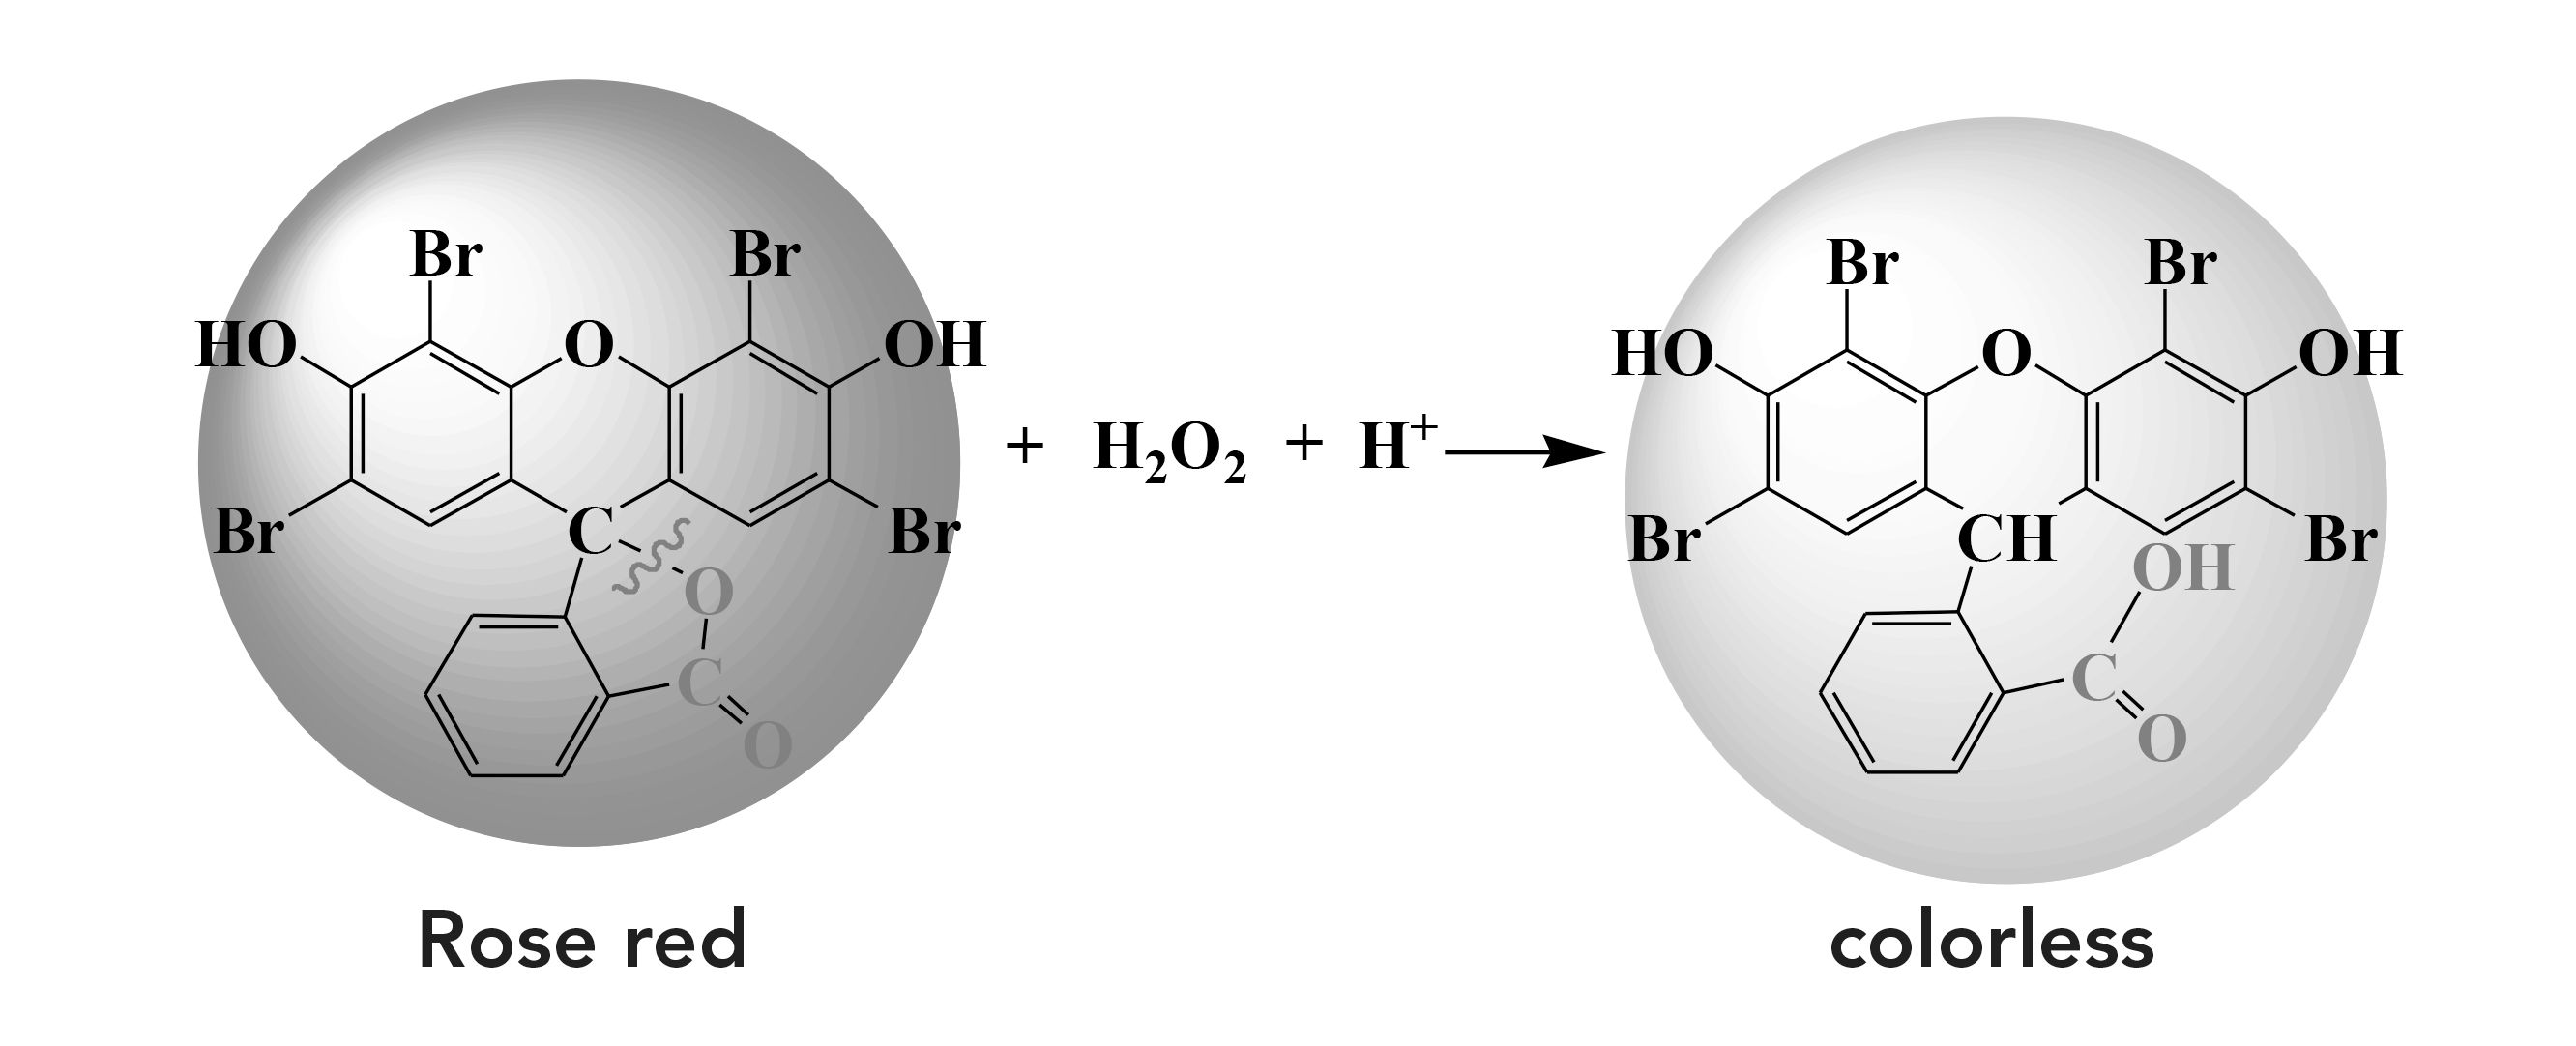
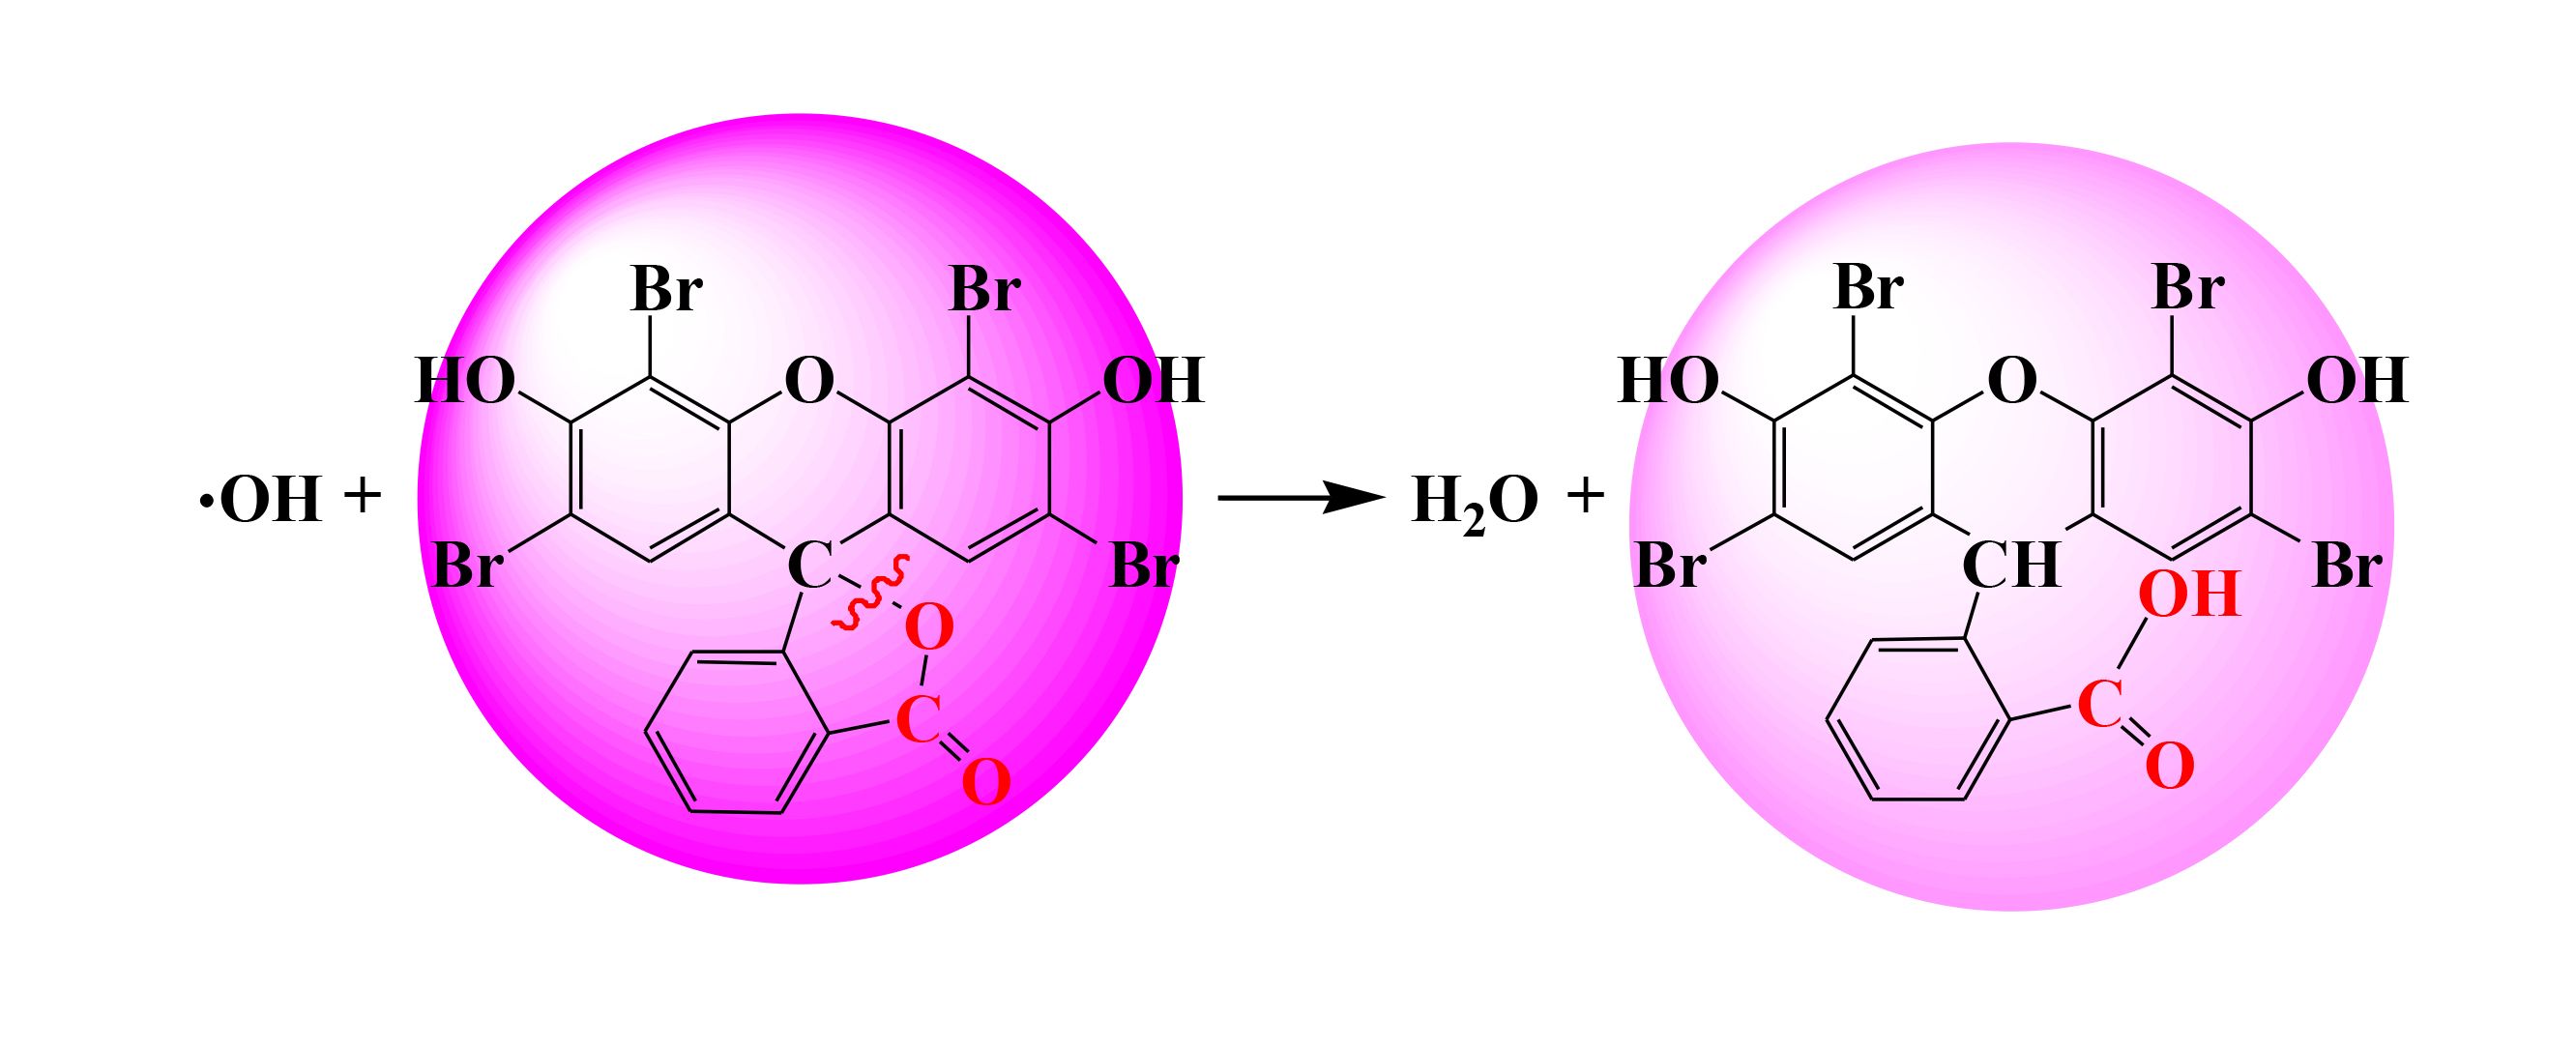
FIGURE 9: The ·OH free radicals are small, uncharged, and have a high oxida- tion potential, and is shown further oxidizing R while accelerating the fading color reaction of R.
Quenching Type
Fluorescence quenching usually includes static quenching and dynamic quenching. It can be distinguished by measuring the relationship between the quenching constant and temperature. Static quenching is due to the combination of the quencher and the fluorophore to generate non-fluorescent substances. Therefore, when the temperature increases, the degree of turbulence in the system increases, resulting in a decrease in the quenching constant. While dynamic quenching is due to quenching, the collision between the extinguishing agent and the fluorophore causes the fluorescence intensity to decrease. Therefore, when the temperature increases and the turbulence of the system increases, the collision is intensified, and the quenching constant increases.
Dynamic quenching is related to diffusion. When the temperature increases, the viscosity of the solution decreases and the molecular movement accelerates. As a result, the diffusion coefficient of the molecule will increase, which will increase the bimolecular quenching constant. Conversely, an increase in temperature may cause the stability of the complex to decrease, thereby reducing the extent of static quenching. According to the Stern-Volmer equation, if the slope at high temperature is greater than the slope at low temperature where dynamic quenching is occurring; otherwise, it is static quenching (24).
According to the experimental scheme, the ultraviolet absorption intensity of the eosin Y system with different amounts of bismuth standard solution was measured, and the quenching type was analyzed at different temperatures. The results are shown in Figures 6 and 7. As the temperature increases, the quenching type observed in this experiment is presumed to be dynamic quenching.
Mechanism Discussion
R is a kind of unsaturated lactone containing two phenol light groups to produce acidity. Even a weak oxidant can convert it into dehydrogenated R. Under its own acidity pH = 4.50 and heating in a boiling water bath, the reaction as to what this looks like can be seen in Figure 8.
When Bi3+ is present, it is mainly Bi3+ that interacts with H2O2 to produce a ·OH radical based on a bimolecular reaction:
H2O2 + Bi3+ → Bi (OH) + ·OH
Because ·OH free radicals are small, uncharged, and have a high oxidation potential, they can further oxidize R and accelerate the fading reaction of R, as seen in Figure 9.
As mentioned above, Bi3+ reacts with H2O2 to generate a ·OH radical, which catalyzes the fading reaction of H2O2 by oxidizing R (25).
Conclusions
A novel method for the detection of trace bismuth by catalytic kinetic fluorescence was established. Experiments showed that bismuth could catalyze the discoloration of eosin Y in the presence of peroxy hydroxide, weaken the fluorescence intensity, and even lose fluorescence. lg(I0F/IF) and the concentration of bismuth show a good linear relationship, which can be used as a basis for the detection of trace bismuth. The concentration of bismuth in the range of 4.0 × 10⁻⁴ to 4.0 × 10⁻³ μg/L has a good linear relationship with lg(I0F/IF), the correlation coefficient is 0.9971, and the detection limit of the method is 1.9 × 10⁻⁵ μg/L. The method used for the detection of bismuth in human hair samples and water samples, with simple operation and high accuracy, and the results were consistent with the certified values.
Acknowledgment
The authors acknowledge the financial support from the National Natural Science Foundation of China (No. 61805010).
References
(1) X. M. Yu, H. Feng, and H. R. Yang, Chin. Pharm. Affairs 26, 394–403 (2012).
(2) M. Meng, H.W. Ji, and G.M. Li, Copper Eng. 2, 15–17 (2015).
(3) H. T. Sun, J. J. Zhou, and J. R. Qiu, Prog. Mater. Sci. 64, 1–72 (2014).
(4) M. Zeng, Y.X. Ou, and M.K. Chen, Chin. J. Anal. Lab. 27, 95–97 (2008).
(5) F. X. Luo, and R. P. Li, J. Shaoguan Univ. 30, 74–77 (2009).
(6) L. P. Xiao, Metall. Anal. 37, 65–70 (2017).
(7) A. Afkhami, T. Madrakian, and H. Siampour, J. Brazil. Chem. Soc. 17, 797–802 (2006).
(8) G. Gumus, H. Filik, and B. Demirata, Anal. Chim. Acta. 547, 138–143 (2005).
(9) S. H. Xu, F. J. Jiao, and G. J. Dang, Foundry Technol. 33, 94–96 (2012).
(10) X. J. Wang, Z. H. Li, and Y. Gao, Metall. Anal. 31, 58–61 (2011).
(11) N. Velitchkova, E. N. Pentcheva, and N. Daskalova, Spectrochim. Acta. Part B. 59, 871–882 (2004).
(12) A. Koper, and M. Grabarczyk, J. Electroanal. Chem. 681, 1–5 (2012).
(13) F. W. Wan, M. Zhang, and S. W. Wang, Adv. Mater. Res. 8, 147–150 (2011).
(14) D. Meneses, Júnior, F. José Guimarães F, and P. C. C. De Oliveira, Environ. Monit. Assess. 190, 617 (2018).
(15) A. Masek, E. Chrzescijanska, and M. Latos-Brozio, Food Chem. 301, 125– 279 (2019).
(16) B. Moavenian, M. H. Hosseini, and M. Arabieh, J. Water Chem. Technol. 40, 291–296 (2018).
(17) Sayed M. S. Derayea, Anal. Methods. 6, 2270–2275 (2014).
(18) T. N. Al-Sabha, M. Y. Dhamra, and T. S. Al-Ghabsha, Eur. Chem. Bull. 6, 336–342 (2017).
(19) O. Jelena, H. Safija, and B. Zerina, Molecules 22, 1120–1127 (2017).
(20) E. Bagda, Environ. Technol. 35, 1165–1174 (2014).
(21) N. V. D. Santos, C. F. Saponi, and T. L. Greaves, RSC Adv. 9, 22853– 22858 (2019).
(22) R. R. Wang, X. G. Lin, and S. Zhou, J. Optoelectronics Laser. 24, 1537– 1541 (2013).
(23) G. P. Sheng, and H. Q. Yu, Water Res. 40, 1233–1239 (2006).
(24) T. L. Nemzek, and W. R. Ware, J. Chem. Phys. 62, 477–489 (2008).
(25) W. Lin, J. Zhangzhou Teachers College (Natural Sci.). 4, 56–58 (2001).
Zhang Xiao, Sheng Li, Wang Zhao-qun, and Su Bi-quan are with the College of Chemical and Biological Engineering at Lanzhou Jiaotong University in Lanzhou, China. Li Hai-su is with the Key Institute of Lightwave Technology at Beijing Jiaotong University in Beijing, China. Xue Zi-yan is with the Zhangye Food and Drug Inspection Testing Center in Zhangye, China. Direct correspondence to: shengl@mail.lzjtu.cn
New Study Reveals Insights into Phenol’s Behavior in Ice
April 16th 2025A new study published in Spectrochimica Acta Part A by Dominik Heger and colleagues at Masaryk University reveals that phenol's photophysical properties change significantly when frozen, potentially enabling its breakdown by sunlight in icy environments.
Tracking Molecular Transport in Chromatographic Particles with Single-Molecule Fluorescence Imaging
May 18th 2012An interview with Justin Cooper, winner of a 2011 FACSS Innovation Award. Part of a new podcast series presented in collaboration with the Federation of Analytical Chemistry and Spectroscopy Societies (FACSS), in connection with SciX 2012 ? the Great Scientific Exchange, the North American conference (39th Annual) of FACSS.
Can Fluorescence Spectroscopy Evaluate Soil Dissolved Organic Matter Dynamics?
February 20th 2025A new study published in Chemical Engineering Journal by researchers from Northeast Agricultural University in China reveals that biochar aging, influenced by environmental factors like UV exposure and wet-dry cycles, alters dissolved organic matter composition and affects its effectiveness in remediating cadmium-contaminated soil.
New Fluorescent Raman Technique Enhances Detection of Microplastics in Seawater
November 19th 2024A novel method using fluorescence labeling and differential Raman spectroscopy claims to offer a more efficient, accurate approach to detect microplastics in seawater. Developed by researchers at the Ocean University of China, this method improves both the speed and precision of microplastic identification, addressing a key environmental issue affecting marine ecosystems.