Chemometric Raman Imaging Data Analysis
Application Notebook
The development of advanced polymeric materials requires detailed information about the phase separation process on the nanometer scale. Confocal Raman microscopy contributes to the analysis of such materials by visualizing the distribution of individual components based on the unique Raman spectra for different polymeric materials. Using a confocal setup, polymer domains can be imaged three-dimensionally with a resolution down to 200 nm. As a Raman image typically consists of tens of thousands of spectra, a powerful data analysis software is essential in order to extract the relevant information. Hidden structures in the images should ideally be visualized automatically, ensuring an objective and consistent interpretation of the imaging data.
Ute Schmidt and Harald Fischer, WITec GmbH
The development of advanced polymeric materials requires detailed information about the phase separation process on the nanometer scale. Confocal Raman microscopy contributes to the analysis of such materials by visualizing the distribution of individual components based on the unique Raman spectra for different polymeric materials. Using a confocal setup, polymer domains can be imaged three-dimensionally with a resolution down to 200 nm. As a Raman image typically consists of tens of thousands of spectra, a powerful data analysis software is essential in order to extract the relevant information. Hidden structures in the images should ideally be visualized automatically, ensuring an objective and consistent interpretation of the imaging data.

Figure 1
Results and Discussion
A thin film of a polymer blend, with a thickness of less than 100 nm, consisting of polystyrene (PS) and ethyl-hexyl-acrylate (EHA), was spin coated on a glass cover slide. The WITec alpha300 R Confocal Raman Microscope equipped with a frequency doubled NdYAG laser (λ = 532 nm) and a 100X (NA = 0.9) air objective was used to acquire Raman images. An area of 20 X 20 µm2 was scanned and 200 X 200 complete Raman spectra were acquired with an integration time of 0.03 s per spectrum, leading to a 2D array of 40,000 Raman spectra. Raman images can be extracted from the 40,000 Raman spectra by evaluating specific spectral features. WITec Project Plus is a unique software tool for advanced microscopic data processing. It features a Cluster Analysis algorithm which automatically identifies similar spectra and classifies them into a user defined number of clusters. Each cluster is represented by an average spectrum and a map showing the spatial distribution of these similar spectra. This technique is a very powerful tool to determine the number of components in a certain sample volume. It does not require any a-priori knowledge about the sample; the user only has to guess the number of components he expects in the sample. For the sample consisting of PS and EHA, one would expect only two components, but to demonstrate the effect, three clusters are chosen.

Figure 2
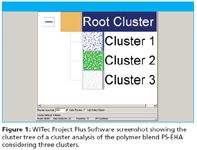
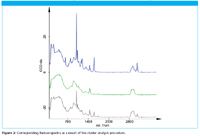
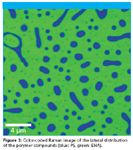
Figure 1 shows the cluster tree of the WITec Project Plus software with the distribution of the three selected components. Blue color denotes the area where PS is present and green shows the areas allocated to EHA. The third cluster, shown in gray, corresponds to the border between PS and EHA, because all spectra at these borders show the same amount of PS and EHA and are therefore also similar. This indicates that only these two materials are present in the sample and a higher number of clusters is not required. The average spectra for each cluster are shown in Figure 2. By combining the image clusters of the two components, the complete distribution of the two polymer phases can be visualized as shown in Figure 3.

Figure 3
Conclusion
WITec Project Plus is a powerful software package for advanced microscopic and chemometric data evaluation. A variety of intelligent algorithms for multivariate data analysis of hyperspectral Raman data files allow the computerized unveiling of hidden structures automatically as demonstrated with the polymer blend consisting of PS-EHA.

WITec GmbH
Lise-Meitner-Str. 6
89081 Ulm
Germany
Phone: +49 (0) 731 140 700
Fax: +49 (0) 731 140 70 200
Website: www.witec.de

Thermo Fisher Scientists Highlight the Latest Advances in Process Monitoring with Raman Spectroscopy
April 1st 2025In this exclusive Spectroscopy interview, John Richmond and Tom Dearing of Thermo Fisher Scientific discuss the company’s Raman technology and the latest trends for process monitoring across various applications.
A Seamless Trace Elemental Analysis Prescription for Quality Pharmaceuticals
March 31st 2025Quality assurance and quality control (QA/QC) are essential in pharmaceutical manufacturing to ensure compliance with standards like United States Pharmacopoeia <232> and ICH Q3D, as well as FDA regulations. Reliable and user-friendly testing solutions help QA/QC labs deliver precise trace elemental analyses while meeting throughput demands and data security requirements.