Energy Dispersive XRF in Soil Analysis for the Agrifood Sector
Energy dispersive X-ray fluorescence (XRF) has many applications in geosciences and geology, but for soil scientists, the technique is not as widely used as conventional methods involving acid digestion and inductively coupled plasma–optical emission spectrometry (ICP-OES) for elemental analysis. In the agrifood sector, soil sampling and analysis is a prerequisite for accurate fertilizer management, essentially to ensure that applications meet the nutritional demands of crops and grazing animals, but also to monitor the accumulation of heavy metals in soils receiving bio-solids and other recycled products. At Teagasc, our laboratories have a long history of soil analysis using traditional methods, but have recently looked to energy dispersive X-ray fluorescence (EDXRF) for soils, crops, and fertilizer products. This article describes EDXRF analysis of soils with variable textures (clay and sandy) and compared the percent recovery of elements as a measure of accuracy. Particle-size effects were observed in sandy soils, which compromised the accuracy of results. To improve accuracy, matching libraries using certified reference materials (CRM) were applied; however, this did not improve results when elements were present in low concentrations, indicating that the method is potentially more reliable for contaminated soils.
Regular soil sampling and analysis is required to maintain soil fertility and animal health. Often, this includes multi-elemental analysis, including major nutrients, trace elements, and heavy metals, especially in areas of soil contamination and for remediation work. Conventional methods for total element concentrations in soil require acid digestion and combustion that generate hazardous waste and disposal costs, adding to the overall costs of analysis. Optical sensing and X-ray spectrometry have grown in popularity as both a surrogate for acid digestion methods and a “green chemistry” alternative that avoids chemical waste. At Teagasc, we have examined the potential for energy-dispersive X-ray fluorescence (EDXRF) spectroscopy to quantify element concentrations across a range of sample types, namely soils (1), milk powder (2), and grass (3,4), as well as recycled products from waste streams of the dairy industry (5).
In this article, we describe the applications of benchtop EDXRF in soil analysis to determine elements relevant in agriculture. Typically, soil is a complex material and extremely heterogeneous, and we rarely handle the perfect homogenous sample. The soil matrix depends on the sample’s spatial occurrence in the landscape, the interactions with climatic conditions, degree of weathering, parent material, and management. Despite these factors, the basic soil matrix is always a mix of sand, silt, clay, organic matter, water, and air. Soil samples presenting in our laboratories can be expected to span the full range of texture classes from sandy to clay to silt-based textures, with a range of organic matter and distribution of elements (including nutrients, trace elements, and heavy metals).
Our laboratory is equipped with a benchtop Rigaku NEX CG EDXRF system that is fitted with a Pd X-ray tube and silicon drift detector. This system uses secondary targets in Cartesian geometry for indirect excitation, to improve the sensitivity of trace element analysis by reducing the background intensity. Rapid quantification of element concentration can be achieved with the fundamental parameters (FP) program; however, improving the accuracy of the system allows us to adjust FP results with matching libraries comprised of samples with known values. Typically, we check the reliability of our EDXRF system by running a library calibration of pure elements on a weekly basis to check for instrument drift.
Sample Preparation and Soil Texture
Soils that are presented in our laboratories for extraction and analysis are typically dried and sieved to 2 mm before being suspended in an acid mix. The first step in evaluating EDXRF as a potential tool was to examine the effect of sample preparation on the percent (%) recoveries of a range of elements. The options for preparing soil samples include loose powder (2 mm sieved), pressed pellet, or a pressed pellet with a binder added (Figure 1).
FIGURE 1: Common methods for soil sample preparation using low and high pressure for analysis on X-ray fluorescence (XRF) spectroscopy (a) loose powder (LP), 200 inch-pounds (in-lb) pressure added for 30 s; (b) pressed powder pellet (PP), 15 tons pressure added for 30 s; (c) pressed powder pellet with wax binder (PPB), 20 tons pressure added for 30 s.
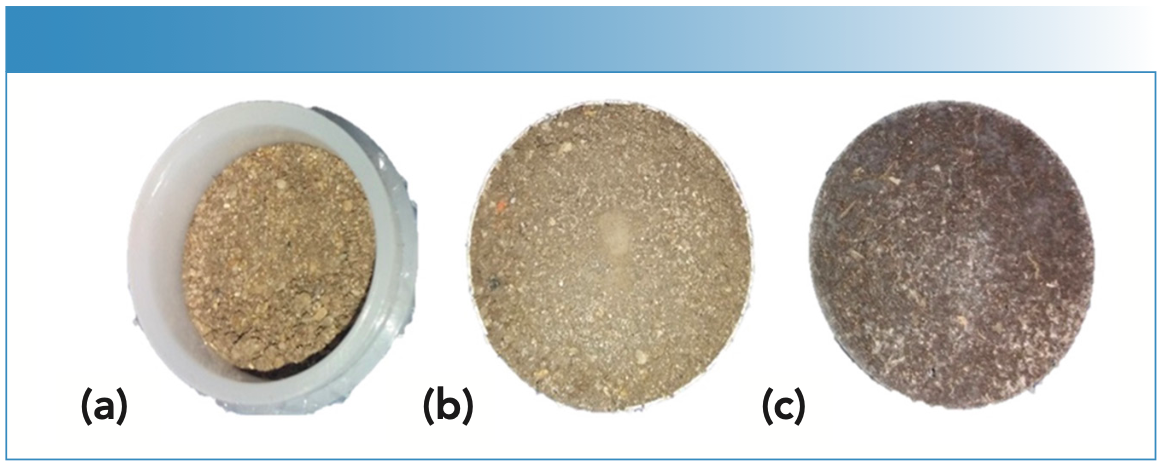
The soils in this study were known samples from an interlaboratory exchange program. The laboratories at Teagasc participates in the International Soil-Analytical Exchange (ISE) program, where registered laboratories receive and analyze samples as part of an interlaboratory comparison to test analytical proficiency. The samples originate from the Wageningen Evaluating Programs for Analytical Laboratories (WEPAL) and are accompanied by a database of elemental concentration and texture class. For this study, we used four WEPAL samples with different soil textures (sand, sandy clay, and clay), prepared them as loose powder (LP), pressed pellets (PP), and pellets pressed with binder (PPB) before scanning. With the EDXRF system, preparing samples as loose powder requires filling specialist plastic sample cups with 8 g of soil, whereas making pressed pellets requires 15 metric tons pressure applied to the same weight of soil using a manual hydraulic press. The third approach involved mixing 8 g soil with a binder (Fluxana Cereox wax binder) before pressing with 20 tons pressure to create the pellet.
Each of the four WEPAL samples were prepared using three different sample preparation methods outlined above, and scanned using the Rigaku NEX CG system. Element concentrations were determined using fundamental parameters (FP), and used to calculate percent recoveries as a benchmark or measure of accuracy. Recoveries (expressed as a %) are used here to compare EDXRF results with “true totals” provided by ISE laboratories based on total acid digestion using hydrofluoric acid, and other acid mixtures of HNO3 and other chemicals, including (but not limited to) HCl, HClO4, and H2SO4.
% recovery = (EDXRF concentration/ISE value) * 100 [1]
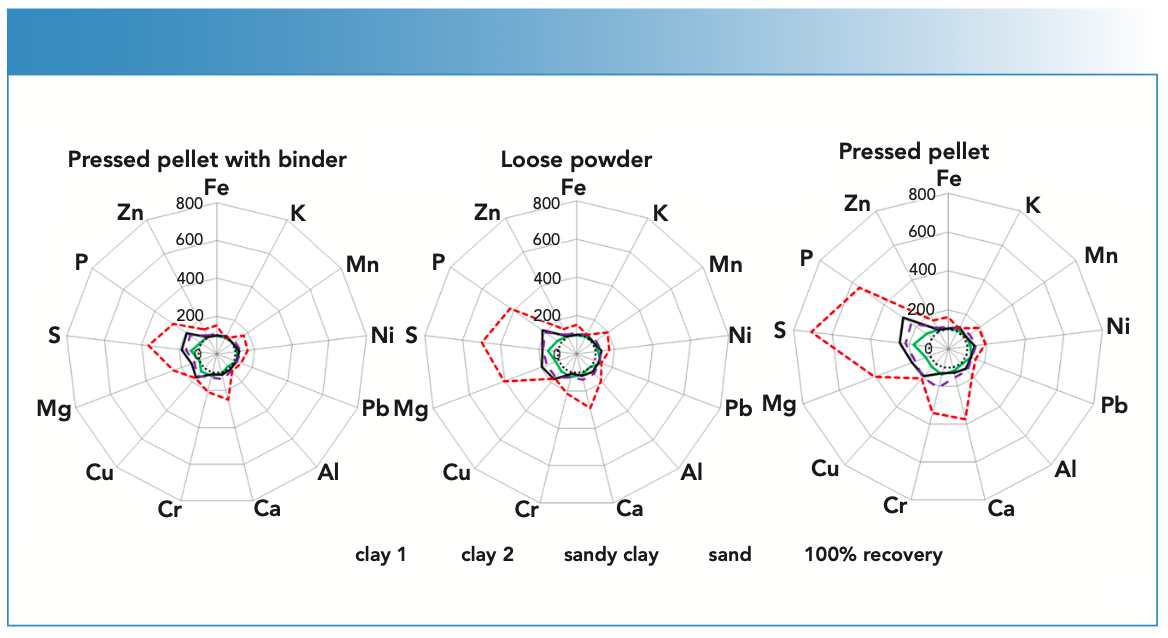
Taking a 100% recovery as a bench- mark and allowing a deviation of ±20%, we saw a wide range of recoveries from 87 to 708% across a range of elements, soil textures, and samples types. Element concentrations of K, Fe and Zn, Al, Pb, Mn, Ca, and Ni fell with the acceptable range (±20%), regardless of sample preparation (LP, PP, or PPB) for all of the ISE samples, except the sand sample. From this, we concluded that soils with clay or silt clay texture do not require high-pressure sample preparation methods, and can be analyzed as loose powders. However, the same cannot be said for sandy soils. In our study, the highest recovery of 708% was recorded for S in the sandy soil when prepared as a pressed pellet, and recoveries of >120% were recorded for Cu, Ca, Cr, Mg, and P, irrespective of sample preparation in the sand sample. Large-particle-size fractions in soils, such as sand (quartz), reduce the intensities reaching the detector, thereby limiting the accuracy of EDXRF for these particular soil textures.
In our study, particle size effects were not removed after pelletizing samples. Furthermore, preparing sandy soils as pressed pellets resulted in surface irregularities and heterogeneity, which could have an impact on accuracy of EDXRF element concentrations. Although preparing sandy soils as loose powders did not meet percent recovery thresholds of 100±20%, they did not deviate more than five times above the benchmark as the PP (Figure 1). A visualization of the results is shown in Figure 2. As a general rule for the clay and silt clay textured soils in this study, preparing soils as PPB is the best suited sample preparation method and provided the best accuracy as measured by the percent recoveries.
FIGURE 2: Effects of sample preparation on EDXRF analytical results using elemental recovery as a measure of accuracy with 100% recovery as the benchmark. All samples are from ISE archives (n = 4). (a) Pressed pellet with binder; (b) loose powder; (c) pressed pellet. For each subfigure the samples measured include: (green solid line) clay 1 (ISE 952); (black solid line) clay 2 (ISE 961); (broken purple line) sandy clay (ISE 992); and (broken red line) sand (ISE 995). The dotted black circle in the center represents 100% recovery levels.
Low Concentration of Elements
Once a method of preparing samples was established, we then examined elements that required some correction factors or calibration in XRF to bring the values closer to the true results. The elements examined in this instance were Cr, Cu, S, P, and Mg. As there were no standards for soil samples to evaluate the best sample preparation method for agricultural soils, we used certified reference materials (CRMs). In this case, CRMs are soils with certified values of elements and information around texture class. The accuracy of EDXRF was expressed as the percent recovery—that is, the ability of EDXRF to fully “recover” or determine the element concentration compared to the certified or actual reference concentration in the CRM. The EDXRF system allows us to enter results of CRM, and stores them as matching libraries that can be used to augment or adjust concentrations generated from the built-in FP algorithm. We sourced four CRMs, one of which was a contaminated soil with high concentrations of trace elements; the other CRM were selected to represent low and moderate concentrations of elements.
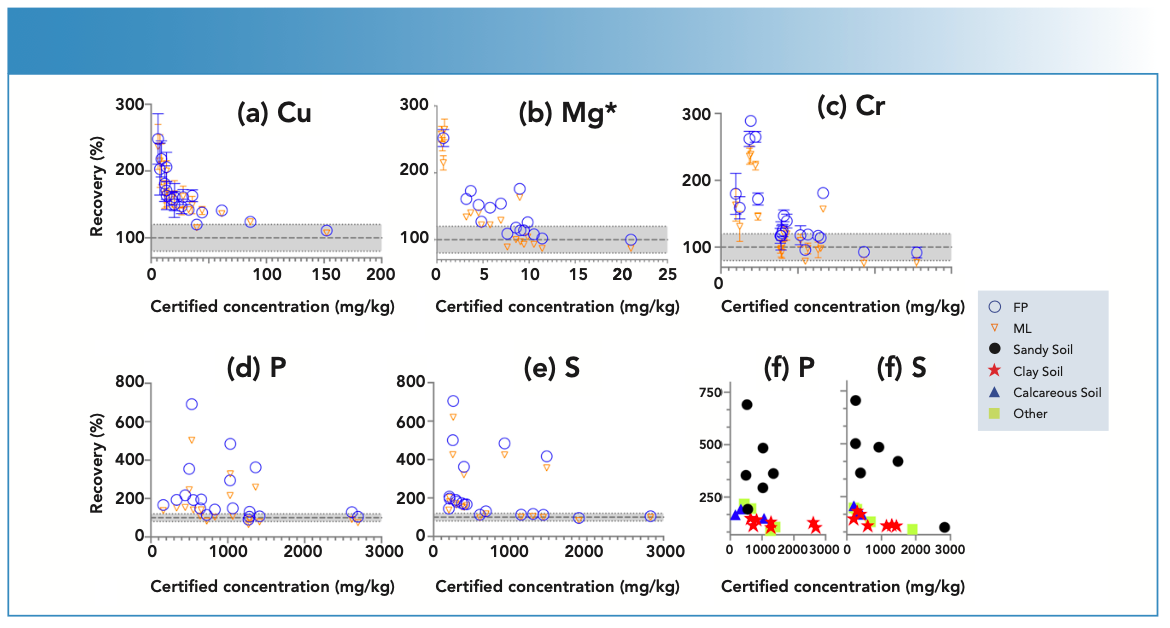
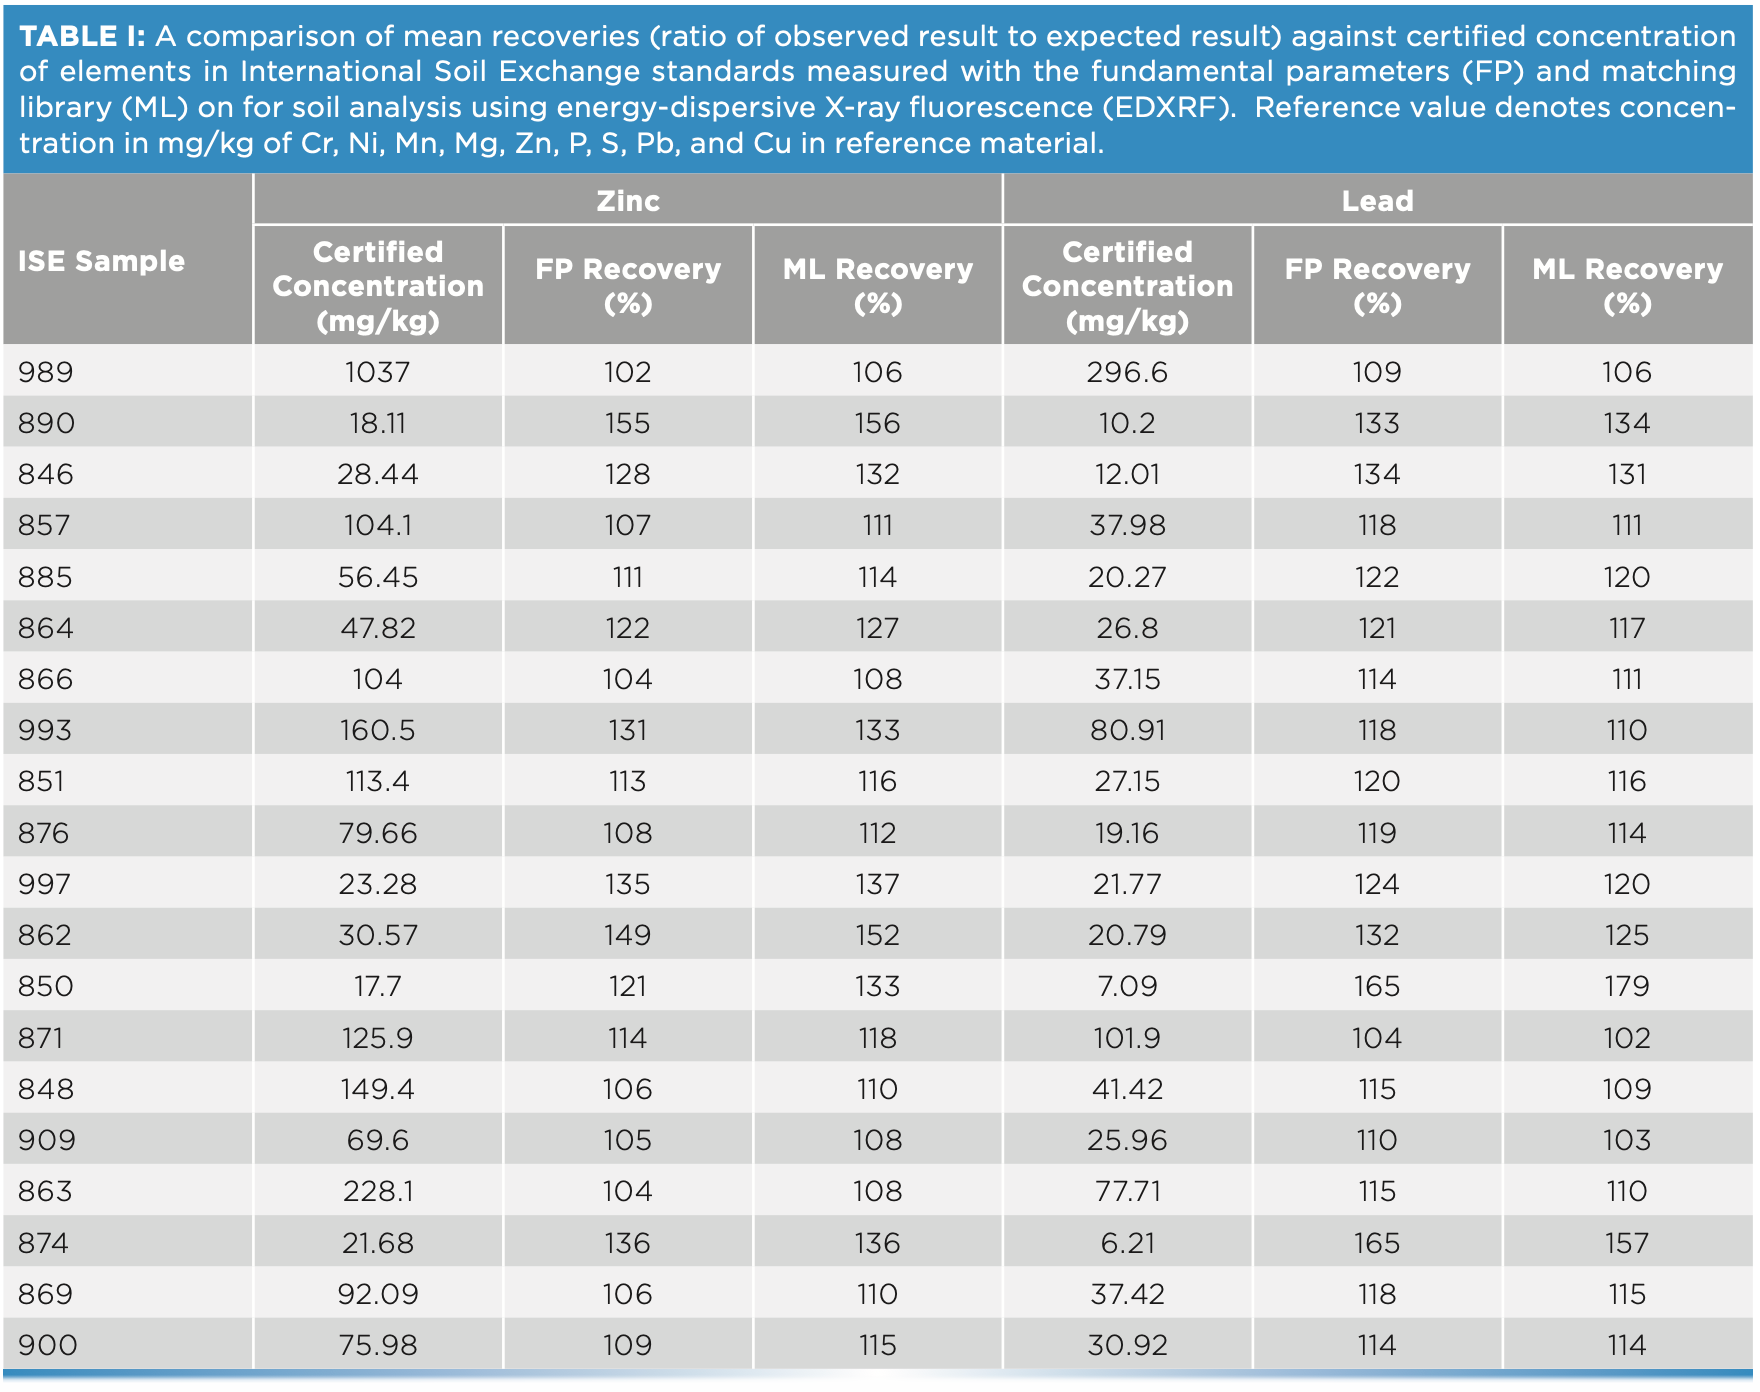
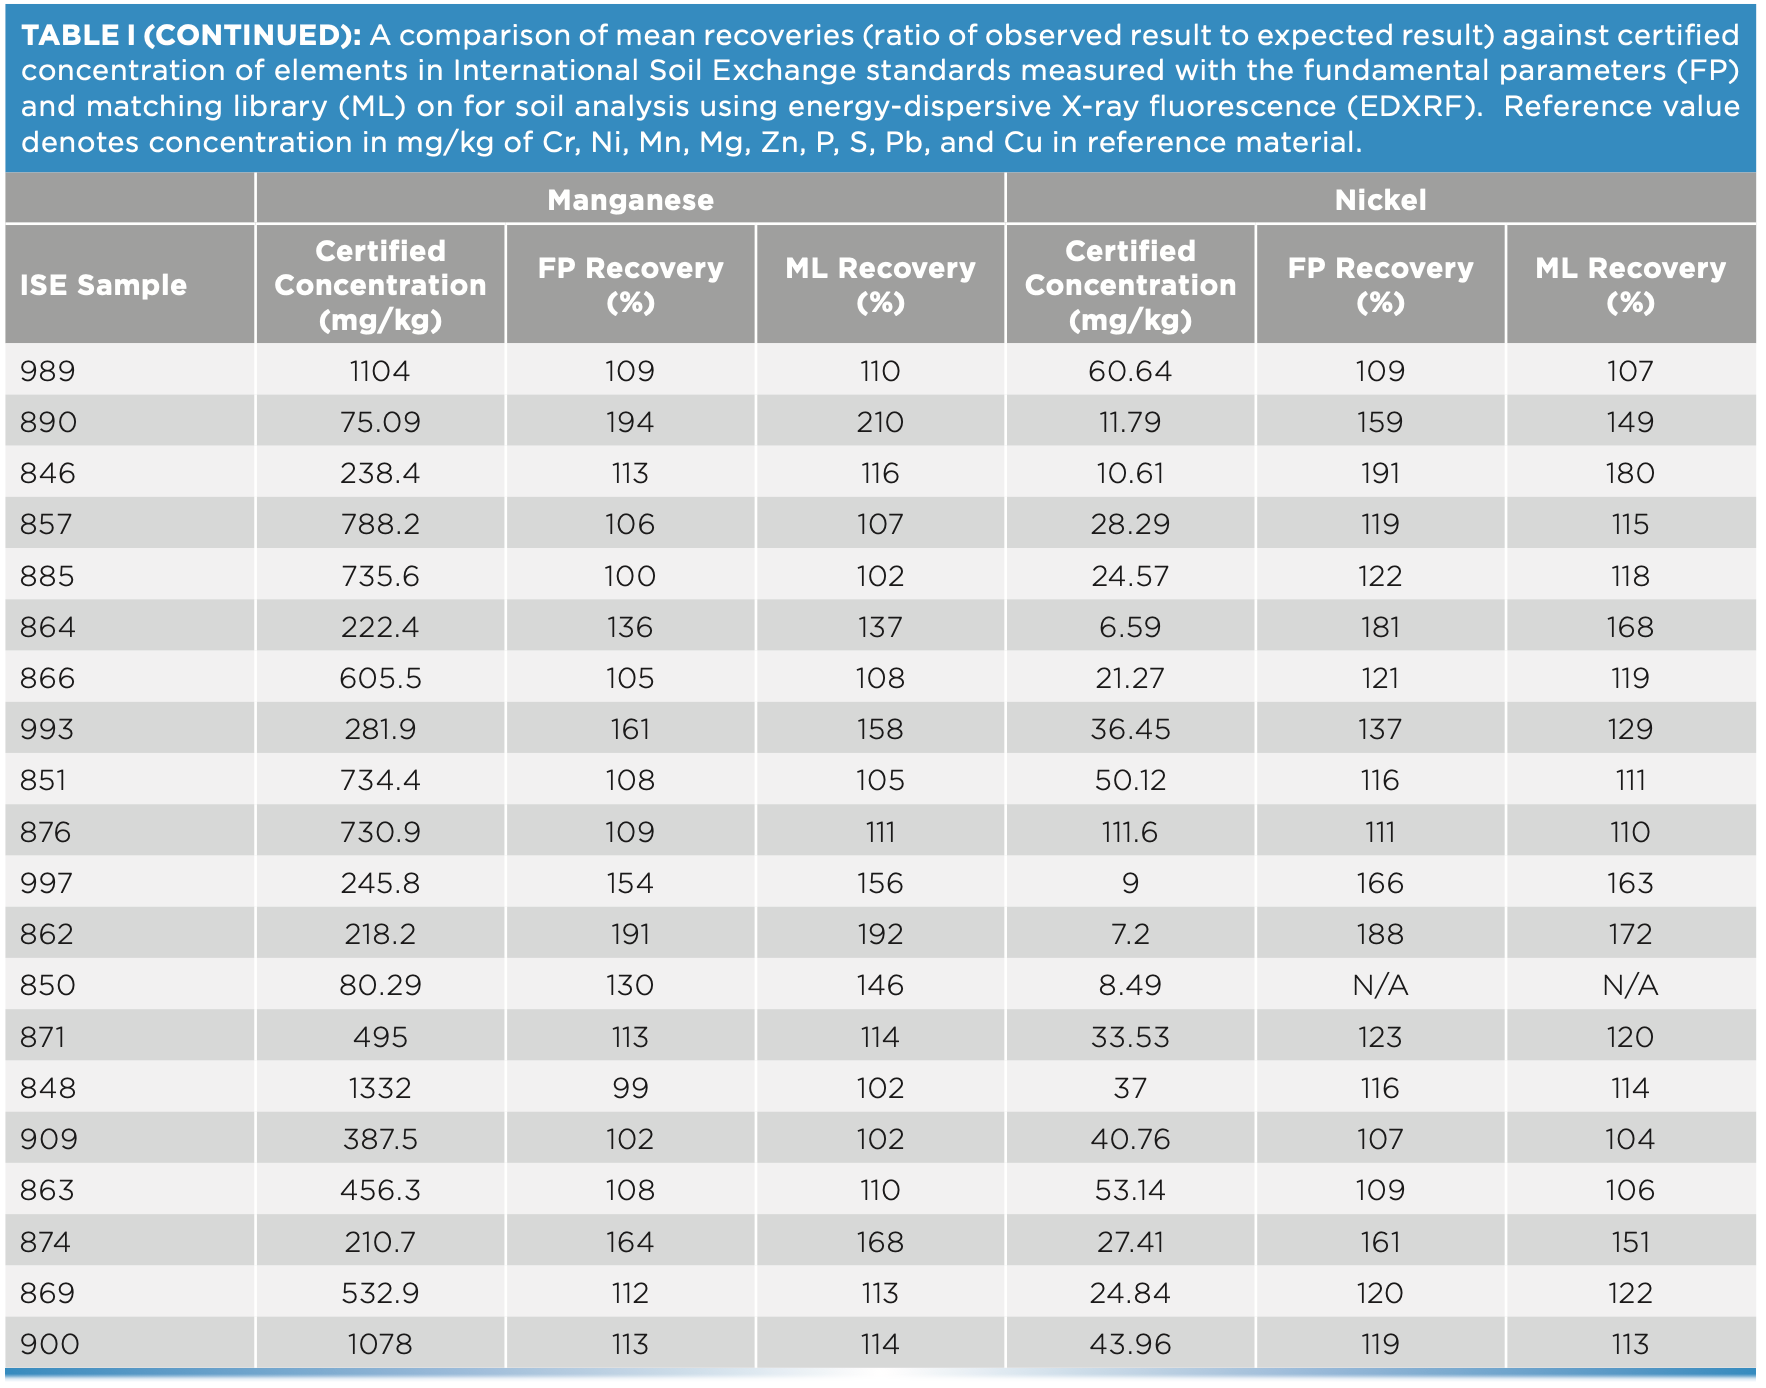
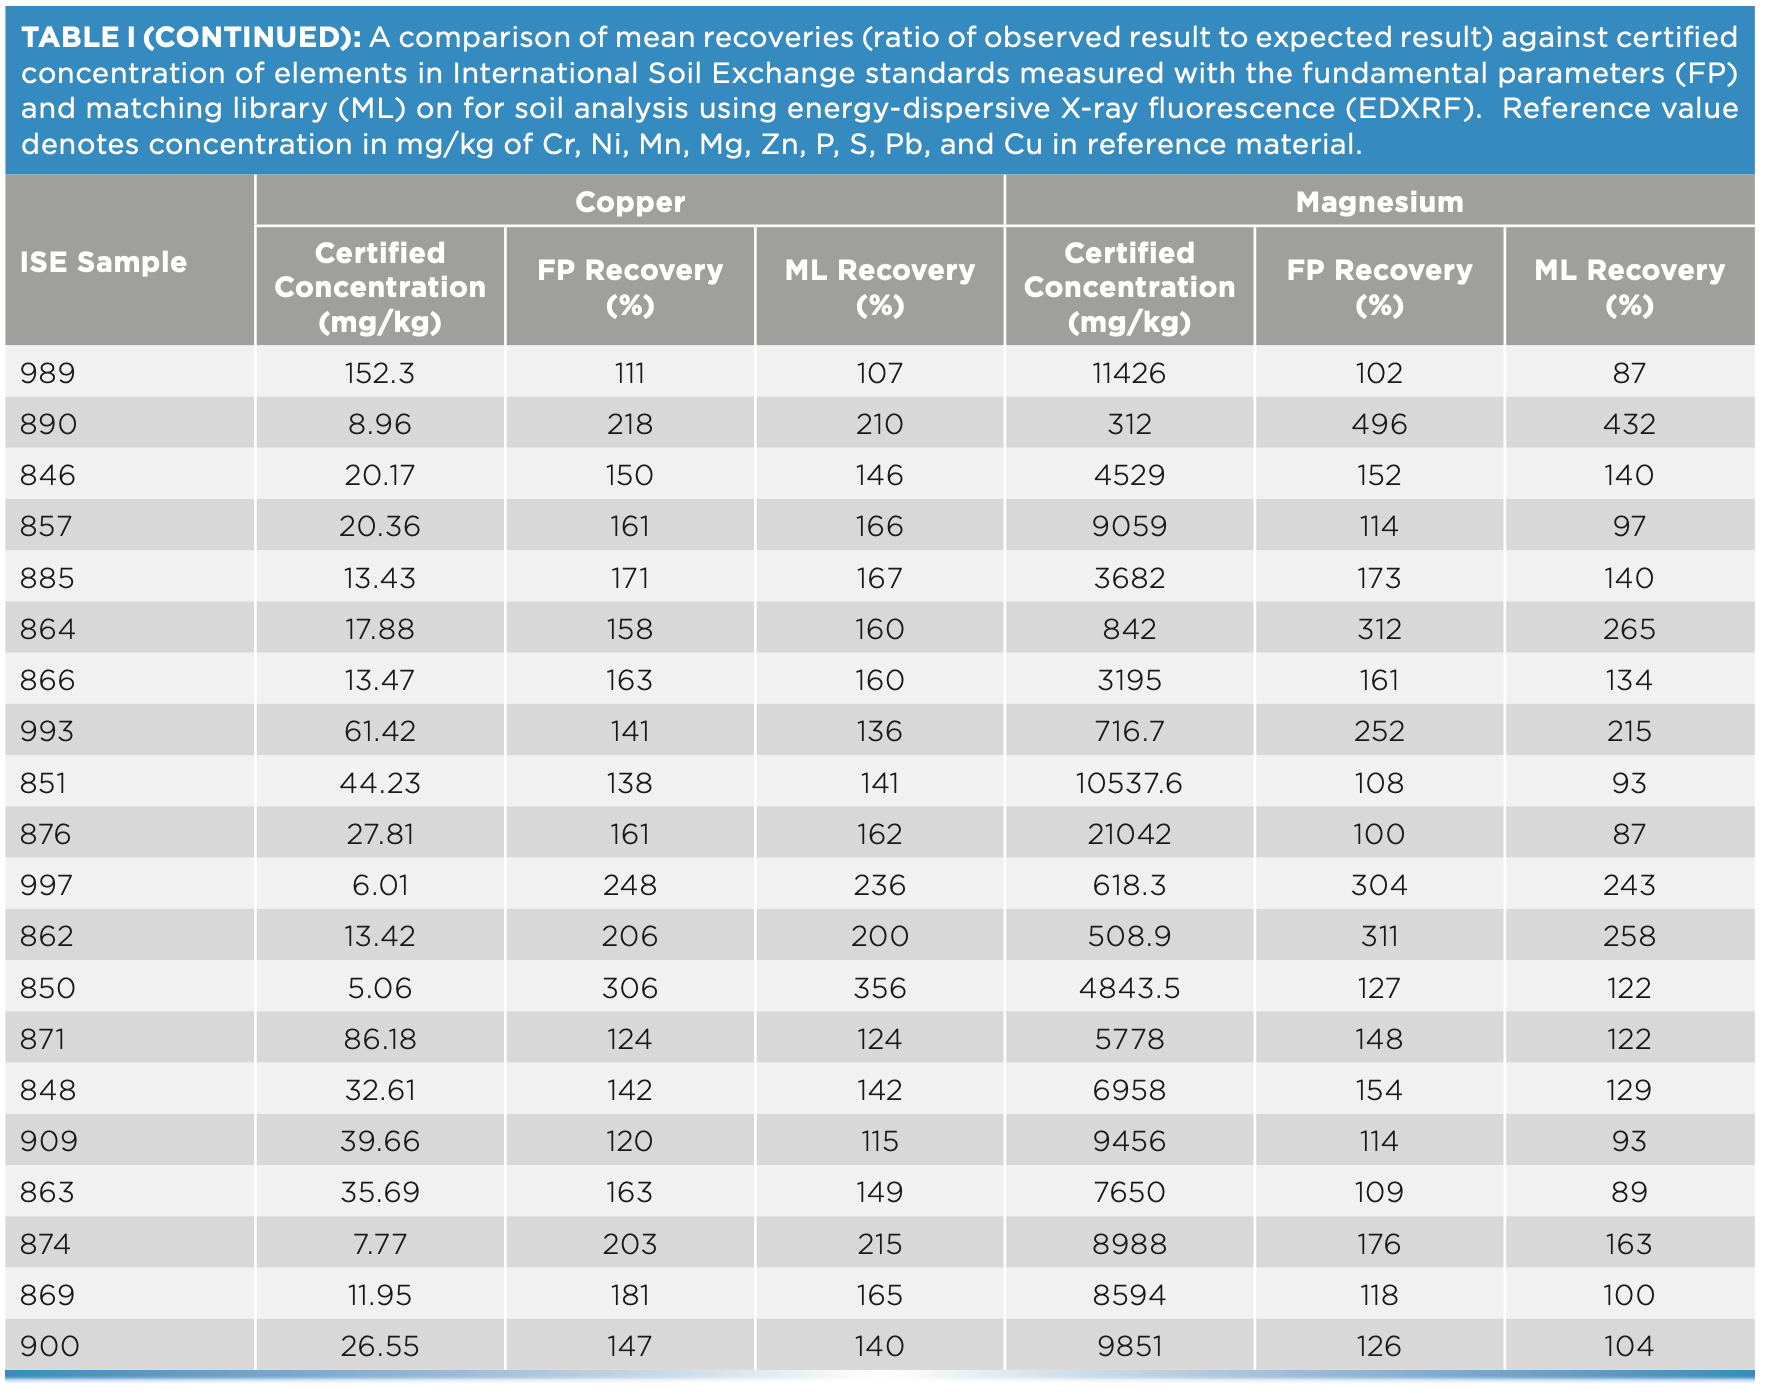
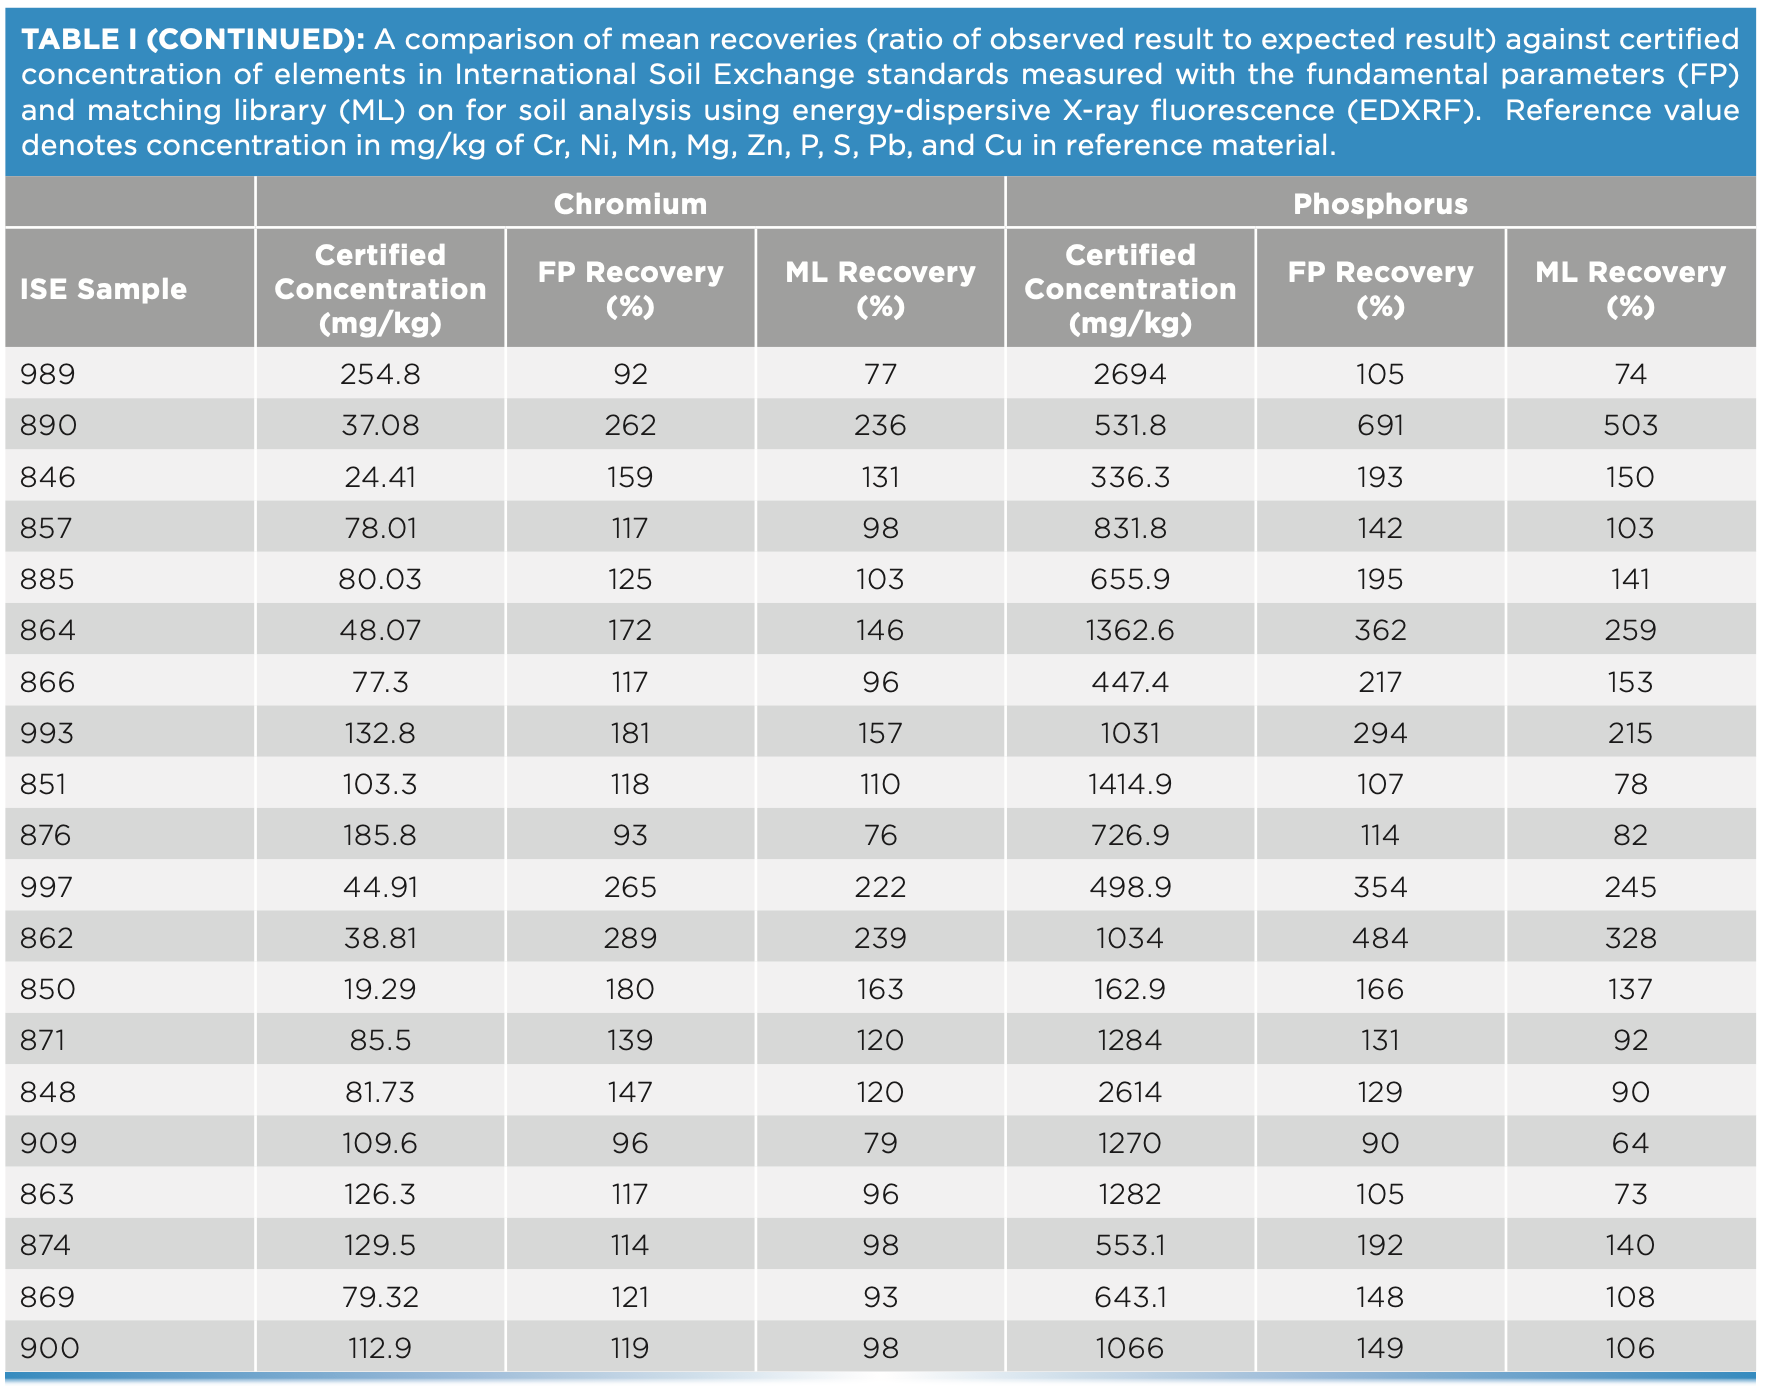
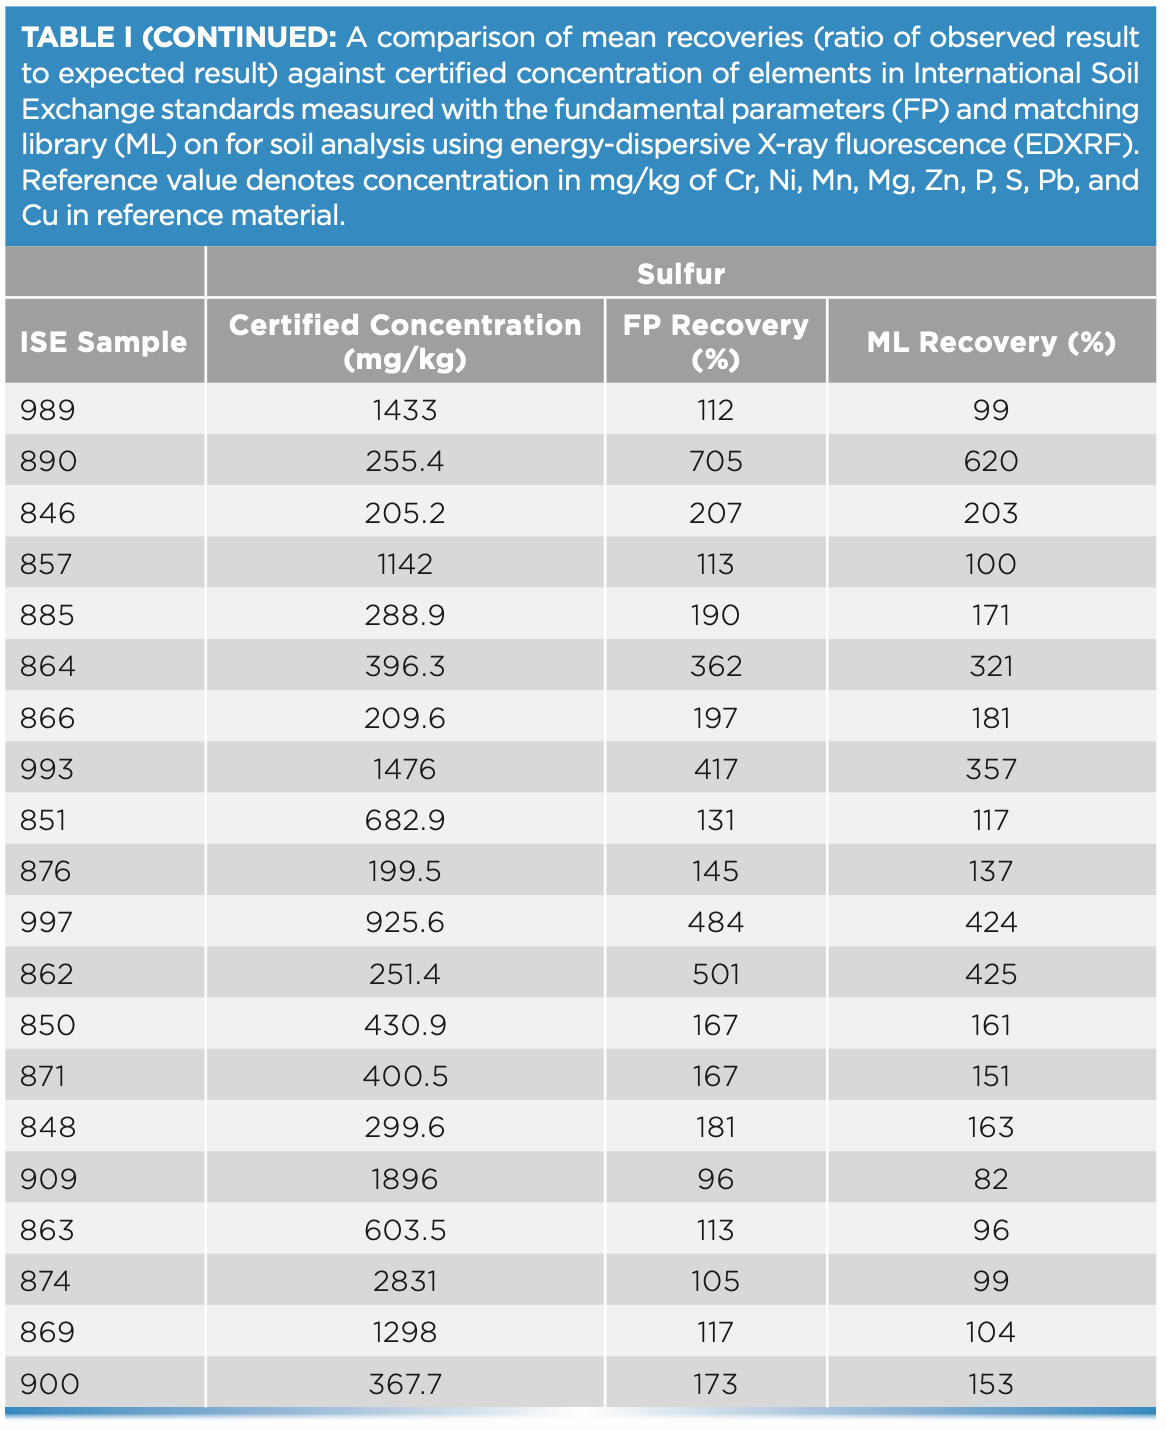
For this study, 20 ISE samples from WEPAL prepared as pressed pellets with binder were measured on the EDXRF instrument and concentrations generated with and without a matching library were compared for each of the elements—P, S, Cr, Cu, and Mg. Without any correction with matching libraries, the concentrations exceeded the 120% recovery limit when compared with true values, especially at low concentrations of these elements. In our study, the lower the element concentration in soil, the greater the difference was observed from the boundary values for percent recoveries (Figure 3).
FIGURE 3: Scatterplot of (a) Zn, (b) Pb, (c) Mn, and (d) Ni concentration against recovery in different soil types of ISE samples (n = 20) comparing fundamental parameters (FP)-derived results and matching library (ML)-adjusted analytical results on the energy-dispersive X-ray fluorescence spectrometer. The solid line denotes the target value of 100% recovery and the gray shaded region denotes the acceptable limit of ±20%. Yellow shading represents an acceptable range of element concentrations in European regulation 86/278/EEC.
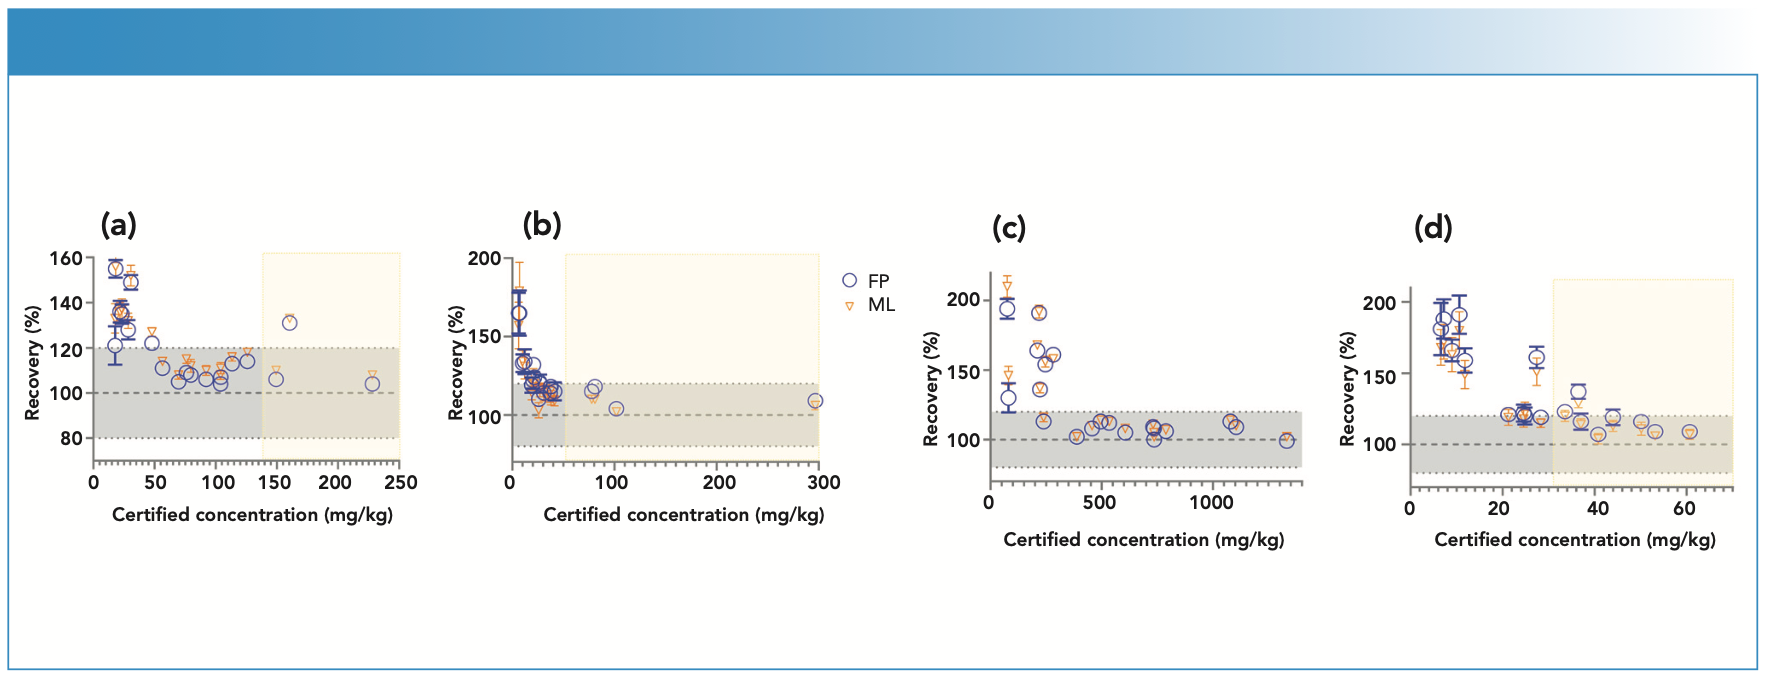
At low element concentrations, the intensities of an element line can be obscured by background intensities, especially for soils with “trace” amount of elements present. When the matching library was used to adjust FP values, the concentrations came closer to the boundary recovery value, possibly due to the matching library reducing the effect of background intensities on the signal reaching the detector. When the matching library was used to adjust the FP derived values, the effect was to bring percent recoveries closer to the acceptable boundary value. Similarly, for elements Zn, Pb, Mn, and Ni when present in low concentrations in samples, the percent recoveries when compared to true values, were greater than 120%. However, when concentrations were moderate to high, the percent recoveries fell within the acceptable range (Figure 4). Thus, when determining major plant nutrients and heavy metals in soil, EDXRF is concentration dependent, while at low concentration the values are overestimated; at high concentrations in contaminated soils, the method is more reliable.
FIGURE 4: Scatterplot of (a) Cu, (b) Mg, (c) Cr, (d) P, (e) S, and (f) P and S concentration against recovery in different soil types of ISE samples (n = 20) comparing fundamental parameters (FP)-derived results and matching library (ML)-adjusted analytical results on the energy-dispersive X-ray fluorescence spectrometer. The solid line denotes the target value of 100% recovery, and the gray shaded region denotes the acceptable limit of ±20%. All units are in mg/kg, except Mg, which is in g/kg.
Conclusion
Energy dispersive XRF was evaluated in this study as an alternative method, and while some soil types lend themselves to this technique in terms of minimum sample preparation (such as clay and loam soils), sandy soils presented difficulties due to particle size effects. In our study, sandy soils required sample preparation using a hydraulic press with a wax binder to achieve recoveries closer to acceptable levels. Soils with clay or silt-clay texture did not require high pressure sample preparation methods, and can be analyzed as loose powders. In this study, EDXRF was also concentration dependent, and at low concentration the values are overestimated; however, at high concentrations in contaminated soils, EDXRF was shown to be more suitable and reliable for analysis.
References
(1) M. Croffie, P.N. Williams, O. Fenton, A. Fenelon, K. Metzger, and K. Daly, Agronomy 10(9), 1309 (2020).
(2) W. McCarthy, K. Daly, A. Fenelon, C. O’Connor, N. McCarthy, S Hogan, J.T. Tobin, and T. O’Callaghan, Int. J. Dairy Technol. 73(2), 459–467 (2020).
(3) K. Daly and A. Fenelon, Irish J. of Agric. Food Research 56(1), 1–11 (2017).
(4) K. Daly and A. Fenelon, Appl. Spectrosc. 72(11), 1661–1673 (2018).
(5) K. Daly, O. Fenton, S.M. Ashekuzzaman, and A. Fenelon. Process Saf. Environ. Prot. 127, 216–210 (2019).
Karen Daly, Maame Croffie, Owen Fenton, Anna Fenelon, and Paul N. Williams are with the Environment, Soils and Land Use Department of the Johnstown Castle Research Centre of Teagasc–The Agriculture and Food Development Authority, in Wexford, Ireland. Paul N. Williams is a lecturer at The Institute for Global Food Security, School of Biological Sciences, at Queen’s University Belfast, in Northern Ireland. Direct correspondence to: karen.daly@teagasc.ie

AI Shakes Up Spectroscopy as New Tools Reveal the Secret Life of Molecules
April 14th 2025A leading-edge review led by researchers at Oak Ridge National Laboratory and MIT explores how artificial intelligence is revolutionizing the study of molecular vibrations and phonon dynamics. From infrared and Raman spectroscopy to neutron and X-ray scattering, AI is transforming how scientists interpret vibrational spectra and predict material behaviors.
Advancing Corrosion Resistance in Additively Manufactured Titanium Alloys Through Heat Treatment
April 7th 2025Researchers have demonstrated that heat treatment significantly enhances the corrosion resistance of additively manufactured TC4 titanium alloy by transforming its microstructure, offering valuable insights for aerospace applications.
Microplastics Widespread on Catalan Beaches, Study Finds
March 28th 2025In a recent study published in Marine Pollution Bulletin, a team of researchers from several Spain and Portugal universities and institutions (Rovira i Virgili University, Universitat de Barcelona, University of Porto, and Institut d'Investigació Sanitaria Pere Virgili (IISPV) assessed microplastic (MP) contamination along the Mediterranean coastline.