Fiberoptic Formaldehyde Field Sensors for Industrial Environments: Capitalizing on Evanescent-Wave Spectroscopy
An inexpensive fiberoptic-based formaldehyde field sensor is described for monitoring low-levels of formaldehyde, a widespread indoor air pollutant, based on the principle of evanescent wave absorption of light. Sensor prototypes following that principle are being tested in two plywood board production plants.
Formaldehyde is an indoor air pollutant that is widespread across many industries. The established implication of formaldehyde in respiratory conditions and its carcinogenicity pose a risk to millions of workers in the wood and textile industries. We have developed an optical sensor based on the evanescent wave absorption of light by the tailored formaldehyde-sensitive cladding of a modified commercial plastic optical fiber. This known spectroscopic technique, in combination with the inexpensive plastic optical fibers, has proven to be a powerful tool for formaldehyde monitoring. Sensor prototypes following that principle are being tested in two Spanish plywood board production plants. The manufactured fiberoptic sensors have been designed to meet the requirements of in situ, continuous, and unattended occupational FA monitoring with a detection limit of 250 μg/m3 (0.20 ppm).
Formaldehyde is a relevant indoor air pollutant that is widespread in many industries. The implication of formaldehyde in respiratory conditions and its carcinogenic potential pose a risk to millions of workers in multiple sectors, such as the wood, textile, construction, and automotive industries (1). Reducing the risks related to formaldehyde exposure can be economically demanding in terms of equipment and personnel (2). Although many portable formaldehyde sensors are available, reliable and automated detection systems for affordable continuous monitoring are scarce (3). Spectroscopic techniques can greatly assist in the development of powerful analytical tools for industrial process analysis and safety assurance (4–6). In particular, fiberoptic-based sensors offer valuable advantages for industrial chemical monitoring in terms of reduced weight and size, portability, low cost, and immunity to electromagnetic interferences (7). Fiberoptic evanescent wave (EW) interrogation (also called evanescent field sensing, or EFS) can easily be combined with any conventional optical analytical technique that is most convenient for a given application, such as fluorescence, ultraviolet, visible, near- or mid-infrared absorption, and Raman scattering spectroscopies (8).
A typical fiberoptic-based absorption EFS setup consists of a light source coupled to an analyte-sensitive fiber, the distal end of which is interfaced to a detector. In this setup, the light propagates from the light source to the detector through the sensing waveguide. The waveguide then responds to changes in the desired optical parameter (whether that is intensity, wavelength, or phase) (9). The diversity of optical fiber materials increases the options for chemical-sensing purposes. Plastic optical fibers (POFs) are attractive alternatives to the conventional multimode silica optical fibers because of their increased robustness, significantly lower prices, and ease of handling. Their only main drawback is that their main features come at the expense of higher attenuation (10).
Multimode fibers are based on a core–cladding structure. Light propagates through the core by means of total internal reflections at the core–cladding interface, as long as the refractive index of the cladding is lower than that of the core. Each internal reflection generates an EW that passes into the cladding. EWs are exponentially decaying electromagnetic fields that propagate perpendicularly to the core–cladding interface into the cladding medium. The actual penetration depth (dp), on the order of the propagating light wavelength, depends on the latter (λ), the incidence angle at the interface (θ), and the refractive indexes of cladding (ncl) and core (nco), according to equation 1 (11):

[1]
Absorption-based EW fiberoptic sensors measure the color variations of the cladding produced by an incoming analyte that typically undergoes a color-changing reaction with an “indicator” dye embedded therein. Interrogation of the colorimetric reaction occurs through the EW propagating inside the cladding. In this way, the optical fiber itself acts as an optical cell. The amount of analyte that penetrates the cladding from the sample can be directly correlated to the power loss of the light traveling along the fiber at specific wavelengths, namely those within the absorption spectrum of the indicator dye (12).
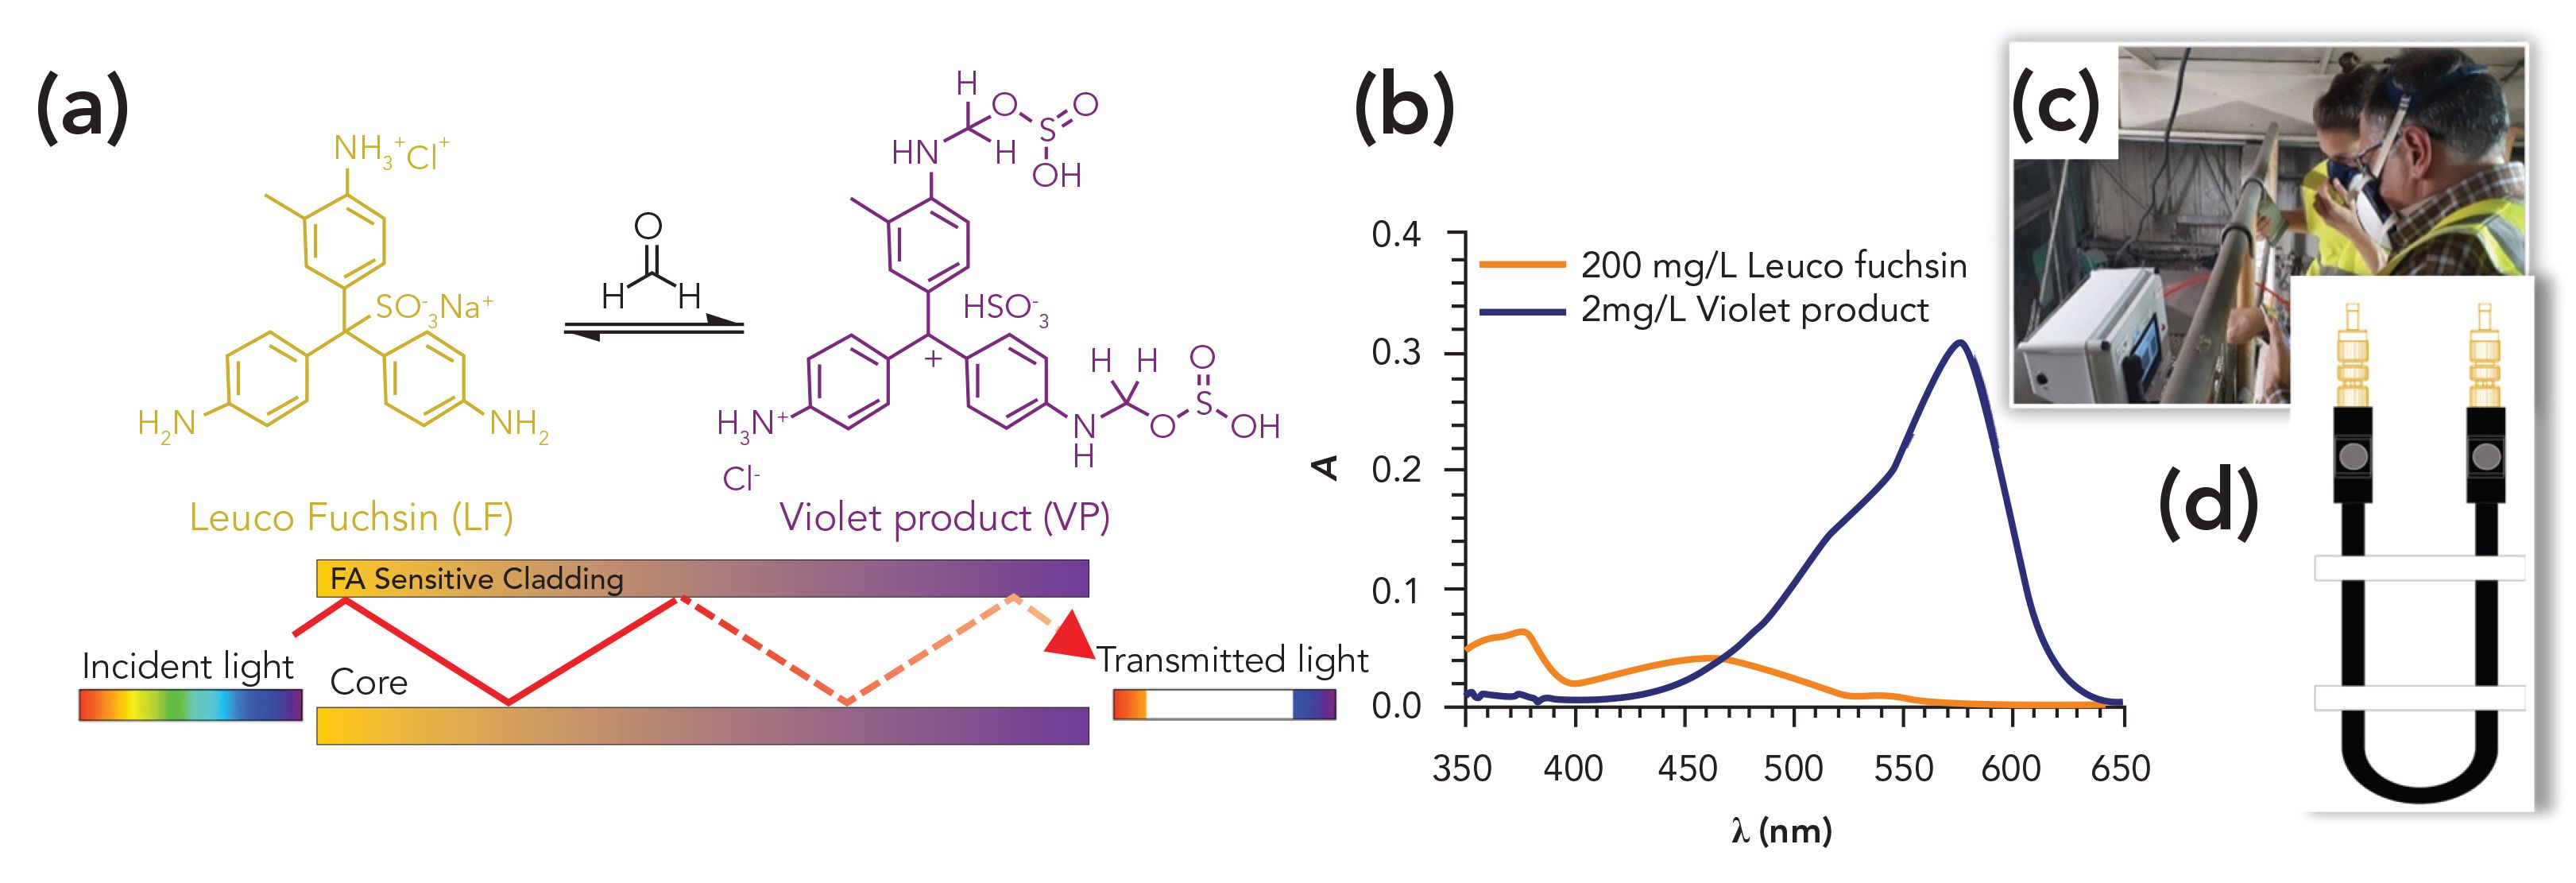
For the detection of formaldehyde, we capitalized on the EW absorption changes undergone by the reduced form of fuchsin, a known colorimetric reagent for this aldehyde. The presence of formaldehyde in the fiber cladding is detected through the formation of a violet product (VP) as a result of the reaction between the leuco (“colorless”) form of fuchsin and formaldehyde (Figures 1a–b). The absorption changes of the manufactured FA-sensitive optical fibers are detected with a custom-made portable instrument with dedicated software, tailored to in situ, near-real time, unattended airborne FA monitoring in industrial facilities (Figure 1c). The initial analytical results of the sensor before its deployment in a plywood board production plant are reported herein.
Figure 1: (a) The leuco fuchsin (LF) reaction with formaldehyde (FA) to yield the “violet product” (VP) and scheme of the fiberoptic evanescent field absorption principle. (b) Solution absorption spectra of LF and VP. (c) FA optical sensor prototype in the plywood factory during field tests. (d) Internal measurement chamber containing the FA-sensitive optical fiber.

Materials and Methods
Formaldehyde-Sensitive Optical Fiber
The sensitive optical fibers were fabricated from a multimode step-index plastic optical fiber (PFU-FB-1000, Toray Raytela, Japan) of 1000 μm external diameter (980 μm poly[methyl methacrylate] core and 10 μm perfluorinated acrylate cladding) (13). Before the sensitive coating could be applied, the original cladding of the fiber was removed by chemical dissolution. To remove the original cladding, a mixture of 200 mL of a mixture of acetone (VWR International, HPLC grade), methyl isobutyl ketone (Alfa Aesar, 99.0%) and type I purified water (Direct-Q, Merck) (3:1:1 by volume) was placed in an evaporation dish containing 1 m of the optical fiber. After magnetically stirring for 45 min, the remaining cladding was manually removed with latex gloves.
Then, 40 cm of an uncladded optical fiber was hung vertically while a drilled rubber septum containing 500 µL of a Nafion D-521 dispersion in lower alcohols (Alfa Aesar, 5% w/w, >0.92 meq g-1 exchange capacity) was extended manually around the fiber with a slow constant slide movement. The re-cladded fibers were allowed to ambient dry for 24 h.
The dye immobilization involved immersing each Nafion-coated fiber for 2 h in 50 mL of an aqueous solution containing 40 mL of a 0.25 g/L basic fuchsin (Fluka Analytical), 2.0 g of sodium bisulfite (VWR Eurolab, reagent grade), and 10.8 mL of phosphoric acid (Fisher Scientific, ≥85%) (such a mixture quantitatively generates the leuco fuchsin in situ). After 24 h contact, 37.5 cm segments of the fiber were cut, end polished, and fitted into a nylon-made opaque fiber chamber, designed and manufactured in our facilities (Figure 1d).
Formaldehyde-Sensitive Optical Fiber Calibration
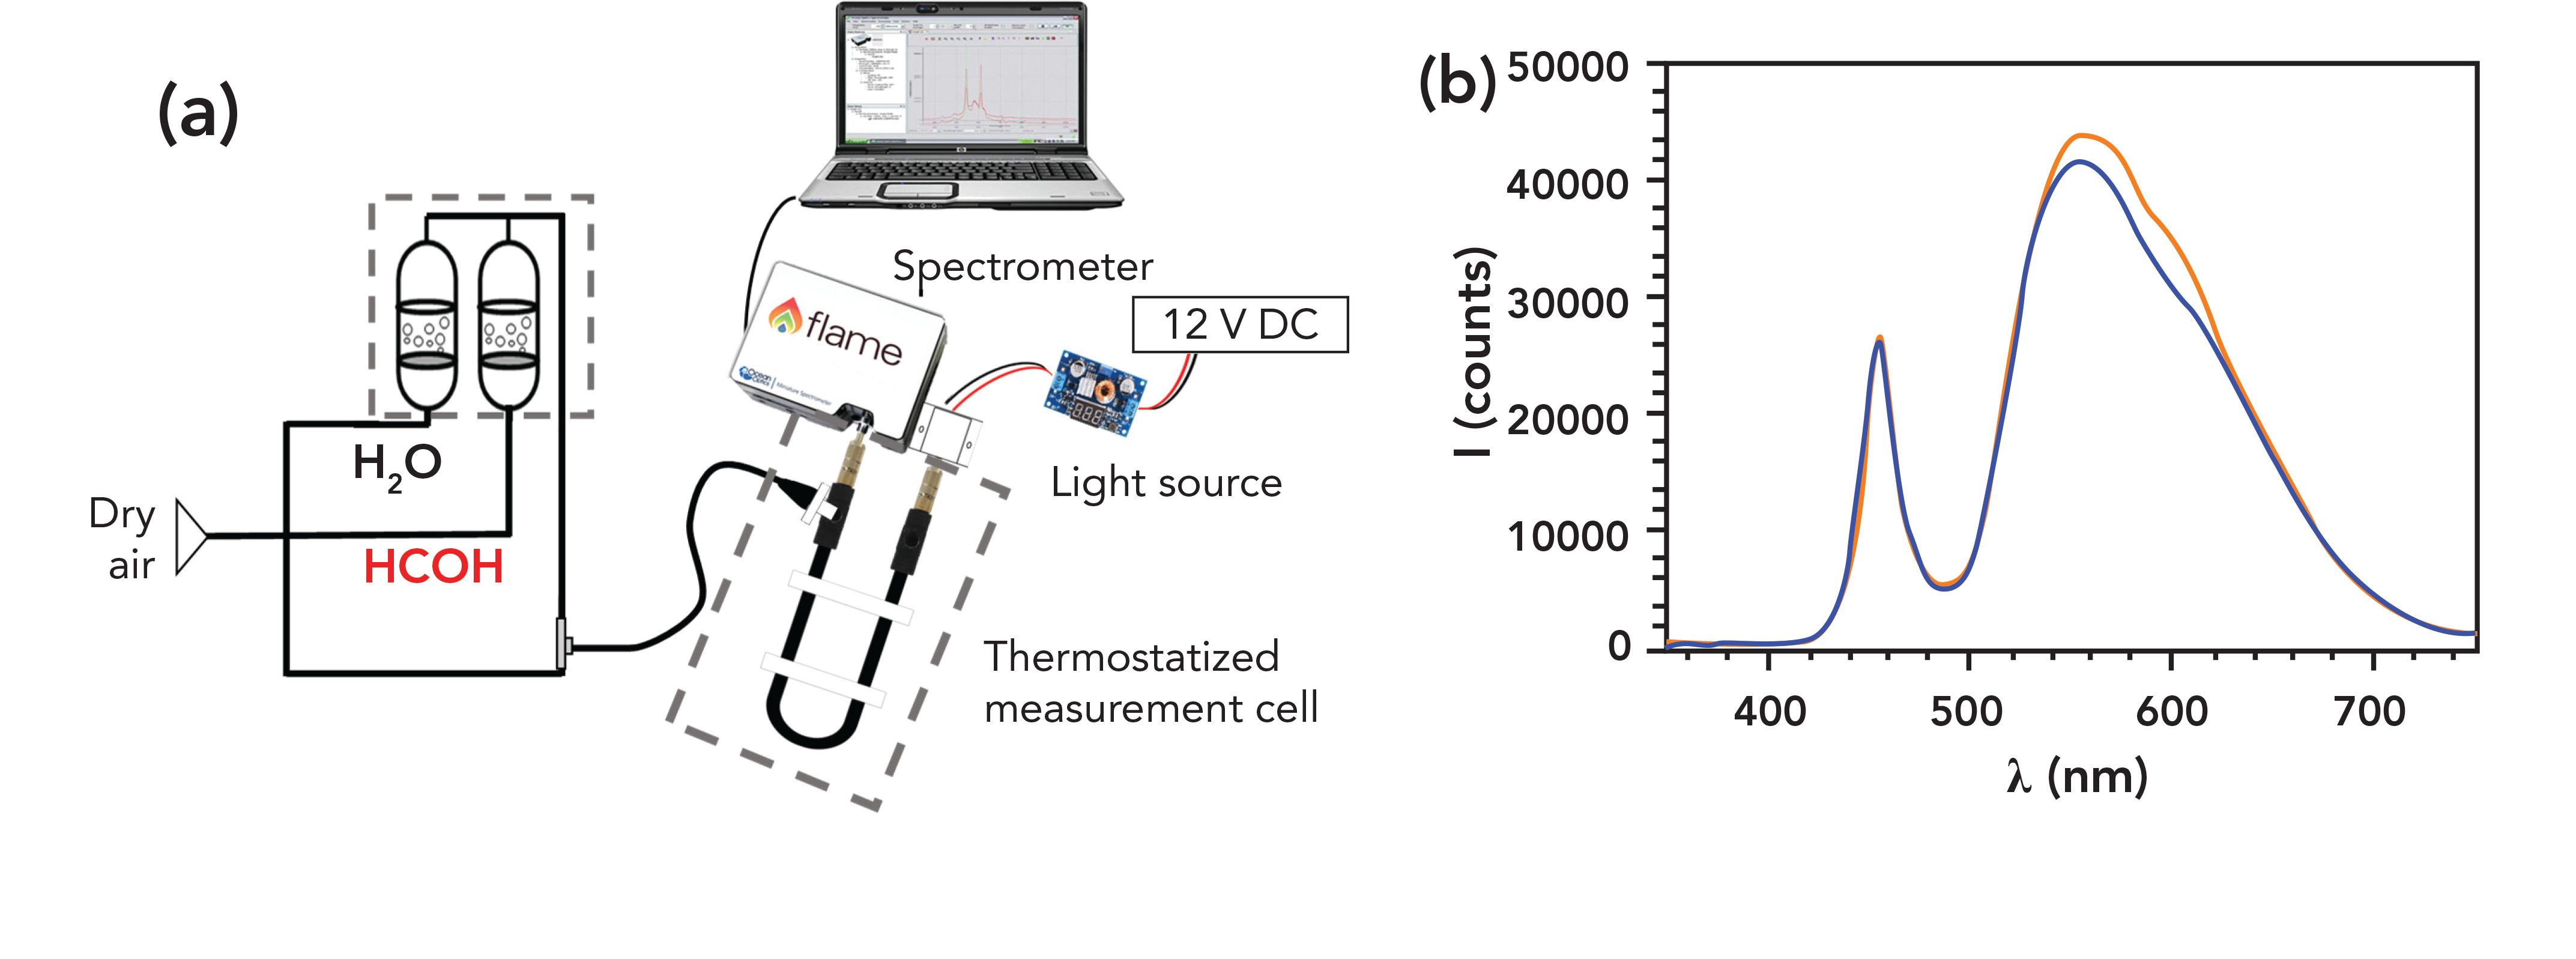
The response to formaldehyde of the sensitive optical fibers was evaluated in air in the 0 to 6.7 ppm range (equivalent to 0 to 8.24 mg/m3), at atmospheric pressure, controlled temperature (25 ± 1 °C), constant relative humidity (RH) (50%) and flow rate (75 mL/min). The carrier air was obtained from cylinders (99.995%) supplied by Carburos Metálicos (Spain). The formaldehyde air streams were generated by concentrated gaseous formaldehyde (2.5 to 14 mL/min) with pure air (25 to 60 mL/min) and a 100% RH air stream generated in a water sparger (25 to 60 mL/min). Figure 2 illustrates this scheme.
Figure 2: (a) Laboratory calibration and test rig scheme. (b) Raw transmission spectra of a formaldehyde-sensitive optical fiber in the absence of this chemical (orange top line) and after 15 min exposure to 3.3 ppm in air (blue lower line) at 25 ºC and 50% RH (spectral acquisition parameters: boxcar 7, 10-scans average, 100 ms integration time).

The concentrated formaldehyde stream was produced by passing air (2.5–10 mL/min) through a sparger at 25.0 ± 0.5 °C (thermostatic bath) containing an aqueous formaldehyde solution (0.18 M) made by dilution of commercial FA (Sigma-Aldrich, 37.2% in water) with ultrapure water. Every gas stream was set individually with electronic mass-flow controllers (Bronkhorst F–211CV) with maximum flows of 15, 50, and 300 mL/min, respectively, controlled by PiD Eng&Tech Process@v.2.2.1.0 software.
EW-Based Optical Fiber Spectrometer
Formaldehyde measurements were carried out using a ruggedized portable device designed and manufactured at our university facilities. The optoelectronic unit of the sensing device monitors the changes in the transmitted light through the indicator-cladded optical fiber from the ratio of the detected intensities at 575 nm to 455 nm every minute. Figure 1d shows the sensitive optical fiber inside the U-shaped sample chamber with standard SMA connectors for POF (Ratioplast Optoelectronics), connected to a white LED (STS-DA1-1479) enclosed in an ABS 3D-printed housing and to a compact mini-spectrometer (FLAME-S-VIS-NIR-ES, Ocean Insight) equipped with a 25 μm entrance slit (Figure 2a). Instrument configuration, calibration curves, and collected data are stored locally in the ruggedized sensor system CPU. The latter manages the described components by a dedicated software built on LabVIEW drivers (NI), developed in our research group. The acquired data, including formaldehyde concentration readings associated to the sensor location, can be accessed and downloaded remotely at any time via a Wi-Fi network. Our software allows the instrument to operate fully unattended as long as required, because it can trigger the sample acquisition automatically once the baseline is recovered after each measurement, upon regeneration with clean air (Figure 1c).
Results and Discussion
The transmission spectra of the formaldehyde-sensitive optical fibers were recorded initially to evaluate the effect of the embedded LF on the light emerging from the distal fiber end, with respect to a pure optical fiber. The effect of the formation of the violet product on the transmitted light was subsequently investigated. Figure 2b shows the transmission spectra of the sensing fiber in the absence and presence of formaldehyde. The decrease of the detected intensity in the 540 to 640 nm spectral region of the LF-containing fiber upon diffusion of the analyte into the cladding reveals the effect of the interaction of formaldehyde with the indicator dye. LF displays weak absorption in the 350 to 500 nm spectral region, but the violet product strongly absorbs in the 450 to 650 nm range. Figure 1b shows the absorption peaks at 575 nm. Therefore, when the violet product forms, the intensity of the light emerging from the distal end of the fiber decreases with respect to that in the absence of analyte resulting from the absorption of the evanescent wave at every internal reflection of the transmitted light.
The identification of the transmission loss region is key for successful EW monitoring using indicator-cladded optical fibers. However, the analytical signal must also be corrected for small fluctuations in the light source or differences in the installation or manufacturing of the various sensitive POFs. Therefore, we monitored the signal by ratioing the 575 nm main band to the 455 nm peak (both integrated over 5 pixels). The 455 nm peak is a region where both LF and VP absorb weakly and allow the underlying blue LED emission of the white diode to shine through.
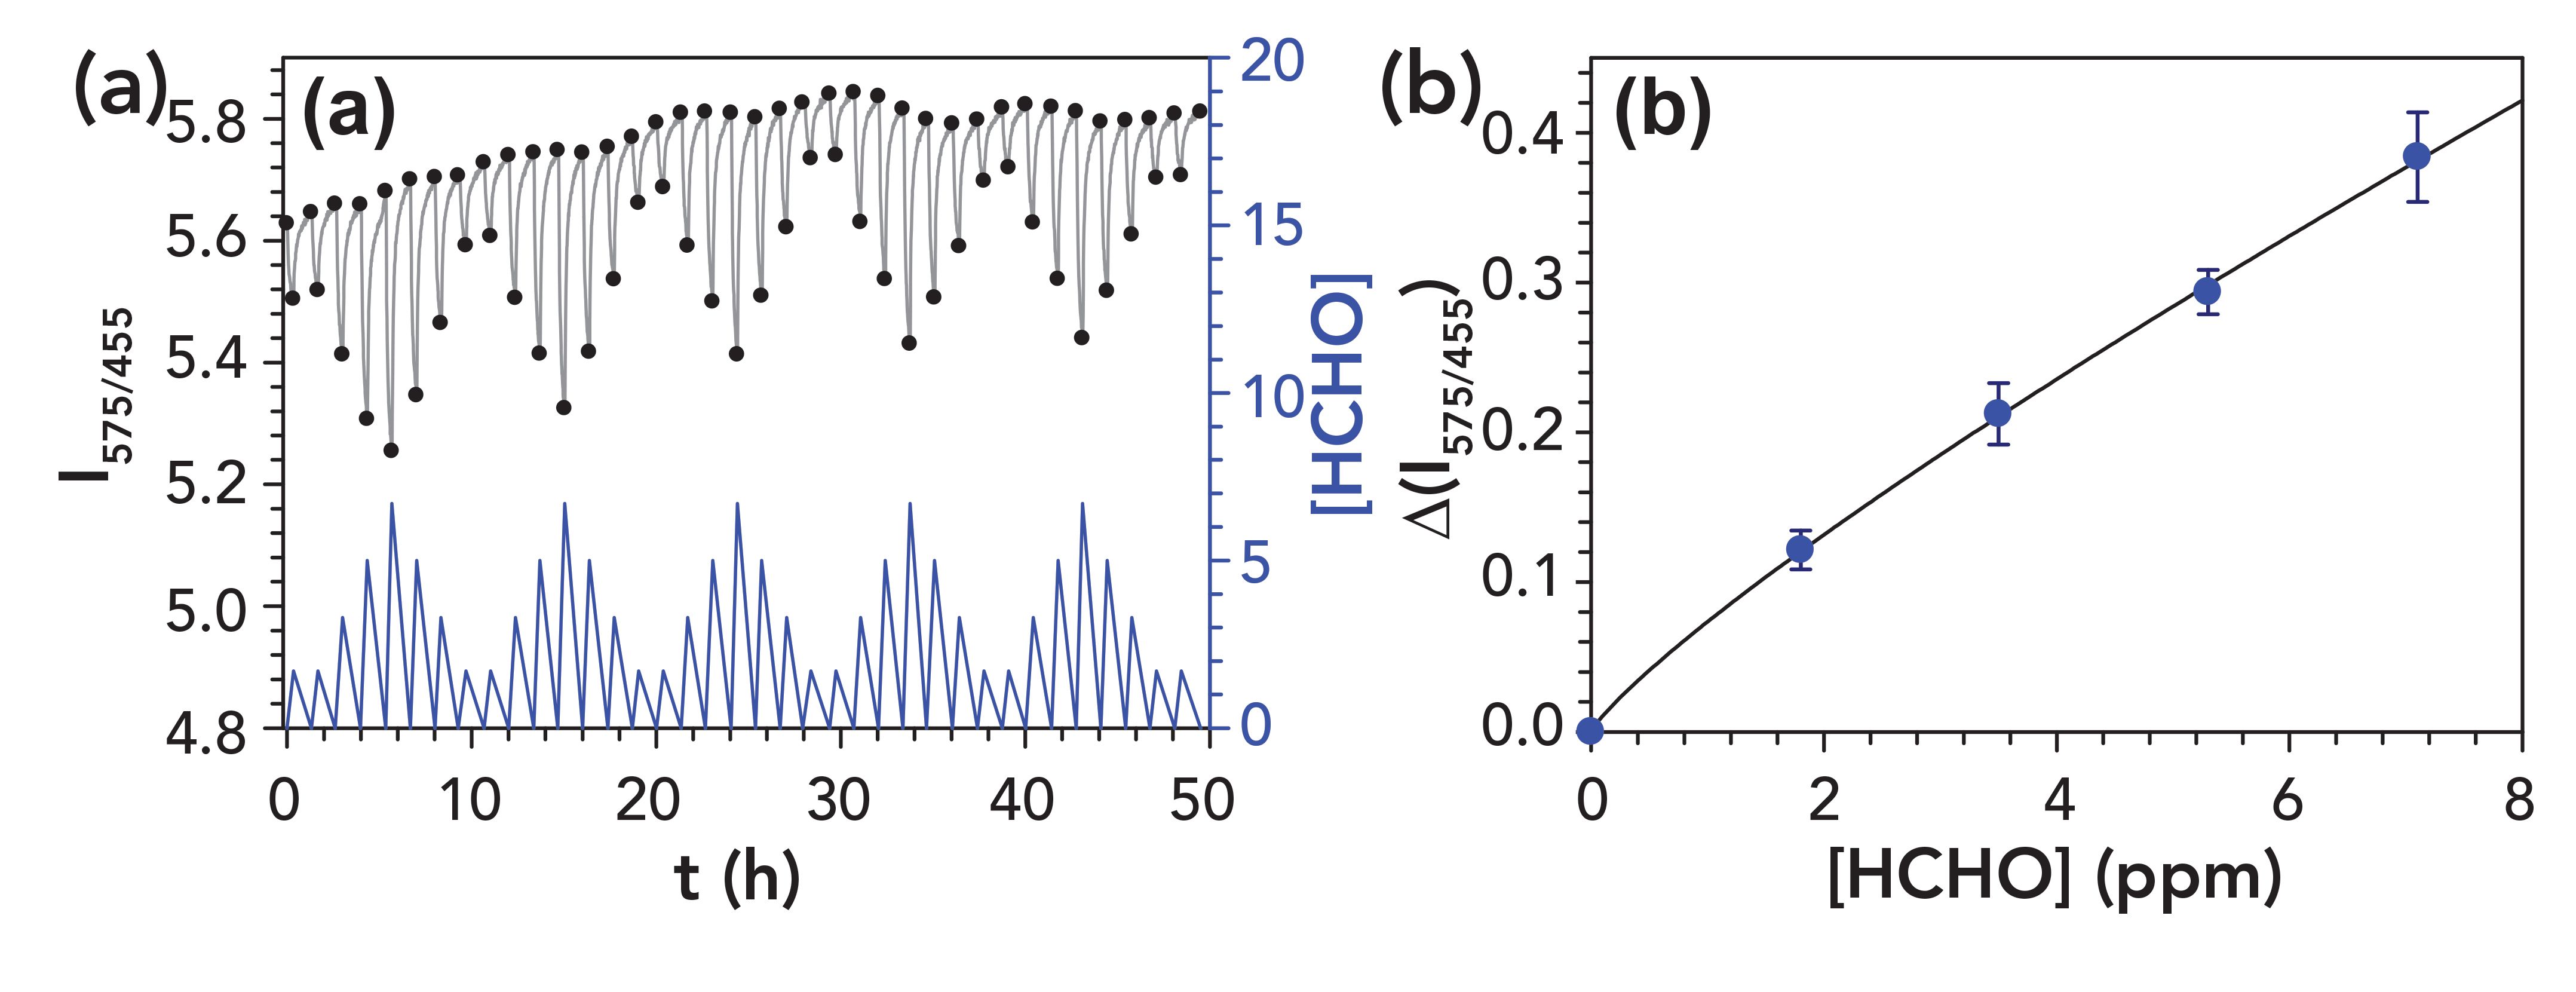
Formaldehyde-sensitive optical fibers were calibrated in the 0 to 6.7 ppm concentration range at 25 ºC and 50% RH (automatic correction for the sample temperature and humidity will be implemented at a later stage). Every 15-min formaldehyde exposure cycle was followed by 1 h regeneration time with a formaldehyde-free air stream using the same flow, temperature, and humidity conditions for signal stability. Figure 3 depicts the response curve and dose-response plot of the sensing optical fibers. The calibration curve shows a nonlinear behavior between the analytical response (y) and the formaldehyde concentration (x) at low formaldehyde levels. Therefore, a power function (y = axb) was used to fit the experimental data points (a and b are the parameters).
Figure 3: Formaldehyde-sensitive optical fiber response function (a) and corresponding dose-response plot (b) for 0 to 6.7 ppm formaldehyde in air in step changes (Table I); confidence intervals ±t sn–1n-1/2 (at 95% confidence level, n = 5). The black dots are the experimental values automatically selected by the optical sensor for building the dose-response plot.

The sensing fiber repeatability was evaluated using a single optical fiber. Each formaldehyde concentration was measured five times and the corresponding relative standard deviations (RSD) of their analytical signals were compared (Table I). Detection limits were determined to be 0.25 mg/m3 (0.20 ppm) for the 15 min sampling time, a value lower than the current short term exposure limit (STEL) established by different regulations (for example, 2 ppm in the United States or 0.6 ppm in the EU). The sensor displayed good measurement repeatability (RSD <10%), but its sensitivity needs to be improved for accurate measurements below the long term exposure limit (for example, 0.3 ppm of EU Directive 2019/983). The good stability and repeatability of the formaldehyde-sensitive optical fiber sensor, obtained during 50 h monitoring periods, demonstrate consistent performance of the sensor over full working shifts to guarantee that the occupational exposure safety limits are never reached.

Conclusions
Evanescent wave absorption spectroscopy is a valuable analytical technique that can provide useful solutions outside of the laboratory, with compact rugged devices and minimum cost of consumables if plastic optical fibers are used. We have demonstrated a fiberoptic evanescent wave absorption sensor for continuous monitoring of airborne formaldehyde. The optoelectronic interrogation unit can be readily adapted to gas phase monitoring of other chemicals. We showed how optical fibers offer the required versatility to develop new analytical strategies in combination with the proper spectroscopic technique. Even though future commercial exploitation would still require further optimization of the sensing fibers to enhance their limit of detection, the developed formaldehyde-sensitive optical fibers clearly have analytical features suitable for routine monitoring of this chemical in industrial environments.
Acknowledgments
This project has been funded by the EU LIFE+ program, grant no. 16/ENV/ES/000232 (LIFESENSSEI). Helpful comments and advice from M. Madroñero (Quirón Prevención) and J. Quinoy (FINSA) are gratefully acknowledged.
References
- R. Kishi, D. Norbäck, and A. Araki (Eds.), Indoor Environmental Quality and Health Risk toward Healthier Environment for All (Springer Nature, Singapore, 2020).
- A. Baldelli, M. Jeronimo, M. Tinney, and K. Bartlett, SN Appl. Sci. 2, 1–13 (2020).
- V. Goletto, G. Mialon, T. Faivre, Y. Wang, I. Lesieur, N. Petigny, and S.S. Vijapurapu, Chemosensors 8, 8 (2020).
- I. Urriza-Arsuaga, M. Bedoya, and G. Orellana, Sens. Actuators B Chem. 292, 210–216 (2019).
- I. Urriza-Arsuaga, M. Bedoya, and G. Orellana, Anal. Chem. 91, 2231–2238 (2019).
- I. Urriza-Arsuaga, M. Bedoya, and G. Orellana, Sensors Actuators, B: Chem. 279, 458–465 (2019).
- S.K. Shukla, C.S. Kushwaha, T. Guner, and M.M. Demir, Opt. Laser Technol. 115, 404–432 (2019).
- B. Srinivasan and D. Venkitesh, in Optical Fiber Sensors: Advanced Techniques & Applications, G. Rajan, Ed. (CRC Press Taylor & Francis, New York, New York, 2015), Chapter 12.
- W. Ecke, K. Chen, and J. Leng, Sensors 2012, 1 (2012).
- Y. Jin and A.M. Granville, J. Biosens. Bioelectron. 7, 1–11 (2016).
- A.K. Sharma, J. Gupta, and I. Sharma, Optik. 183, 1008–1025 (2019).
- X. Lu, P.J. Thomas, J.O. Hellevang, Sensors 19, 2876 (2019).
- G. Orellana, M.C. Moreno, J. López, and R. Chamorro, M.A. Alba, Span. Pat. ES2424772.
M. Mar Darder is a PhD candidate at the Complutense University of Madrid (UCM) Chemical Optosensors & Applied Photochemistry Group (GSOLFA) in Madrid, Spain. Luis A. Serrano is a postdoctoral fellow with UCM’s GSOLFA. María C. Moreno-Bondi is a full professor in the Analytical Chemistry Department at UCM. Miguel A. Alba is a senior occupational hygienist at Quirón Prevención SLU in Barcelona, Spain. Guillermo Orellanais a full professor and the GSOLFA group leader at UCM. Direct correspondence to: mangel_alba@quironprevencion.com or gorellana@ucm.es.

Microplastics Widespread on Catalan Beaches, Study Finds
March 28th 2025In a recent study published in Marine Pollution Bulletin, a team of researchers from several Spain and Portugal universities and institutions (Rovira i Virgili University, Universitat de Barcelona, University of Porto, and Institut d'Investigació Sanitaria Pere Virgili (IISPV) assessed microplastic (MP) contamination along the Mediterranean coastline.