Forensic Application of Near-Infrared Spectroscopy: Aging of Bloodstains
Spectroscopy
The authors discuss the use of near-infrared spectroscopy to determine the age of a bloodstain, which can be critical in helping establish when a crime was committed.

The age of a bloodstain can be used to establish the time when a crime was committed. As blood ages, deoxyhemoglobin (HbO2) is converted into methemoglobin (MetHb), which is evident by the color change from red to brown. Human blood from vein and capillary vessels was used in this investigation. Samples were prepared by placing blood on substrates such as gauze and glass. Near-infrared (NIR) spectra of the samples were measured periodically at ambient conditions for one month. Changes in the spectra can be interpreted in terms of chemical changes in the samples. Loss of water plays a significant role in establishing the initial changes in the spectra. After the first hour, a new, broad band appears between 1460 and 1860 nm and grows as a function of aging. This band, due to the formation of methemoglobin and binding of water, continues to increase for ~21 days and can be used to predict the age of a stain. Standard error of prediction for composite data on bloodstains from three sources was 2.3 h over aging periods up to 590 h.
Determining the age of a bloodstain is of great interest in forensic science because the age could enable crime scene investigators to deduce the timeframe in which a crime was committed. The overall goal of our research on bloodstains is to explore the feasibility of developing a portable optical instrument that will be capable of predicting the age of stains found at crime scenes. This hypothetical handheld instrument will measure optical signals (spectra) reflected from a stain and use previously determined calibration data to predict its age. Before the concept of this instrument can be implemented, it is necessary to determine optical properties of blood, which might be used for predicting the age.
The problem of estimating the age of bloodstains has been paramount since the early years of modern forensic methods (1,2). Currently, either a sample of a stain or both the stain and its substrate are sent to a laboratory for analysis. The most widely used analytical method is high performance liquid chromatography (HPLC), which focuses on the relative height of a peak due to a degradation product (3–5). Degradation of RNA has been used successfully to estimate age on the order of years (6); however, this is a time-consuming effort and not adaptable to field applications. Other laboratory instruments such as atomic force microscopy (AFM) (7), oxygen electrodes for measuring hemoglobin (8), and electron paramagnetic resonance (EPR) (9) have been used successfully in the laboratory. However, a portable, field-adaptable instrument for the rapid determination of the age of bloodstains does not exist.
Blood represents about 8% of total body weight and has an average volume of 5 L in women and 5.5 L in men (10,11). It is a transport medium for dissolved or suspended material and travels from the heart to tissues and cells of the body through the distributed blood vessels. Erythrocytes, or red blood cells, are characterized by their primary function of O2 transport in the blood. Red blood cells are fully packed with hemoglobin, which is an iron-containing molecule that can bind with O2 loosely and reversibly (10,11). Because O2 is poorly soluble in blood, hemoglobin is indispensable for O2 transport. Hemoglobin consists of four highly folded polypeptide chains (the globin portion) and four iron-containing heme groups (protoporphryn molecules), each of which is bound to one of the polypeptides. Each of the four iron atoms found in heme can combine reversibly with one molecule of O2; therefore, each hemoglobin molecule can pick up four O2 molecules. Oxygen binds loosely with one of the six coordination bonds of the iron atoms. Hemoglobin is also a pigment that is naturally colored and because of its iron content, it appears reddish when combined with O2. Red blood cells are about 8 μm in diameter, and there are a million hemoglobin molecules in one erythrocyte.
As blood ages, deoxyhemoglobin is converted into methemoglobin, which is evident by the color change from red to brown (10,11). Deoxyhemoglobin is actually a deoxygenated heme group that lacks O2 binding to its iron atom. Methemoglobin is a brownish-red form of hemoglobin that occurs when hemoglobin is oxidized during decomposition. The oxidation of Fe2+ to Fe3+ creates methemoglobin. Oxidized iron lacks an electron to bind oxygen effectively; thus, methemoglobin accumulation can impair tissue oxygenation (11). The Fe3+ in methemoglobin binds water rather than oxygen (12,13).
In trying to develop an optical instrument for determining the age of bloodstains, we explored the potential of using the visible, near-infrared (NIR), and mid-infrared (IR) optical regions. There are obvious visible spectral changes as blood ages; the other components of blood such as water and proteins do not have specific bands in the visible region and there is a lack of bands for referencing the magnitude of the color change. The mid-IR region does have very characteristic bands due to proteins and water; however, it was found that the relative spectral changes depended upon the type of blood. For example, blood from veins demonstrated well-defined changes as a function of time, whereas blood from capillaries exhibited very little change other than the loss of water with time. In the NIR region, similar spectral changes were observed for vein and capillary blood samples. The investigations on hemoglobin in the NIR region of 1100–2500 nm has been very limited (14,15). Most investigations of hemoglobin focused on the visible and short-wavelength NIR with the goal of developing oximeters for noninvasive monitor of oxygen transmittal by hemoglobin (16–19).
Blood samples from human vein and capillary vessels were placed on different substrates and monitored in the NIR region over a one-month period. The composition of blood varies between veins and capillaries. The dissimilarities depend upon how a vessel stores and transports blood through the body as well as the distribution of cells and plasma in the vessels. The components of blood that are suitable for determining blood degradation as a function of time must be understood, and their effects on optical properties verified.
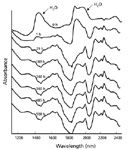
Figure 1: Representative NIR spectra of vein blood on gauze aged over a period of one month.
Materials and Methods
Human blood from vein and capillary vessels was used for this investigation. The blood samples originated from people of various age groups and both genders. Acquired blood samples were prepared and measured by a person trained and certified by OSHA for blood-borne pathogens.
The bloodstain samples were prepared by depositing approximately six drops of blood on solid or porous substrates. A watch glass was used as a solid substrate and the strip of gauze placed on a glass microscope slide was used as a porous substrate. NIR spectra of 3-mm diameter samples were measured periodically at ambient conditions over a period of one month. The samples were stored at room temperature of 20 °C between measurements. An NIRSystems (FOSS, Inc., Laurel, Maryland) Model 5000 Rapid Content Analyzer was used to measure the diffuse reflection spectra of the samples. A total of 64 scans was measured over the spectral range of 1100–2500 nm. These scans were averaged to provide the final spectrum. Reference spectra of each of the substrates were measured through the same aperture with a TiO2 diffusion plate placed behind the substrate. Spectra of lyophilized crystalline hemoglobin (Sigma-Aldrich, St. Louis, Missouri) were measured as a reference. This sample was reported to contain ~70% methemoglobin.
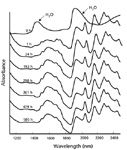
Figure 2: Representative NIR spectra of capillary blood on gauze aged over a period of one month.
Results and Discussion
Samples of vein and capillary blood from four volunteers were aged over a period of one month. Typical spectra of blood aging on a gauze substrate are shown in Figures 1 and 2, whereas blood on a glass substrate is shown in Figures 3 and 4. As is immediately obvious from the four figures, water is the major contributor to the spectra before aging. The experiments were performed under ambient conditions and the humidity was not controlled. In the case of the blood samples on glass, the bands due to water disappeared after 1 h of aging. Spectra of the blood on the gauze substrate exhibited evidence of water after 1 h. This is most evident in Figure 1, where the H2O bands at ~1400 and ~1900 nm are still present in the 1-h spectrum. The band at ~1400 nm disappears into the background in most of the spectra shown in the figures. However, the band at 1900 nm exhibits some variation as the samples age. For example, in Figure 1 the band at 1900 nm is rather pronounced in the 1-h spectra, appears only as a shoulder at 25 h, but reappears at 189 h. The water bands in spectra of samples on the glass substrate disappeared rather quickly; however, the band at 1900 nm continued to vary slightly during the entire study.
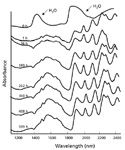
Figure 3: Representative NIR spectra of vein blood aged on glass aged over a period of one month.
The loss of water plays a significant role in establishing the initial change in the spectra. Bands due to water dominate the spectrum of fresh blood during the first hour of aging. The band at ~1400 nm is not overlapped by any other bands during the initial aging period. The area of this band for the region extending from 1300 to 1600 nm was determined and plotted versus time for the first hour, as shown for vein blood in Figure 5. The sample used to generate these data was not removed from the spectrometer during the first hour. The band area decreases linearly during the time period. The eight data points in the figure were fitted to a linear equation by least-squares regression, and the model was evaluated using the cross-validation, leave-one-out method. The standard error of prediction over the timeframe of 60 min was 2.7 min. The difficulty is that water bands dominate the spectrum during the first hour of aging and there is a lack of reference bands due to other components. Thus, it is possible to predict time of aging from the relative water concentration for a sample that is not removed from the spectrometer, but for samples that have been removed or for other samples, there is a lack of a reference frame for comparison.
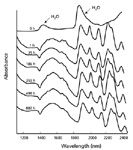
Figure 4: Representative NIR spectra of capillary blood aged on glass over one month.
After the evaporation of water during the first hour, a consistent series of bands due to proteins appear between 1800 and 2500 nm. In addition, a new, broad band extending from 1460 to 1860 nm was observed to form and increase with time. The area of this new band for the aging of vein blood versus time is shown in Figure 6. The band areas were relative to the height of the band at 2170 nm. For plotting, the maximum area of this band was set at 1.0. The area of the band increased rapidly during the first 50 h of aging and then gradually increased up to ~300 h, asymptotically approaching a maximum of 1.0 at ~500 h.
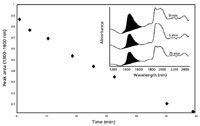
Figure 5: NIR spectra of vein blood on gauze: Plot of the peak area (1300â1600 nm) of the water band versus time (min) for a sample aged over a period of 1 h, and some representative spectra showing the disappearance of the water band.
Plots of the areas of the 1460–1860 nm band versus the log of time for the aging of three bloodstains are shown in Figure 7. The band areas for each bloodstain were fitted with a least squares regression. A cross-validation, leave-one-out method was used to determine standard area of predictions, which are given in Table I. Also shown in Table I is the type of blood, sex of the donor, number of spectra measured, and the time range for the aging. The three individual sets were combined into one large set and cross-validation was used to determine the standard error of prediction. This latter composite set had a standard error of prediction of 2.3 h over a total time of 590 h.
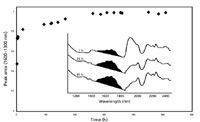
Figure 6: NIR spectra of vein blood on gauze: Plot of the peak area (1460â1860 nm) versus time (h) for the sample aged over one month, and representative sample spectra of vein blood from 1 to 97 h of age.
As mentioned earlier, as blood dries and ages, the bright red color changes to a darkish brown. The color change is known to be due to the conversion or hemoglobin to methemoglobin. The Fe+2 in hemoglobin binds oxygen and transfers it throughout the body. As blood ages, Fe+2 is converted to Fe+3 in methemoglobin. To determine the origin of the broad band at 1460–1860 nm as a function of aging, we measured the spectrum of lyophilized crystalline hemoglobin, which contained ~70% methemoglobin. The spectra of this crystalline sample are compared with the spectrum of vein blood aged for 262 h on glass in Figure 8. The 1460–1860 nm band is evident in the spectrum of the crystalline sample. The crystalline hemoglobin had a reddish color. Water was added to the crystalline sample and the sample was allowed to dry, after which, the color changed from a reddish color to brown. The spectrum of this brown sample is shown in the bottom of Figure 8. The 1460–1860 nm band increased in magnitude and the other bands characteristic of bloodstains in the 1800–2500 nm region appeared. The iron in methemoglobin lacks the electron necessary to bind oxygen, but it is known to bind water (12,13). Thus, the broad band at 1460–1860 nm is undoubtedly due to the formation of methemoglobin with subsequent binding of water during aging of bloodstains.
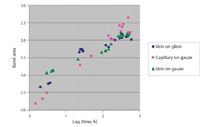
Figure 7: Plot of the peak area (1460â1860 nm) versus log of time (h) for three different bloodstains aged over one month.
Conclusions
Development of a scientifically validated forensic method to determine the age of bloodstains from a crime scene could make a significant contribution to helping crime scene investigators determine the time of a specific crime. It has been demonstrated that a bloodstain aged over a period of one month at ambient temperatures undergoes spectral changes, which can be used to predict the age of a stain. Loss of water is the major contributor to the change during the first hour of aging; however, the lack of reference bands at this stage reduces the quantitative value of the data. After 1 h, characteristic bands due to proteins appear in the 1800–2500 nm region, and a new band appears in the 1460–1860 nm, which can be used for predicting the age of a stain. The standard error of prediction for a composite sample from three sources was 2.3 over a total aging period of 590 h. These results support the potential for using a miniature NIR spectrometer for determining the age of bloodstains.
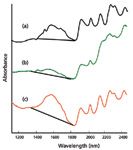
Figure 8: NIR spectra of (a) an aged blood sample (vein blood 262 h on glass), (b) lyophilized crystalline hemoglobin, and (c) lyophilized crystalline hemoglobin after wetting and drying.
Acknowledgments
We would like to thank the Forensic Science Partnership, University of Rhode Island, and the Applications Laboratory-Digilab (Randolph, Massachusetts). Marc Lamontagne gratefully acknowledges the sabbatical support from Department of Physical Sciences, Rhode Island College.

Table I. Standard error of prediction (SEP) for three bloodstains and a composite fit of all samples
References
(1) S.H. James, J.J. Nordby, Forensic science: an introduction to scientific and investigative techniques. 2nd ed. Boca Raton: CRC Press; (2005).
(2) Schwarzacher, Am. J. Police Sci.1, 374–380 (1930).
(3) J. Andrasko, J. Forensic Sci. 42 (4), 601–607 (1997).
(4) H. Inoue, F. Takabe, M. Iwasa, Y. Maeno, and Y. Seko, Forensic Sci. Intl. 57, 17–27 (1992).
(5) H. Inoue, F. Takabe, M. Iwasa, and Y. Maeno, Intl. J. Legal Med. 104, 127–131 (1991).
(6) M. Bauer, Forensic Sci. Intl. 138, 94–103 (2003).
(7) A. Strasser, G. Zink, P. Kada, O. Hinterdorfer, W. Peschel, A. Heckl, S. Nerlich, and S. Thalhammer, Forensic Sci. Intl. 170, 8–14 (2007).
(8) T. Matsuoka, Biol. Pharm. Bull. 18(8), 1031–1035 (1995).
(9) Y. Fujita, K. Tsuchiya, S. Abe, Y. Takiguchi, K. Kubo, and H. Sakurai, Forensic Sci. Intl. 152, 39–43 (1997).
(10) L. Sherwood, Human Physiology From Cells To Systems (Wadsworth Publishing Company, Belmont, California, 1997), pp. 266–267, 323–349, 353–363.
(11) A.C. Guyton, Textbook of Medical Physiology (Saunders, Philadelphia, Pennsylvania, 1991), pp. 356–364.
(12) G.B. Ogunmola, W. Kauzmann, and A. Zipp, Proc. Natl. Acad. Sci. 73, 4271–4273 (1976).
(13) N. Ramadas and J.M. Rifkind, Biophys. J. 76, 1976–1811 (1999).
(15) J.T. Kuenstner, K.H. Norris, and W.F. McCarthy, Appl. Spectrosc. 48, 484–488 (1994).
(16) J. Lee, N. El-Abaddi, A. Duke, A.E. Cerussi, M. Brenner, and B.J. Tromberg, J. Appl. Physiol. 100, 615–622, 2006.
(17) M. Meinke, I. Gersonde, M. Friebel, J. Helfmann, and G. Müller, Appl. Spectrosc. 59, 826–835 (2005).
(18) O. Burkhard and W.K. Barnikol, J. Appl. Physiol. 52, 124–130 (1982).
(19) J. Huang, M. Leone, A. Boffi, J.M. Friedman, and E. Chia, Biophys. J. 70 (6), 2924–2929 (1996).
Edita Botonjic-Sehic is with the Department of Chemistry, University of Rhode Island, Kingston, Rhode Island, and Barr Pharmaceuticals, Inc., Pomona, New York. Chris W. Brown is with the Department of Chemistry, University of Rhode Island, Kingston, Rhode Island. Mark Lamontagne is with the Department of Physical Sciences, Rhode Island College, Providence, Rhode Island. Mary Tsaparikos is with the Department of Microbiology and Biochemistry, University of Rhode Island, Kingston, Rhode Island.
AI Shakes Up Spectroscopy as New Tools Reveal the Secret Life of Molecules
April 14th 2025A leading-edge review led by researchers at Oak Ridge National Laboratory and MIT explores how artificial intelligence is revolutionizing the study of molecular vibrations and phonon dynamics. From infrared and Raman spectroscopy to neutron and X-ray scattering, AI is transforming how scientists interpret vibrational spectra and predict material behaviors.
Real-Time Battery Health Tracking Using Fiber-Optic Sensors
April 9th 2025A new study by researchers from Palo Alto Research Center (PARC, a Xerox Company) and LG Chem Power presents a novel method for real-time battery monitoring using embedded fiber-optic sensors. This approach enhances state-of-charge (SOC) and state-of-health (SOH) estimations, potentially improving the efficiency and lifespan of lithium-ion batteries in electric vehicles (xEVs).
New Study Provides Insights into Chiral Smectic Phases
March 31st 2025Researchers from the Institute of Nuclear Physics Polish Academy of Sciences have unveiled new insights into the molecular arrangement of the 7HH6 compound’s smectic phases using X-ray diffraction (XRD) and infrared (IR) spectroscopy.