FT-IR Microscopic Analysis of Polymer Laminate Samples Including Transmission and ATR Spectroscopy
Special Issues
Polymer laminates typically make complex samples for infrared analysis, comprising multiple layers with defined thicknesses, in some cases less than 10 µm. When measuring extremely narrow laminate layers, the use of attenuated total reflectance (ATR) may provide improved spectra of the laminate cross-section, because ATR microscope objectives offer a greater spatial resolution than transmission due to additional magnification. This paper details the preparation of polymer laminate sample cross-sections and the collection of transmission and ATR spectra of various layers. Further analysis of the laminate spectra will also be explored utilizing a multivariate curve resolution (MCR) algorithm. An example laminate sample is examined utilizing all the tools available on a standard FT-IR microscope.
Polymer laminates typically make complex samples for infrared (IR) analysis, comprising multiple layers with defined thicknesses, in some cases <10 µm. When measuring extremely narrow laminate layers, the use of attenuated total reflectance (ATR) may provide improved spectra of the laminate cross-section, because ATR microscope objectives offer a greater spatial resolution than transmission because of additional magnification. This article details the preparation of polymer laminate sample cross-sections and the collection of transmission and ATR spectra of various layers. Further analysis of the laminate spectra is also explored using a multivariate curve resolution (MCR) algorithm. An example laminate sample is examined using all the tools available on a standard Fourier transform infrared (FT-IR) microscope.
Fourier transform infrared (FT-IR) microscope systems allow the analysis of extremely small samples (<250 µm) using IR spectroscopy. Mapping experiments made with a single-element detector can provide an IR image of a larger area of a sample with a defined spatial resolution. There are numerous applications for FT-IR microscopes and imaging systems, including polymer analysis, pharmaceutical and materials analysis, forensic investigations, semiconductors, biochemistry, and chemical analysis, among others. For almost any sample that can be scanned with a traditional IR method to obtain macro data from the sample, FT-IR microscopy can be used to collect the same spectra from a much smaller, defined area of the sample. FT-IR microscope systems can provide a simple spectrum of a very small contaminant in a larger matrix or detailed information about the distribution of the chemical constituents or other types of spatial information-that is, the variation and distribution of layers in a polymer laminate.
In the analysis of polymer laminates, information concerning the identity and spatial distribution of the various layers is of critical importance for verifying the production quality of the laminate or inclusion of contaminants from the manufacturing process, or providing information about a competitive product. Collection of a lattice mapping file using a very small aperture can provide information about the laminate layers and their spatial arrangement. Polymer laminate samples include unique characteristics and are found in a wide array of applications, most often for food packaging. With the incorporation of a number of different polymer materials, laminates can include polymer layers favorable for printing, layers that provide oxygen or moisture barriers, as well as polymers that are ideal for heat sealing. Some laminates can be quite simple, consisting of two or three materials, while others can be a lot more complex, comprising multiple layers of various thicknesses. In some cases, the “tie layers” used to bond dissimilar polymer materials can be quite thin, at or below the spatial resolution capabilities of an IR transmission microscope (<10 µm). Thus, polymer laminates present a challenging analysis problem, often requiring advanced methods to properly measure and analyze the laminate components.
To provide visual images that are easily understood by nonusers, the IR spectral image data can be displayed as false color image maps based on peak intensity, calculations of peak height–ratio data, or peak area–ratio data. Additional calculations can also provide images based on peak shift or full-width at half maximum (FWHM) values. Image data from these various calculations can also be displayed as contour maps, or three-dimensional (3D) images to provide image contrast for information purposes. These various options are all available in the Jasco microscope data processing software. This analysis software displays the automatically collected video images as well as individual spectra, image maps, and calculated data for easy interpretation of the data. If data are collected from multiple sample sites, the individual spectra can be selected with the corresponding video images for each sample area (1).
MCR Analysis
A sample with a multicomponent matrix can be difficult to analyze and provide a color image with spatial distinction between components. There are numerous chemometrics processing algorithms that can be applied to data of this type, including partial least squares (PLS) regression or principal components analysis (PCA). A multivariate curve resolution (MCR) program can be used to process an array of spectral data and provide an analysis and spectral separation without detailed knowledge of the components and their concentrations. Chemical components are separated by distinct spectral variations and a distribution map can be developed based on this component segregation. Standard chemometric methods that provide this capability are available, but they often require a large amount of user interaction. The MCR method can analyze the array of spectral data unattended, providing the completed results for review and can, where necessary, be revised for the final selection of predicted components.
Experimental
An IRT-5200 FT-IR microscope system with an XYZ auto-stage, 16x transmission cassegrain, a ClearView ZnS attenuated total reflectance (ATR) objective and single-element mercury cadmium telluride (MCT) detector (all from Jasco) was used to collect transmission and ATR spectra from a multilayer polymer laminate sample (obtained from packaging material used for meat products). The microscope is coupled with an FT/IR-4600 FT-IR spectrometer (Jasco), an instrument that provides a high signal-to-noise ratio, spectral resolution to 0.7 cm-1 and a spectral range of 7800–350 cm-1.
To measure the transmission spectra of the multilayer laminate sample, a cross-section of the layered sample is required, with a sample thickness of approximately 20–40 µm. Many different methods can be used to obtain a cross-section of a laminate-various devices have been used for the sample preparation, including microtomes and other slicing tools, many of which require considerable time and patience to use. The laminate sample in this paper was cross-sectioned using a SliceMaster slicing tool (Jasco), a small cutting device that can be placed on the stage of a low power optical microscope so that the sample preparation can be observed during the cross-section cutting process. The sample is placed into a sample clamping device, with the laminate layers at 90° to the cutting device, a simple sharp blade. The sample movement under the cutting blade can be finely adjusted by the user to obtain the required thickness of the cross-section. Sample preparation can be completed within minutes and the slicing tool can be used to prepare samples of various thicknesses. Several cross-section samples were prepared using the slicing tool and samples with suitable thicknesses were selected and examined with the FT-IR microscope using both transmission and ATR measurement.
The laminate sample was placed onto a BaF2 window and a lattice map was specified across the breadth of the laminate sample, ensuring collection of the transmission spectra of all the layers in the laminate cross-section. The transmission spectra of the laminate cross-section were measured using a 10 x 50 µm aperture, with 8 cm-1 resolution and accumulation of 64 background and sample scans for each spectrum using a mid-band MCT detector. Spectra of the laminate layers were also measured with the ClearView ZnS ATR objective using the IQ Mapping function of the IRT-5200 microscope.
For a standard ATR measurement, a sample is raised using the sample stage to make contact with the ATR objective. A pressure stage on the microscope stage provides a monitor of the pressure applied to the sample against the ATR objective, ensuring that the ATR crystal in the objective is not damaged by excessive pressure. Conventional ATR objectives require that the center of the ATR crystal area be in contact with the sample position to be measured, and a microscope aperture is used to mask only the center portion of the total ATR contact area to select the measurement area of the sample. While this works well for many types of samples, in the case of a multicomponent sample, this data collection method can result in a spectrum that contains contributions from all of the components in the sample matrix. Alternatively, users can collect multiple ATR spectra, moving the sample to “center” the component of interest to the ATR objective element, but this approach can still result in spectra with contributions from the other components in the matrix.
The mapping feature used in the IRT-5200 microscope uses a movable mirror in the optical path of the microscope system to allow spectral measurement from anywhere within the optical focal plane provided by the standard cassegrain objective or, in the case of an ATR objective, anywhere within the primary contact area of the ATR crystal. Using this dynamic measurement system, spectra can be obtained from either single or multiple points on the sample, or a line or grid map of the sample, all without moving the ATR objective or the sample stage. By optimizing the microscope aperture together with the mapping feature, the entire ATR objective–sample contact area can be used to collect individual spectra at multiple points on the sample without lowering, repositioning of the sample and then obtaining the ATR objective contact. The biggest advantage of the mapping feature is saving time, as well as not having to obtain multiple contacts with the sample area. This mapping system can provide data specific to the different components in the sample matrix in a single contact with the sample. The spectral matrix obtained from this ATR mapping can be used to provide spectra of the individual components without further data processing.
A suitable cross-section of the laminate was selected from the various samples prepared using the slicing tool and secured with tape onto a glass microscope slide, to prevent movement during measurement. A lattice map of the laminate sample cross-section was measured using a 5 x 5 µm aperture to obtain ATR spectra of the individual laminate layers in contact with the ATR objective. Figure 1 provides video photographs of the laminate sample before and after the ATR objective contact with the sample.
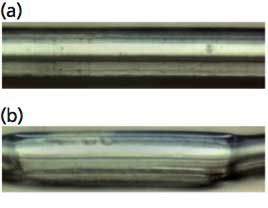
Figure 1: Video micrographs of laminate sample collected (a) before the ATR contact and (b) after ATR contact, demonstrating the area of the sample compressed by the ATR element in the objective.
Results and Discussion
Reviewing the transmission data from the lattice mapping experiment, only five different polymer layers were identified within the laminate, based on functional group absorption peaks selected from the individual spectra, including the polyethylene, polyethylene terephthalate, ethylene-vinyl acetate, poly(ethylene-co-acrylic acid), and hydrolyzed polyethylene layers (Figure 2). However, when the lattice transmission data were analyzed using the MCR software, six different polymer layers were identified, with distinct spectral differences among the spectra, adding the polyethylene vinylacetate copolymer layer just before the polyethylene terephthalate (Figure 2). The identification of the polymer compounds was verified by a spectral database search of polymer library spectra using the Sadtler Know-It-All search package (Bio-Rad).
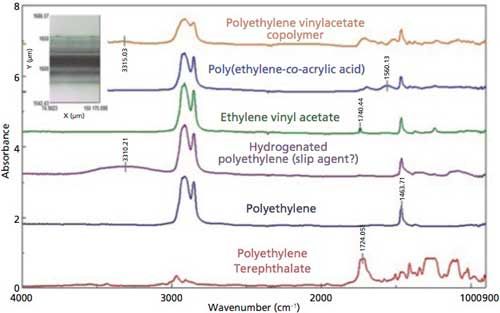
Figure 2: Transmission spectra of polymer laminate layers.
The 3D spectra display outlined in Figure 3 provides a visual confirmation of the presence of the six different layers; the functional groups can be easily identified in the 3D display. Using the graphic display in the analysis software package, the 3D model in Figure 3 can be rotated, expanded, and the axes modified to provide a more extensive visual analysis of the data recorded by the microscope system, confirming the MCR results.
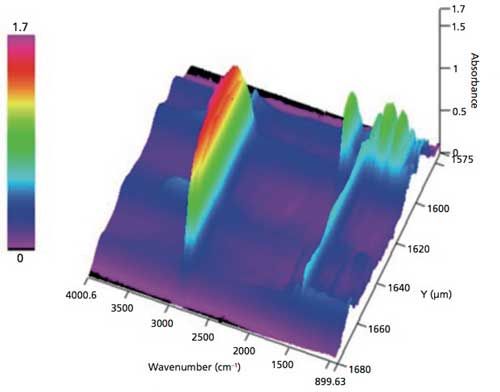
Figure 3: 3D display of transmission spectra collected on the y-axis (breadth) of the polymer laminate cross-section, displaying spectra of the multilayer components in the laminate.
Based on this information, the absorbance increase and decrease for the functional group absorptions can be examined and overlaid to provide a trace of the laminate peaks identified in each layer, as displayed in Figure 4. This figure allows a calculation of the layer thickness based on the intensity changes recorded for the functional group vibrational modes associated with the laminate polymer peaks in the sample. Although the C-H bending mode at 1464 cm-1 is present in a majority of the polymer layers, there are other functional group peaks that can be identified, providing additional information for the layer thicknesses.
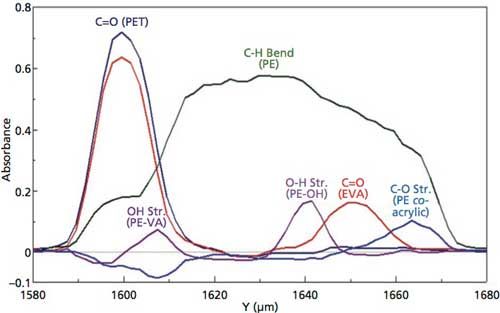
Figure 4: Spatial distribution of laminate layers based on peaks from transmission spectra.
The color images for the various polymer layers, which were created using the MCR results and the specific absorption peaks found in the different polymers, are displayed in Figure 5. The false-color maps displayed in Figure 5 present a visual chemical and spatial distribution for rapidly visualizing the features of interest within the images. These individual color maps can be overlaid to provide a comprehensive, detailed image of the chemical and spatial distribution of the layers as presented in Figure 6, in which the individual color-coded layers are identified by the polymer compounds and their unique absorption peaks.
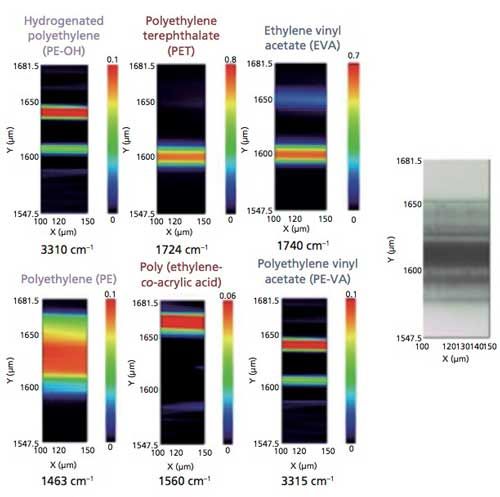
Figure 5: False-color maps of laminate transmission spectra, based on labeled peaks displayed for transmission spectra.
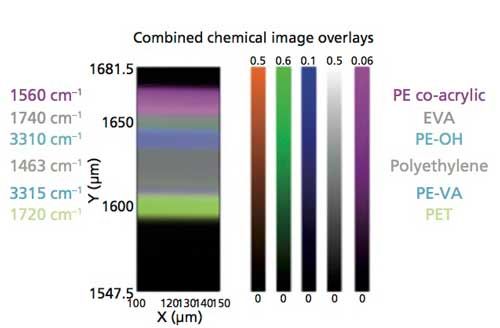
Figure 6: Chemical image overlay derived from individual color maps (Figure 5) of transmission spectra (Figure 2).
Figure 7 illustrates the ATR spectra selected from the lattice mapping of the laminate. The same component layers identified in the transmission spectra are confirmed by library search of the ATR spectra. Individual false-color maps of the laminate components can be developed based on the ATR spectra, as well as the other types of visual displays, similar to the transmission data. A combined color overlay map of the chemical components, displayed in Figure 8, was developed from the peaks labeled in the ATR spectra (Figure 7). As can be observed in Figure 1, the ATR objective does compress the laminate polymer during contact, so layer thickness cannot be properly calculated from the spatial information provided by the lattice mapping file.
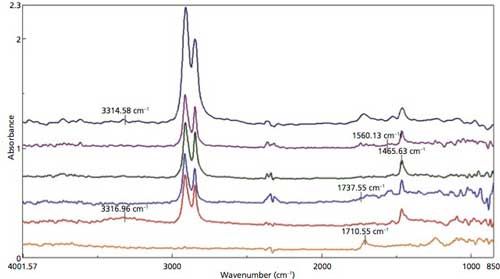
Figure 7: ATR spectra selected from the lattice map.
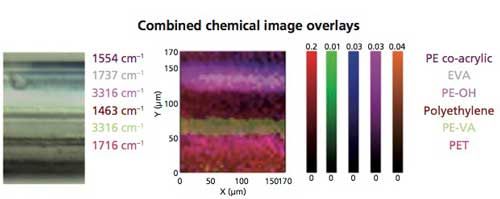
Figure 8: Chemical image overlay derived from the ATR spectra of the laminate polymers (Figure 7).
Conclusions
A multilayer polymer laminate from a food packaging sample was cross-sectioned using a slicing tool to obtain transmission and ATR spectra using an FT-IR microscope system. In addition, the mapping capability with the ATR objective provides a simpler method for analysis of multicomponent samples. Color image maps and overlays were derived from the transmission and ATR spectra collected from the laminate cross-section samples. Image overlays of the transmission and ATR data provide visual pictures that readily identified the individual components in the laminate. The transmission information can also be used to provide trace data that can be used to outline the thickness of the individual layers, which provides another picture of the interaction of the various laminate layers. The ATR data can be used to provide similar views of the laminate layers, but no extra polymer layers were observed, even with the greater spatial resolution obtained when using the ATR objective.
Reference
- R. Larsen, K. Akao, and J. Koshoubu, “An Upgradeable FT-IR Accessory,” American Laboratory41, 14–17 (2009).
Richard A. Larsen retired from Jasco in July 2016. Ken-ichi Akao, Jun Koshoubu, Kohei Tamura, and Hiroshi Sugiyama are with Jasco Corporation in Tokyo, Japan. Direct correspondence to: sales@jascoinc.com

AI Shakes Up Spectroscopy as New Tools Reveal the Secret Life of Molecules
April 14th 2025A leading-edge review led by researchers at Oak Ridge National Laboratory and MIT explores how artificial intelligence is revolutionizing the study of molecular vibrations and phonon dynamics. From infrared and Raman spectroscopy to neutron and X-ray scattering, AI is transforming how scientists interpret vibrational spectra and predict material behaviors.
Real-Time Battery Health Tracking Using Fiber-Optic Sensors
April 9th 2025A new study by researchers from Palo Alto Research Center (PARC, a Xerox Company) and LG Chem Power presents a novel method for real-time battery monitoring using embedded fiber-optic sensors. This approach enhances state-of-charge (SOC) and state-of-health (SOH) estimations, potentially improving the efficiency and lifespan of lithium-ion batteries in electric vehicles (xEVs).
New Study Provides Insights into Chiral Smectic Phases
March 31st 2025Researchers from the Institute of Nuclear Physics Polish Academy of Sciences have unveiled new insights into the molecular arrangement of the 7HH6 compound’s smectic phases using X-ray diffraction (XRD) and infrared (IR) spectroscopy.