High-Throughput Analysis of Pharmaceutical Tablet Content Uniformity by Near-Infrared Chemical Imaging
November 2006. The authors demonstrate the use of NIR-CI for simultaneous measurement of content uniformity for multiple tablets and discuss some advantages of this approach.

The feasibility of measuring the content uniformity of multiple drug tablets simultaneously using a near-infrared chemical imaging (NIR-CI) system was evaluated. A total of 20 tablets including five calibration and 15 unknown samples were measured at once using a large field of view (59.5 mm × 47.5 mm). In this multitablet measurement, each calibration and unknown sample was described by approximately 3000 pixels on the infrared camera, in which each pixel measures 186 μm × 186 μm of the sample surface area. The content uniformity of unknown samples predicted by NIR-CI was compared with the results from the conventional UV method. To examine the impact of the sample location in this large field of view, measurements of the same samples located at different positions were also performed, and the results compared. As a result of the evaluation, the content of individual tablets obtained by NIR-CI shows excellent agreement with the reference UV method values. Moreover, it was further determined that changing the position of any given tablets in the array had a negligible effect when the calibration tablets were under the same field of view. This article demonstrates the use of NIR-CI for simultaneous measurement of content uniformity for multiple tablets and discusses some advantages of this approach.
Near-infrared chemical imaging (NIR-CI) using a focal plane array detector can collect tens of thousands of spatially distinct NIR spectra simultaneously. These spatially resolved data provide qualitative and quantitative insight into the functionality of heterogeneous samples such as pharmaceuticals, polymer laminates, or agricultural and biological materials (1–6). Although the quantitative nature of chemical imaging has always been an integral part of the technique, the analytical approaches for dealing with this novel data construct were developed as applications evolved. As with all new analytical techniques, early developments emphasized technology and hardware improvements to determine robust, stable, and relatively economical instrument and experimental configurations based upon available technology.
An often-overlooked advantage of this technique is the ability to perform high-throughput measurements on multiple samples simultaneously, in effect ignoring the spatial dependence of the information. Rather than focusing on characterizing the heterogeneity of a single sample, the high throughput application is used to compare the chemical signatures from multiple samples in a single field of view (FOV). In addition, when using an NIR-CI system in such a high-throughput configuration, part of the field of view can be dedicated to reference samples such as calibration sets with known chemical composition, or pure component samples, which are measured at the same time as the target samples. These reference samples serve as internal standards, and data from them are used to predict concentrations or abundances of chemical components of target samples, eliminating the possibility of temporal drift between sample and reference measurements (7).
In this study, NIR-CI was evaluated as a high-throughput technique, which measures multiple tablets simultaneously and predicts the concentration of the active pharmaceutical ingredient (API) in tablets using a calibration set within the same field of view. The predicted API concentrations were compared with the results from the conventional UV measurements. The possible impact of change in absolute and relative locations of target and calibration tablets on the concentration predictions were evaluated as well to demonstrate the quantitative, reproducible, and robust nature of these analyses.
Measurement of content uniformity for solid dosage units is a critical manufacturing control procedure. Traditionally, the content uniformity in the pharmaceutical industry is measured by either UV–Vis absorbance spectrometry, or high performance liquid chromatography (HPLC) methods. These methods commonly use an external standard to provide a direct measurement result of API content in drug products. However, the drawbacks of these methods are lengthy analysis time and sample destruction. One time-consuming step in conventional analysis is sample preparation, including sample extraction and dilutions. Depending upon the types of solvents used and the volume consumed, secondary problems that pose significant cost and safety concerns are also encountered. In addition, samples analyzed in this manner are destroyed completely, preventing further testing. For example, tablets that fail content uniformity testing at this stage are not available for further root-cause or other types of forensic analysis.
In this study, NIR-CI was used for the content uniformity analysis. The technique requires little or no sample preparation, eliminating solvents. In addition, it involves no sample destruction and is capable of high-throughput analysis. Clearly, several of these advantages are shared by several other optical analytical methods, including conventional NIR spectroscopy. However, the use of an infrared focal plane array, and the inclusion of calibration data in the same field of view, has the potential to increase the throughput and reliability of the assay dramatically compared to other optical and nonoptical methods. In addition, the inclusion of calibration data in the same FOV potentially can eliminate a separate calibration step necessary in other spectroscopic measurements. In this preliminary study, 15 unknown and five calibration samples were measured simultaneously by NIR-CI in less than 2 min with no sample preparation. In contrast, the same number of samples, when measured with the UV method, took approximately half a working day to analyze. Changes in the optical magnification of the system to accommodate more samples simultaneously, as well as optimization of the wavelengths necessary to perform the analysis, can increase the number of samples that can be analyzed per minute dramatically compared with what is reported in this study.
Experimental
NIR-CI
The chemical imaging data used in this study were collected in diffuse reflectance mode using a commercially available NIR chemical imaging spectrometer (Matrix NIR, Spectral Dimensions, Inc., Olney, Maryland) equipped with an indium gallium arsenide (InGaAs) focal plane array (FPA) detector consisting of 320 × 256 pixels for a total of 81,920 spectra per image cube recorded. The spectral resolution of the system is 6 nm with a scan range of 950–1750 nm and variable spectral point spacing as small as 1 nm. The field of view can vary from 2.2 mm × 1.8 mm (7 μm × 7 μm/pixel) to 100 mm × 82 mm (320 μm × 320 μm/pixel). For this particular measurement, the data were collected over 1100–1700 nm with a spectral point spacing of 10 nm and 16 coadded images per wavelength. This resulted in a data cube containing 61 images, with each image cube being collected in approximately 2 min. To measure 20 tablets in a single FOV, the imaging optics were configured for an FOV of 59.5 mm × 47.5 mm, with each pixel sampling approximately 186 μm × 186 μm of the sample surface area. A background data cube recorded over the same wavelength interval using a high-diffuse reflectance target (a white ceramic plate) and a dark data cube using a high-specula reflectance target (a mirror) was used to convert the sample data for each image cube to log10 (1/R).
Initial data collection was performed using the data acquisition software package (MatrixAcquire) provided with the system. Data preprocessing and preliminary visualization were performed using ISys software package version 3.1.1 (Spectral Dimensions, Inc.) running on a 2-GHz Athlon PC with 2 GB of RAM running Microsoft Windows 2000. The sample data cubes were background corrected to reflectance (R), converted to log10 (1/R), and spatially masked to eliminate nonsample data. The resulting NIR data most often are considered to arise from two sources: chemical and physical. While the chemical differences result in different spectral features, the physical differences originating from scattering differences or variable illumination as a result of sample shape and orientation manifest themselves in the form of varying absolute intensity or differences in the offset and slope in the baseline of the spectra. Preprocessing steps normally are used to separate and eliminate much of the variance due to the physical differences while maintaining the signal due to the chemical differences. In this case, the data sets were mean centered and normalized to unit variance and subsequently subjected to first derivative operation using a Savistky–Golay algorithm to minimize baseline effects. All spectra within a tablet are averaged automatically to yield a single representative spectrum per tablet. All future references to spectra or spectral intensity in the manuscript beyond this point refer to those of these tablet average spectra.
UV–Vis measurement
UV measurement for the content uniformity of calibration and unknown samples was performed on an HP-8453 UV–Vis instrument. The peak intensity of API in the tablets was monitored at a wavelength of 250 nm. The pathlength of the sample cell is 1.0 cm. The content of the unknown and calibration tablets was calculated by an external reference standard, which is the pure API. The sample solvent for sample preparation consisted of 50% water and 50% acetonitrile (HPLC grade) purchased from Aldrich (Milwaukee, Wisconsin). For UV measurement solution, one tablet was transferred into a 500-mL volumetric flask and dissolved with the sample solvent. The supernatant of the sample solution was analyzed by the UV method. The concentration of the sample solution for the UV measurement was approximate 0.16 mg/mL.
Sample description
Sample tablets including calibrators and unknown of 80-mg strength of core tablets containing various dosage strengths of the API were obtained from Novartis Pharmaceutical Corporation (East Hanover, New Jersey): five calibration sets labeled A through E and three target sets labeled T1, T2, and T3. These tablets are single-layer tablets, containing one API component and some excipients. Each set, either a calibration or a target set, was composed of five tablets with varying API content. It is customary to report the content uniformity results in %API content, which is a percent ratio of actual API content in weight to desired API content in weight (80 mg). To eliminate the confusion in terms, from here on, API content is defined as actual API dosage (mg) in a tablet, and API concentration as % wt/wt of actual API dosage (in milligrams) with respect to the tablet weight (in milligrams).

Table I: API concentrations (% wt/wt) of calibration sets measured by UV method
Results and Discussion
API concentrations (% wt/wt) of calibration sets were determined by the UV measurements and summarized in Table I, in which these are primary and reference measurements. To establish the correlation between NIR-CI data and API concentrations, five calibration sets were laid out as illustrated in Figure 1 and data were collected.

Figure 1
The data set was preprocessed as described above and examined to determine correlation between API concentrations and spectral characteristics. The normalized first derivative peak at 1600 nm from all five calibration sets showed the same trend that correlated with the API concentration, indicating that the spectral intensity at 1600 nm can be used to predict API concentrations of unknown. The representative spectra from calibration set A are shown in Figure 2.
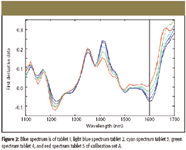
Figure 2
To predict the API concentration of an unknown sample from a spectral variable, there must be a systematic correlation between the spectral variable and API concentration. In other words, a calibration curve that can represent the relationship between the spectral variable and the API concentration must be constructed. In this study, the spectral variable showed a trend that correlated to the API concentration in the peak intensity at 1600 nm (shown as the dotted line in Figure 2); therefore, such a relationship between API concentration and the peak intensity can be used to develop a calibration curve.
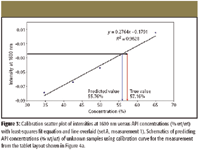
Figure 3
Calibration set A was used to develop a calibration curve and calibration sets from B through E were used to validate the model. Plotting the intensity at 1600 nm with respect to the API concentration shows the good linear relationship between them, indicating that the API concentration is relatively well predicted simply by a change in the intensity at 1600 nm. These data demonstrate that a least-squares fit can be used to predict the API concentration of an unknown sample.
Instead of using a single calibration curve for all subsequent sample measurements, calibration set A was selected to be included in the same FOV as the sample sets and measured at the same time. A calibration curve is developed using the data from calibration set A in the same FOV to predict API concentrations of target sets for each measurement. This approach effectively results in the generation of a calibration curve "on the fly" each time a new sample measurement is made, thereby minimizing, or even negating, any transfer of calibration errors.
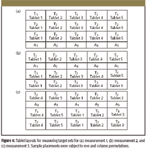
Figure 4
For data collection, calibration set A and target sets T1, T2, and T3 were arranged as illustrated in Figure 4. The calibration tablets (A series) covered the concentration range from 70% to 130%, and five levels of unknown tablets covered the nominal concentrations (% wt/wt) of 80%, 90%, 100%, 110%, and 120%. Three measurements of the same tablets were made with columns and rows permutated to determine the location dependency of API prediction using NIR-CI. For convenience, the measurement from the layout shown in Figure 4a is named measurement 1, the measurement from the layout in Figure 4b is measurement 2, and the measurement from the layout in Figure 4c is measurement 3. The intensity map at 1600 nm of measurement 3 (Figure 4c) is shown in Figure 5.
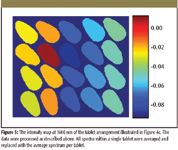
Figure 5
The image in Figure 5 is a color-scaled map of intensity at 1600 nm, with red for the maximum value and blue for the minimum as shown in the color bar. The image provides qualitative information that is visibly accessible; samples colored in red show high intensity at 1600 nm and, in proportion, high API concentration. Conversely, samples colored in blue show low intensity at 1600 nm and, in proportion, low API concentration.
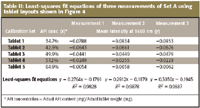
Table II: Least-squares fit equations of three measurements of Set A using tablet layouts shown in Figure 4
A calibration curve is developed by plotting averaged intensities at 1600 nm for five tablets belonging to calibration set A and API concentrations given by the formula. The least-squares fit equation is calculated from the calibration curve, which in turn is used to predict the API concentrations of the rest of the tablets in the same FOV belonging to target sets. The schematic for API concentration prediction from the calibration curve is illustrated in Figure 3 using the data from measurement 1. The least-squares fit equations of three measurements drawn from calibration set within the same FOV are summarized in Table II, and API concentration prediction results based upon the least-squares fit equations are summarized in Table III.
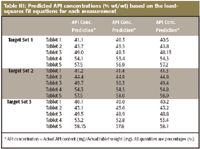
Table III: Predicted API concentrations (% wt/wt) based on the least-squares fit equations for each measurement
The results of three measurements were compared to determine the location dependency of the API prediction method employed here. We calculated the range of three prediction values (difference between maximum and minimum values) as an indicator of the location dependency of API concentration prediction. The mean prediction error is 0.54% with the maximum value of 0.97%, demonstrating that the location dependency of API concentration is very small. The results are summarized as a stacked bar chart in Figure 6.
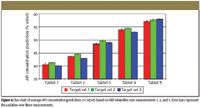
Figure 6
API concentration prediction results using NIR-CI (mean of three measurements) were compared with those from UV measurement. API concentrations predicted by NIR-CI were converted to % API content based upon the tablet weight before they were compared to the results from UV measurement. The UV measurements were performed on the same tablets that were measured with chemical imaging. The average difference of individual tablets between imaging data and UV data is 2.72%, with a maximum of 6.40% in API content, which translates to 2.18 mg and 5.12 mg in actual API mass difference. The results are summarized in Figure 7.
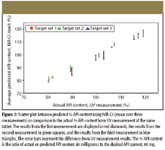
Figure 7
API content uniformity of multiple tablets can be determined simultaneously by NIR-CI, producing results that are in good agreement with the standard UV measurement (Figure 7). The advantages of NIR-CI are the high-throughput (15 tablets at once) technique and the additional capability to include an internal calibration set to ensure that the API content prediction is independent of temporal changes in the instrument or other measurement conditions. Due to the destructive nature of the UV measurement, it is necessary to perform NIR-CI analysis on multiple target sample arrays using the same calibration set samples as internal calibration set before the calibration set is taken and analyzed with the UV measurement, which is considered the primary analysis method. At this point, the true API content or concentration from UV measurement will be used to develop a calibration curve, which in turn will be used to predict the API content or concentration of target samples.
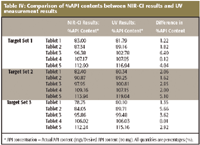
Table IV: Comparison of %API contents between NIR-CI results and UV measurement results
Tablets labeled with the same number index in each target set (Figure 4) are the same tablets. The comparison across these tablets provides the content uniformity of API. Even though the size of the sample pool is rather small (three tablets per API dosage strength), comparing the content uniformity results in Table IV for API between the results from NIR-CI analysis and UV analysis demonstrates the reliability and validity of determining content uniformity using NIR-CI. Table V shows that the average difference of the mean %API content between NIR-CI results and UV measurement results is 2.32%, with the maximum of 4.29%. The average difference of the range of API content between NIR-CI results and UV measurement results is 2.85%, with a maximum of 6.28%. In addition, Figure 8 shows scatter plots of NIR-CI results and UV measurement results. The error bars in each plot graphically indicate the potential error range from each data marker in these measurements.
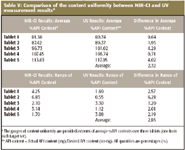
Table V: Comparison of the content uniformity between NIR-CI and UV measurement results*
Conclusions
High-throughput measurements of NIR-CI can provide reliable content uniformity measurements. In this case, the mean intensity at 1600 nm per tablet from NIR-CI measurements was determined to be proportional to the API concentration. Data from a calibration set composed of tablets of known API concentrations were used to develop a calibration curve. These tablets were measured at the same time in the same field of view as the target sets comprising tablets of unknown API concentration. A least-squares fit using an internal calibration data set for each measurement was used to predict the API concentration of target sets. These results were compared with those from UV measurements, and they showed an excellent agreement, considering the fact that imaging measured only the top surface of each tablet rather than the entire tablet. The same samples were measured multiple times and were placed in different layouts to determine the location dependency on concentration prediction. In each case, the tablet is exposed to different illumination and therefore slightly different optical measurement conditions. The results show that the location dependency is negligible. The content uniformity information was obtained based upon the results from both techniques and shows a good agreement between traditional UV measurement (reference data) and NIR-CI measurement (evaluation data).
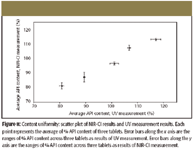
Figure 8
The NIR-CI instrument employed here utilizes a tunable filter as a wavelength discriminator, and thus the instrument is able to directly access any wavelength at random. The method developed for the current study demonstrated that only a single wavelength after preprocessing was necessary for the analysis. This suggests that a routine method could be devised in which only a small range of wavelengths, centered about this absorption band, would be recorded, resulting in a significant reduction in the overall data collection time. Additionally, with this kind of imaging instrumentation, the size of the FOV can be increased readily to accommodate an even larger number of tablets. While this would yield a lower sampling density (pixels per tablet), it is reasonable to assume that the current configuration of approximately 1500 pixels/tablet results in significant oversampling and redundancy in the data. Therefore, by manipulating and optimizing both the wavelength scanning range and the FOV, one can readily see that the throughput of this method might be increased dramatically with little or no loss of accuracy over what has been shown in this publication.
Finally, this is an initial investigation into the feasibility of using NIR-CI for multianalysis of tablet content uniformity. A more practical approach might be to prepare a calibration sample set gravimetrically, or to establish a universal calibration curve before the sample measurement. However, in the latter approach, the stability of this instrument and repeatability of day-to-day basis measurement should be evaluated. Evaluation of these approaches will be a further investigation.
Eunah Lee is with Malvern Instruments, Olney, Maryland, and HORIBA Jobin Yvon, Inc., Edison, New Jersey.
Wei X. Huang, Patrick Chen, and Richard V. Vivilecchia are with Pharmaceutical & Analytical Development, Novartis Pharmaceutical Corporation, East Hanover, New Jersey.
E. Neil Lewis is with Malvern Instruments, Olney, Maryland.
References
(1) P. Geladi, J. Burger, and T. Lestander, J. Chemolab. 1, 209–217 (2004).
(2) F. Clarke, J. Vibspec. 8, 25–35 (2003).
(3) E.N. Lewis, J. Schoppelrei, and E. Lee, Spectroscopy 19(4), 26–36 (2004).
(4) F.W. Koechler IV, E. Lee, L.H. Kidder, and E.N. Lewis, Spectroscopy Europe 14(3), 12–19 (2002).
(5) R.C. Lyon, D.S. Lester, E.N. Lewis, E. Lee, L.X. Yu, E.H. Jeffereson, and A.S. Hussain, AAPS PharmSciTech. 3(3), article 17 (2002).
(6) G. Reich, Advanced Drug Delivery Review 57, 1109–1143 (2005).
(7) E.N. Lewis, High-throughput infrared spectroscopy, U.S. Patent 6, 483, 112, 11/01/2002.

Whey Protein Fraud: How Portable NIR Spectroscopy and AI Can Combat This Issue
May 20th 2025Researchers from Tsinghua and Hainan Universities have developed a portable, non-destructive method using NIR spectroscopy, hyperspectral imaging, and machine learning to accurately assess the quality and detect adulteration in whey protein supplements.
Wearable fNIRS Sensor Tracks Cognitive Fatigue in Real Time
May 7th 2025Researchers have developed a wireless, wearable brain-monitoring device using functional near-infrared spectroscopy (fNIRS) to detect cognitive fatigue in real time. The miniaturized system enables mobile brain activity tracking, with potential applications in driving, military, and high-stress work environments.

.png&w=3840&q=75)

.png&w=3840&q=75)


.png&w=3840&q=75)


.png&w=3840&q=75)


