High-Throughput Trace Analysis Using SERS-Coated Microtiter Plates with a Raman Plate Reader
Special Issues
Surface-enhanced Raman spectroscopy (SERS) has been studied extensively over the last few decades with many advances in preparation of SERS substrates and coatings. While the bulk of the research in SERS substrate preparation has been devoted to pushing detection limits to higher sensitivity for measurement of single samples, the application of SERS to high-throughput analysis has been largely ignored. In this article, we present the use of commercially available SERS-coated microtiter plates in a dedicated Raman microtiter plate reader, enabling high-throughput trace analysis measurements. This article also describes the SERS substrate, the high-throughput plate reader, and preliminary results from samples representing trace analysis of explosives, nerve agents, pharmaceuticals, and biological compounds.
Raman spectroscopy has been widely used in a variety of analytical measurements because of its chemical specificity, its ability to produce spectral signatures that are unique, and its ability to obtain measurements conveniently with little sample preparation. Raman spectroscopy, though widely applied, is not inherently sensitive, with routine detection limits in the parts-per-thousand range. Although sensitivity can be improved by 10 to 50 times using a shorter laser excitation wavelength due to the inverse fourth power dependence of Raman scattering on wavelength, it also can cause fluorescence, which can overwhelm the weak Raman effect. A more dramatic method of increasing Raman scattering is surface-enhanced Raman spectroscopy (SERS), which can enhance scattering by six orders of magnitude or more (1), improving detection limits to the parts-per-billion (nanogram-per-milliliter) range. Since its discovery and recognition in the 1970s (2,3), the vast majority of research has been aimed at elucidating the mechanisms that promote this enhancement (4), which now includes detection of single molecules on "hot-spots" and enhancements as high as 14 orders of magnitude (5,6). Only in the last decade have efforts begun to exploit the ability of SERS to detect trace chemicals, such as chemical and biochemical agents and drugs (7–9). Furthermore, very little research has been reported on the routine use of SERS in high sample throughput applications that might benefit drug discovery or routine clinical analysis.
Farquharson and colleagues reported the use of SERS-active microtiter plates for drug discovery (10), while Sägmuller and colleagues described the preparation of silver halide dispersions in microplates for the analysis of illicit drugs (11). Bell and colleagues reported the deposition of silver sols onto glass slides and polymer-coated microtiter plates (12), with subsequent extension of the method to high-throughput detection of nicotine (13). However, all of these reported measurements employed unique SERS-active substrates prepared by the researchers, as well as custom-built Raman spectrometer systems or Raman microscope systems. Many laboratories that have the need to measure trace components in high throughput, however, might not have the expertise to synthesize the SERS substrates with high reproducibility, nor the budget to acquire the high performance Raman instrumentation described in the previous research. Here, we describe the use of commercially available SERS-active microtiter plates with a novel, low-cost Raman microtiter plate reader for high-throughput trace analysis measurements and show preliminary results for samples representative of explosives, nerve agents, pharmaceuticals, and biological compounds.
Experimental
Benzenethiol, benzoic acid, 2,4-dinitrotoluene, and methylphosphonic acid were obtained from Sigma Aldrich (Allentown, Pennsylvania), and were used as is or diluted in high performance liquid chromatography (HPLC)-grade water or methanol for normal Raman and SERS measurements.
A stock aqueous solution of ampicillin (molecular biology grade, Na salt, Shelton Scientific, Shelton, Connecticut) was prepared by weighing (Explorer PRO analytical balance, Ohaus, Pine Brook, New Jersey) dry ampicillin powder and dissolving into purified water (sequential purification of tap water with Diamond-RO and NANOpure Diamond systems, Barnstead, Dubuque, Iowa) to a final concentration of 100 mg/mL. The stock solution was serially diluted with purified water using precision pipettes and disposable pipette tips to achieve the 100 ppm solution.
A DNA stock solution was prepared by weighing a portion of herring sperm DNA (free acid, Sigma Co., St. Louis, Missouri, fragment size 50–200 base pairs as determined by gel electophoresis in a 1% agarose gel), allowing the dry DNA to hydrate with excess purified water in a centrifuge tube for 1 h at room temperature, after which the volume was adjusted with the addition of NANO-pure water to achieve a final concentration of 50 mg/mL, and the solution was manually shaken until a clear homogenous solution was obtained. A 100-ppm DNA solution was prepared by serial dilution as described earlier.
Instrumentation
All measurements were performed with a Digilab Identity Raman plate reader (Digilab, Inc., Holliston, Massachusetts). This instrument is configurable with either a 532-nm or 785-nm laser and spectrometer with a Peltier-cooled CCD array detector capable of <10 cm-1 spectral resolution and supports standard clear, flat-bottom 96- and 384-well microtiter plates, as well as custom plate formats. The laser is focused through the bottom of the plate into the well for the analysis of liquids. Powders or coatings on the bottom of the well can be analyzed by placing the plate on a plate shim to raise the bottom of the well to the laser focal point. Raman scattering is collected in an 180° backscatter configuration. Glass bottom plates are typically recommended for measurement of solids or coatings to reduce the interference in the spectrum from the plate material.
An x-y motorized stage for automatic analysis of the well positions defined in the control software plate map (Figure 1) also was utilized.
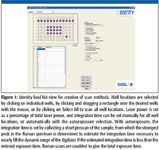
Figure 1
The 96-well SERS-active microtiter plates (Real-Time Analyzers, Inc., Middletown, Connecticut) consisted of ~1-mm thick coating of a patented (10) silver-doped sol-gel chemistry on glass bottom microtiter plates (Greiner Bio-One, VWR, Bridgeport, New Jersey). The height of the microplate was adjusted to bring the SERS coating into the focal point of the laser, as shown schematically in Figure 2. Approximately 100–200 μL of each analyte in solution was added to individual SERS-active wells for analysis. The analytes were allowed to diffuse passively into the porous sol-gel and the immobilized silver particles.
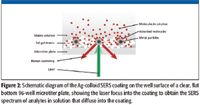
Figure 2
Spectra of benzenethiol, benzoic acid, 2,4-dinitrotoluene, and methyl phosphonic acid were collected using a 532-nm laser at 30-mW laser power and a 10 s total exposure time using the autoexposure setting. Each spectrum was corrected using a dark current collected with the same integration time and number of coadditions as the sample spectrum. For these measurements, total measurement time per well is thus approximately 20 s for collection of the sample spectrum and dark current spectrum, and the total time to scan an entire 96-well plate would be approximately 34 min. Sample diffusion occurs from the time the sample is added to the well to the time the plate is mounted for scanning, and it does not add to the overall analysis time. Spectra of ampicillin and herring sperm DNA were also collected with the 532-nm laser, but with a reduced power setting of 15 mW to prevent sample degradation from the laser, and at a total measurement time of 60 s to compensate for the reduced laser power.
Results and Discussion
The SERS spectrum of a solution of 10-ppm benzenethiol in methanol is compared to the Raman spectrum of neat benzenethiol in Figure 3. Benzenethiol is highly SERS-active, and often is used to establish SERS activity for various SERS substrates.
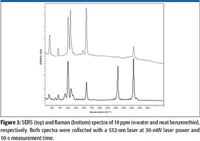
Figure 3
A brief examination of the normal Raman spectrum compared to the SERS spectrum demonstrates the changes in relative peak intensity and position to the spectrum that can be induced by the SERS effect. In the case of benzenethiol, sulfur forms a chemical bond with silver as substantiated by the disappearance of the 2550 cm-1 peak due to thiol (S-H). Such a bond will also change the electron density and hence, the bond strength of several vibrational modes and consequently their spectral peak positions, as well as intensities. Such bonding also will influence the proximity and orientation of the vibrational modes with respect to the metal surface and the plasmon field, again influencing peak intensity.
The goal of this preliminary study was to establish the ability of SERS-active microtiter plates and a Raman plate reader to perform high-throughput analysis of trace chemicals, and only modest, low concentrations were measured. Nevertheless, a comparison of the aromatic ring mode intensity at ~1580 cm-1 for the SERS of the 10-ppm sample and the Raman of the pure sample was used to estimate a 3 × 10⁴ enhancement factor. This modest enhancement factor underestimates the enhancements that can be expected at lower concentrations, as the SERS intensity is limited by the available silver surface area, which typically becomes saturated in the 1–10 ppm analyte concentration range. Furthermore, the signal-to-noise ratio suggests that significantly lower concentrations, such as parts per billion, could be measured easily (as is true for all the spectra presented).
Next, benzoic acid, which represents a functional group common to many drugs, was examined. A similar comparison of the Raman to SERS spectra for benzoic acid in methanol at 10 wt% (105 ppm) to 10 ppm, respectively, is displayed in Figure 4.
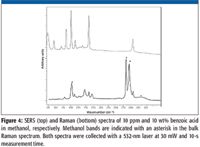
Figure 4
Raman peaks for methanol are marked with an asterisk. Because methanol is not SERS-active, its Raman peaks do not appear in the SERS spectrum. This also illustrates the benefits of laser excitation through the bottom of the plate, as opposed to from the top and through any solvent, which would then contribute to the SERS spectrum. A SERS enhancement factor of 2 × 10⁴ was estimated for benzoic acid using the same method as for benzenethiol.
An example of trace explosive detection is shown in Figure 5, which compares the Raman to SERS spectra of 2,4-dinitrotoluene at 5 wt% and 100 ppm in methanol, respectively. Again the methanol peaks are marked with an asterisk.
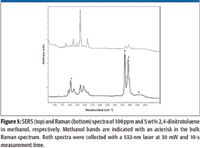
Figure 5
Methyl phosphonic acid is a hydrolysis product of nerve agents (VX, GB, GD, and GF), and is an example of the use of this technique for detection of nerve agent by-products. The Raman and SERS spectra of methyl phosphonic acid at 40 wt% and 100 ppm in water, respectively, are shown in Figure 6.
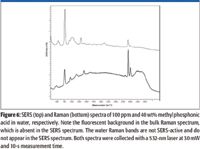
Figure 6
A comparison of these two spectra reveals several differences in Raman band intensities and positions, as described earlier, but it also reveals another benefit of SERS, which is the reduction of fluorescence interference. A fluorescent background is evident in the bulk solution spectrum of methyl phosphonic acid, but not in the SERS spectrum.
Figure 7 compares the Raman and SERS spectra of ampicillin at 10 wt% and 100 ppm in water, respectively. Measurement of potential drug entities or their activity, such as this antibiotic, are common applications of high-throughput screening. In addition to the absence of the strong water peak centered at 3330 cm-1 in the SERS spectrum, it appears that both the carboxylic acid peak at 1600 cm-1 and the C-N peak at 2100 cm-1 are enhanced substantially.
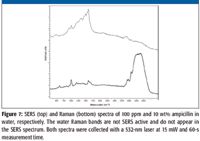
Figure 7
Detection of DNA fragments is another application of high-throughput trace analysis. Figure 8 compares the Raman and SERS spectra of herring sperm DNA fragments (50–200 base pairs) at 5 wt% and 100 ppm in water, respectively. Here, the spectra differences are dramatic. In the case of the 5 wt% sample, only fluorescence is observed, which completely obscures any Raman spectral features that might be present. In contrast, the SERS spectrum, which contains some fluorescence, clearly shows evidence of nucleotides, such as the adenine peak at 735 cm-1.
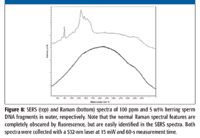
Figure 8
Conclusion
The principle of high-throughput trace analysis has been demonstrated with commercially available SERS-active 96 well microtiter plates in a novel, low-cost Raman plate reader. Quality spectra were obtained from a variety of samples representing explosives, chemical warfare agents, pharmaceuticals, and biological compounds. Although only modest enhancement factors were estimated, this was attributed to the high concentration of the samples measured during this preliminary study, and sub-part-per-million detection limits should be expected. This is also supported by the excellent signal-to-noise ratios for all of the SERS measurements. As an added benefit, the ability of SERS to quench fluorescence and obtain quality spectra was also shown. Finally, the speed of analysis, 10–60 s per well, suggests that the combination of SERS-active microtiter plates and a Raman reader has great potential for high-throughput trace analysis for many applications.
David L. Drapcho and Igor Zlatkin are with Digilab, Inc., Holliston, MA. Frank Inscore, Chetan Shende, Atanu Sengupta, Hermes Huang, and Stuart Farquharson are with Real-Time Analyzers, Inc., Middletown, CT.
References
(1) M.J. Weaver, S. Farquharson, and M.A. Tadayyoni, J. Chem. Phys. 82, 4867–4874 (1985).
(2) M. Fleischmann, P.J. Hendra, and A.J. McQuillan, Chem. Phys. Lett. 26, 163–166 (1974).
(3) D.L. Jeanmaire and R.P. Van Duyne, J. Electroanal. Chem. 84, 1–20 (1977).
(4) K. Kneipp, M. Moskovitz, and H. Kneipp, Eds., Surface-Enhanced Raman Scattering – Physics and Applications 103 (Springer, Berlin/Heidelberg, 2006).
(5) S. Nie and S.R. Emory, Science 275, 1102–1106 (1997).
(6) K. Kneipp, Y. Wang, H. Kneipp, L.T. Perelman, I. Itzkan, R.R. Dasari, and M.S. Feld, Phys. Rev. Lett. 49, 1667–1670 (1997).
(7) S. Farquharson, A. Gift, P. Maksymiuk, and F. Inscore, Appl. Spectrosc. 59, 654–660 (2005).
(8) S. Farquharson, W. Smith, C. Brouillette, and F. Inscore, Spectroscopy, June supplement, 8–15 (2005).
(9) S. Farquharson, A. Gift, C. Shende, F. Inscore, B. Ordway, C. Farquharson, and J. Murran, Molecules 13, 2608–2627 (2008).
(10) S. Farquharson, Y.H. Lee, and C. Nelson, U.S. Patent Number 6,623,977 (2003).
(11) B. Sägmüller, B. Schwarze, G. Brehm, and S. Schneider, Analyst 126, 2066–2071, (2001).
(12) S.E.J. Bell and S.J. Spence, Analyst 126, 1–3 (2001).
(13) S.E.J. Bell and N.M.S. Sirimuthu, Analyst 129, 1032–1036 (2004).
AI-Powered SERS Spectroscopy Breakthrough Boosts Safety of Medicinal Food Products
April 16th 2025A new deep learning-enhanced spectroscopic platform—SERSome—developed by researchers in China and Finland, identifies medicinal and edible homologs (MEHs) with 98% accuracy. This innovation could revolutionize safety and quality control in the growing MEH market.
New Raman Spectroscopy Method Enhances Real-Time Monitoring Across Fermentation Processes
April 15th 2025Researchers at Delft University of Technology have developed a novel method using single compound spectra to enhance the transferability and accuracy of Raman spectroscopy models for real-time fermentation monitoring.
Nanometer-Scale Studies Using Tip Enhanced Raman Spectroscopy
February 8th 2013Volker Deckert, the winner of the 2013 Charles Mann Award, is advancing the use of tip enhanced Raman spectroscopy (TERS) to push the lateral resolution of vibrational spectroscopy well below the Abbe limit, to achieve single-molecule sensitivity. Because the tip can be moved with sub-nanometer precision, structural information with unmatched spatial resolution can be achieved without the need of specific labels.
