ICP-MS Determination of Micro and Macro Elements in Waters
Special Issues
ICP-MS for the analysis of drinking water.
Because of the significance of clean water for human health and agriculture, water analysis is critical for determining both elements present at high levels as well as trace contaminants. Several types of waters must be analyzed: water for human consumption must be monitored for both nutritional and toxic components, wastewater discharge must be analyzed to verify the effectiveness of treatment in removing toxic components, and lake and river water should be analyzed to help determine mobility of elements through the ecosytem.
A variety of techniques can be used for these analyses. For example, elements that typically are present at elevated levels (such as Na, Mg, K, and Ca) can be measured easily by inductively couple plasma–optical emission spectrometry (ICP-OES), while elements normally present at trace levels are best measured with techniques optimized for low-level analysis, including ICP-mass spectrometry (MS), graphite furnace atomic absorption spectrometry (AAS), or hydride generation AAS. Among these techniques, ICP-MS and ICP-OES are uniquely suited to analyze both low and elevated levels, with ICP-MS allowing lower levels to be measured than ICP-OES.
The growing popularity of cell-based ICP-MS has opened new possibilities for water analysis. Because cell-based ICP-MS eliminates the effects of interferences, it is now possible to measure elements at lower levels, usually limited by the cleanliness of the reagents and laboratory environment. The ability to measure lower levels allows regulated limits to be lowered. Recently, the U.S. Environmental Protection Agency has lowered the acceptable limit of arsenic in drinking water from 50 μg/L to 10 μg/L.
Another aspect of cell-based ICP-MS is the ability to suppress signal sensitivity, thus allowing higher levels to be measured, essentially extending the dynamic range of the instrument. This capability allows elements present at high levels (such as Na, Mg, K, and Ca) to be analyzed by ICP-MS with less dilution. Depending upon the configuration of the ICP-MS system, the suppression of signal sensitivity can be applied on a per-isotope basis without affecting the sensitivity of other isotopes, which allows both major and trace levels to be measured from the same sample in a single method.
This article will focus on the analysis of drinking and saline waters for both major and minor elements in a single analysis. All water samples were analyzed by ICP-MS and ICP-OES to confirm the results.
Experimental
Reagents and Sample Preparation
Samples were analyzed without any pretreatment. Drinking waters were analyzed directly, and saline waters were diluted 12.5 times with 1% (v/v) HNO3 (Suprapur, Merck KGaA, Darmstadt, Germany).
Internal standards were used to compensate for possible matrix effects during sample introduction. An internal standard mix (Y, Rh, and Re) was added on-line by merging flows of the sample and internal standard mix.
External calibration curves were applied using standards ranging from 5 μg/L to 400 mg/L, depending upon the element and expected levels. Elements likely to be present at low concentrations (that is, As, Se, and Pb) used calibration curves established with 5, 10, 50, and 100 µg/L standards, while high-level elements (that is, Na, Mg, K, and Ca) used standards at milligram-per-liter concentrations.
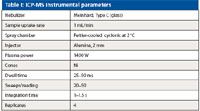
Table I: ICP-MS instrumental parameters
Instrumentation
All analyses were performed on an ELAN DRC-e ICP-MS system (PerkinElmer, Inc., Shelton, Connecticut) equipped with a Peltier-cooled spray chamber and a Meinhard C-type glass concentric nebulizer. In a single method, the elements were grouped into three modes: standard mode, extended dynamic range mode (that is, standard mode with the application of bandpass parameters), and dynamic reaction cell (DRC) mode using oxygen as a reaction gas. Instrumental parameters are reported in Table I, and dynamic reaction cell conditions appear in Table II.
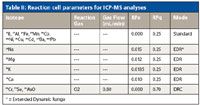
Table II: Reaction cell parameters for ICP-MS analyses
The samples also were analyzed for comparison by ICP-OES, using an Optima 5300 DV system (PerkinElmer, Inc.). Using dual-view capabilities, elements present at elevated levels were measured in radial mode and trace-level elements were determined axially. Several wavelengths were used for each element to check for possible spectral interferences; the preferred wavelengths, along with analysis mode and instrumental conditions, are reported in Tables III and IV.

Table III: ICP-OES instrumental parameters
Results
The ability to suppress signal intensity selectively on a per-isotope basis without affecting the sensitivity of other isotopes is accomplished by varying the reaction cell bandpass parameters (specifically RPa) when the reaction cell is not filled with a gas. This allows a high degree of tuneability of isotopic sensitivities to best meet the desired analytical levels.
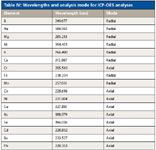
Table IV: Wavelengths and analysis mode for ICP-OES analyses
Figure 1 shows calibration curves for Na, Mg, K, and Ca up to 400-, 100-, 40-, and 200-mg/L levels, respectively. Correlation coefficients for these calibration curves were at least 0.9999, which demonstrates linearity and allows the accurate analysis of elevated levels of these elements in samples.
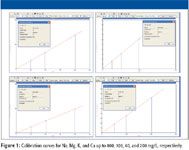
Figure 1
Tables V and VI show both the ICP-MS and ICP-OES results for drinking waters and saline waters, respectively. The agreement between all techniques for elements present at both trace and elevated levels in both water types confirms the concentrations. The effectiveness of extending the dynamic range is evidenced by the results for Na and Mg in the saline waters: The concentrations from both ICP-MS and ICP-OES are nearly identical.
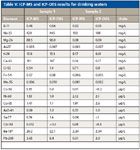
Table V: ICP-MS and ICP-OES results for drinking waters
Conclusion
This work has demonstrated the ability of DRC-ICP-MS to analyze elements present at both trace and elevated levels in drinking and saline water samples. The capability to suppress signal intensity selectively without the use of a cell gas allows the dynamic range of DRC-ICP-MS to be extended and matrix elements to be measured. All results were confirmed using ICP-OES. Although both ICP-OES and DRC-ICP-MS give similar results for these samples, it should be noted that these are complementary techniques with each having its strengths and weaknesses for various sample types and analyte levels.
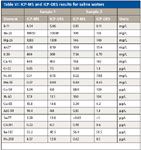
Table VI: ICP-MS and ICP-OES results for saline waters
Riccardo Magarini is Senior Inorganic Specialist with PerkinElmer, Inc., Shelton, Connecticut.
References
(1) T.J. Wilkinson, D.L. Perry, M.C. Martin, W.R. McKinney, and A.A. Cantu, Appl. Spectrosc. 56, 800 (2002).
(2) S.D. Mansfield, E. de Jong, R.S. Stephens, and J.N. Saddler, J. Biotechnol. 57, 205 (1997).
(3) A. Kher, M. Mulholland, E. Green, and B. Reedy, Vib. Spectrosc. 40, 270 (2006).

FT-IR Spectral Fingerprints Reveal Secrets of Rubies and Sapphires
May 14th 2025Scientists at the University of Barcelona have developed a fast and reliable way to identify natural, treated, and synthetic rubies and sapphires using Fourier-transform infrared (FT-IR) spectroscopy. Their study reveals unique spectral fingerprints for different gemstone types, offering a powerful tool in the fight against gem fraud.
Exploring Data Transforms in Chemometrics
May 14th 2025Our “Chemometrics in Spectroscopy” column highlights the methodology that is used in order to apply chemometric methods to data. Integrating chemometrics with spectroscopy allows scientists to understand solutions to their problems when they encounter surprising results. Recently, columnists Howard Mark and Jerome Workman, Jr., wrote a series of articles about data transforms in chemometric calibrations. In this listicle, we profile all pieces in this series and invite you to learn more about applying chemometric models to continuous spectral data.
How Spectroscopy and Science are Reshaping Gemology
May 13th 2025A historical and technical overview from the Gemological Institute of America (GIA) explores how advanced scientific instruments—particularly spectroscopic methods—have transformed gem identification. From refractometers to modern spectrophotometers, this deep dive highlights the evolving challenges and solutions in gem testing.

.png&w=3840&q=75)

.png&w=3840&q=75)


.png&w=3840&q=75)


.png&w=3840&q=75)


