The Imaging Advantage to FT-IR Spectroscopy
The authors discuss how applying infrared spectroscopy to microscopic sample preparations extends the value of results generated and provides molecular analysis of physical and chemical interactions.
The use of thermo micro methods for the evaluation of active pharmaceutical ingredients and excipient interactions enables direct and rapid analysis of microscopic samples. The value of this capability is significant at the earliest stages of drug development when time is important and samples available for testing are limited. Applying infrared spectroscopy to these microscopic sample preparations extends the value of results generated and provides molecular analysis of physical and chemical interactions.
The use of infrared (IR) spectroscopy for chemical identification and evaluation is limitless. Whether the challenge faced is as simple as identifying a raw material before receipt into a manufacturing plant or as complex as monitoring a multispecies reaction to determine endpoint, IR spectroscopy can be applied effectively to solve a variety of problems. The development of a miniaturized interferometer revolutionized the application of this well-established technique, effectively making it possible to link an IR spectrometer to standard light microscopes. Unfortunately, regardless of their usefulness in a variety of applications, IR microscopes are not always used to their fullest potential.
Instances commonly arise where the need to collect an IR spectrum from a defined area within a microscopic sample is critical. For example, when analyzing cross-sections of multilayer laminates, effective analysis would not be possible without the ability to visualize each layer and collect spectra from discrete locations across the sample. Or when analyzing specific crystals within a mixture, the ability to microscopically differentiate and select a single particle for analysis is necessary. Drug chemists frequently rely on this capability when isolating illicit drugs for analysis from among complex cutting-agent matrices.
A field of study that receives a significant amount of attention for a variety of reasons is the analysis of solid-state form of active pharmaceutical ingredients (APIs) and the compatibility of these molecules with excipients used in drug-product formulations. When applied within this field, the value of the IR microscope can be realized. Not only is it possible to evaluate distinct particles to evaluate changes such as crystalline or amorphous structure, hydrogen bonding, and water or solvate bonding, but it is also possible to apply thermo micro methods (1) to evaluate the nature of the interactions between different compounds in a formulation to assess component compatibility.
Thermo micro methods have long been applied to the characterization and identification of unknown substances. Using a microscope for observation, a sample of unknown composition is heated under a glass microscope slide alongside a "standard" of known melting temperature. The interaction of the two substances is monitored, and the effect each compound has upon the other is evaluated. The simplest interaction resulting from this type of fusion preparation is formation of a eutectic. This is a uniform fine-grain mixture of the two components. It has a single melting temperature that is always lower than the melting temperature of either starting material. Comparison of the eutectic melting temperature with tables of known eutectics enables an identification of the unknown. Figure 1 shows a fusion preparation that formed a simple eutectic. At the time this image was collected, the sample was heated to its eutectic melting temperature. The eutectic melt is observed along the zone of mixing between the two starting materials.
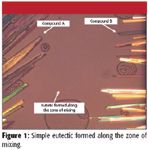
Figure 1
Using an IR microscope, it is now possible to collect spectra from along the zone of mixing as well as from across the fusion preparation to perform molecular identification of all compounds present. Application of IR spectroscopy to thermo micro methods is ideal for the evaluation of API–excipient interactions. Sample amounts are microscopic, analysis time is minimal, and in addition to the ability to observe physical and chemical interactions directly, spectral analysis of eutectics and other complexes formed (such as co-crystals or addition compounds) is performed easily. The value of this type of information early in the drug development process is substantial because sample quantities of new molecular entities usually are limited and the need to maximize testing efficiency is crucial. In addition, the use of these methods makes it simple to create composition diagrams that can be used to evaluate the effect manufacturing conditions such as heat will have upon the API and excipients. These diagrams can be used as guides when establishing formulations and manufacturing procedures. Figure 2 shows the composition diagram of a simple eutectic.
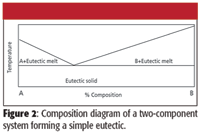
Figure 2
A eutectic is a uniform physical mixture of two substances and behaves as if it is a single phase. Therefore, the chemical composition of a eutectic is fixed and can be measured easily by performing a series of experiments using a hotstage microscope. When performing these experiments, different concentrations of the two components are mixed intimately. These mixtures are then melted to the eutectic temperature to determine at which concentration only a melt is observed (no excess crystals of either component A or component B are present). This concentration is the concentration of the uniform eutectic. Using IR microspectroscopy, this process is simplified. In addition, the IR spectrum provides information about the sample that is not obtainable using hotstage microscopy. For instance, because the eutectic is a physical mixture of two components, the IR spectrum of the eutectic is a mixture of the IR spectrum of each component. There should be no additional absorption bands present in the eutectic spectrum, and only minimal shifts in bands resulting from chemical interactions between the two components. Conversely, if the IR spectrum shows additional or different absorption bands or significant shifts in band position, it is likely that the interaction between the two components is chemical in nature (that is, addition compounds or co-crystals have formed). When a new compound is formed, the new molecular entity might form a eutectic with pure component A on one side and pure component B on the other. A composition diagram of a two-component system that forms an addition compound with eutectics on either side is shown in Figure 3. A temperature-composition diagram is a convenient means of expressing the melting point as a function of composition of all solid phases present in two- or three-component systems (2). The value of the IR microscope to collect spectral information is important because it provides molecular information about the individual components as well as how these components react when combined.
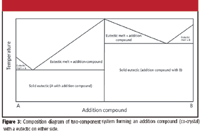
Figure 3
To evaluate the ability of the IR microscope to evaluate these types of fusion preparations effectively, a series of samples known to react with each other and form simple eutectics were prepared and analyzed. Application of the IR microscope to these samples is invaluable because the spectral results provide a molecular understanding of the nature of the compatibility of the different components.
Experimental
Five different eutectic samples were prepared using the fusion-preparation method. Each sample was analyzed using a Smiths Detection IlluminatIR II infrared microscope with a Linkam LTS350 hotstage (Danbury, Connecticut). For each sample, at least five spectra were collected along the zone of mixing (that is, along the eutectic, at a temperature below the melting temperature of the eutectic). All eutectics were analyzed in their solid form. In addition, a spectrum was collected from pure component A and pure component B of the same fusion preparation. Spectral libraries of linear combinations of pure A and pure B in 5% increments were created for each sample. Each individual spectrum collected from along the zone of mixing was searched against the library prepared for that two-component mixture. The spectral match with the best hit quality was determined. The average percent composition and standard deviation of the higher-concentration component, for the spectra collected along the eutectic, was determined. The eutectics prepared are detailed within Table I.

Table I: Two-component mixtures used to prepare eutectics
Spectra from the azobenzol–benzil eutectic and the phenacetin–benzanalid eutectic were collected using reflection absorption microspectroscopy with an analysis spot size no greater than 1002 μm2 at each point analyzed. The remaining three eutectics were analyzed using attenuated total reflection (ATR) microspectroscopy with an analysis spot size no greater than 422 μm2 at each point analyzed.
In addition, a fusion preparation of trinitrofluorenone and mononitro-napthalene was prepared. This two-component mixture is known to form an addition compound with a melting temperature of 163 °C. An IR spectrum was collected from this addition compound and compared with the IR spectra collected from trinitrofluorenone and mononitronapthalene.
Results
Each IR spectrum collected along the eutectic of each sample was consistent with the spectra collected from different locations of the same eutectic, indicating that the eutectic is chemically consistent throughout. Figure 4 shows an image of a typical eutectic as it appears at temperatures below the eutectic melt. In this image, the crystal front of the pure benzanalid phase is seen at the top left corner of the field. The crystal front of the pure phenacetin phase is seen at the bottom right corner of the field. The zone of mixing where the interaction between the two phases occurred is across the image. Five locations from which IR spectra were collected from this sample are highlighted in yellow. Note that the eutectic formed is a finer-grain phase than either the crystals of benzanilid or phenacetin.
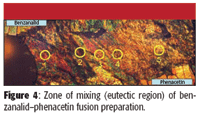
Figure 4
Data collected from each eutectic is summarized and displayed in Table II. These results show that the chemical composition of each eutectic, as expected, is consistent from location to location.
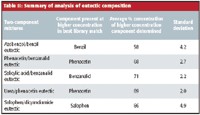
Table II: Summary of analysis of eutectic composition
In addition, a review of the IR spectral data shows that the average spectrum collected for each eutectic is a mixture of the spectra from each of its pure components. In four of the five examples, no additional bands or shifts were observed in the eutectic. However, for the eutectic of salophen and dicyandiamid, shifts in bands were observed across the spectrum. The exact nature of these shifts is not known. It is likely that although the eutectic is assumed to be strictly a physical mixture of the two components of the mixture, for this sample there is a measurable degree of chemical interaction between these two components in the eutectic phase as evidenced by differences in the IR spectra. Figures 5 and 6 show the average eutectic spectrum of azobenzol and benzil. No additional bands or significant band shifts are present in this eutectic spectrum. This type of spectral comparison was typical of all of the eutectics formed except for the spectra from the salophen–dicyandiamide eutectic. Figures 7 and 8 show the average eutectic spectrum of salophen and dicyandiamide. While the spectrum is an overlay of the two spectra, and even though a single-phase melt is observed at the eutectic melt temperature, the IR spectra indicate that there is some interaction between the two components that is likely chemical in nature.
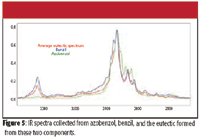
Figure 5
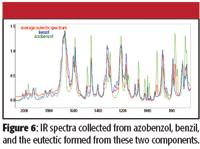
Figure 6
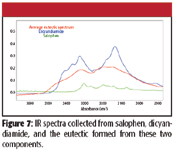
Figure 7
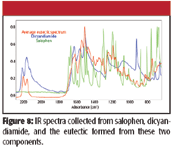
Figure 8
The fusion preparation of mononitronapthalene and trinitrofluorenone is shown in Figure 9. Mono-nitro-napthalene is on the left side of the image and trinitrofluorenone is on the right side of the image. The addition compound is along the center of the image, is dark brown in color, and is highlighted with a yellow arrow. The spectra collected from the addition compound as well as from pure mononitronapthalene and trinitrofluorenone are shown in Figures 10 and 11. These spectra show that the molecular composition of the addition compound is different from each starting component and is not simply a physical mixture of the two. Knowing the chemical structure of the starting compounds, it is possible to evaluate what functional groups of the molecule are changing chemically. The ability to perform this type of analysis is critical when it is necessary to understand the nature of changes occurring.

Figure 9
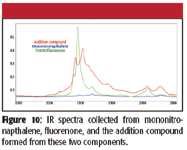
Figure 10
The use of thermo micro methods enables an evaluation of the melting characteristics of each compound formed during interaction. While these methods have historically relied upon melting behavior, the addition of IR microspectroscopy increases the value of the information obtained significantly and is an ideal tool for evaluating API and excipient compatibility.
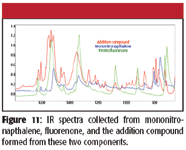
Figure 11
Summary
Application of the IR microscope to thermo micro methods significantly increases the valuable information obtained from the analysis of APIs and excipients. Historically, these methods were used for the identification of unknowns by visually observing component interactions and melting behaviors. Using the IR microscope, it is now possible to understand, on a molecular level, the nature of interactions between APIs and excipients. The added benefits of rapid analysis times and needing only microscopic sample amounts make these techniques ideal for use during the earliest stages of the drug development process. At this time, knowledge of API and excipient interactions can effectively be used to guide formulation development and the manufacturing process.
Pauline E. Leary is with Smiths Detection, Danbury, Connecticut. Jennifer L. Giordano is with Purdue Pharma, LP, Cranbury, New Jersey. John A. Reffner is with Trace Consulting, Stamford, Connecticut.
References
(1) L. Kofler and A. Kofler, Thermo-Mikro Methoden (Universitätsverlag Wagner, Innsbruck, Austria, 1954).
(2) W.C. McCrone, Fusion Methods in Chemical Microscopy (Interscience Publishers, Inc., New York, 1957), p. 142.

Introduction to Satellite and Aerial Spectral Imaging Systems
April 28th 2025Modern remote sensing technologies have evolved from coarse-resolution multispectral sensors like MODIS and MERIS to high-resolution, multi-band systems such as Sentinel-2 MSI, Landsat OLI, and UAV-mounted spectrometers. These advancements provide greater spectral and spatial detail, enabling precise monitoring of environmental, agricultural, and land-use dynamics.
AI Shakes Up Spectroscopy as New Tools Reveal the Secret Life of Molecules
April 14th 2025A leading-edge review led by researchers at Oak Ridge National Laboratory and MIT explores how artificial intelligence is revolutionizing the study of molecular vibrations and phonon dynamics. From infrared and Raman spectroscopy to neutron and X-ray scattering, AI is transforming how scientists interpret vibrational spectra and predict material behaviors.
Real-Time Battery Health Tracking Using Fiber-Optic Sensors
April 9th 2025A new study by researchers from Palo Alto Research Center (PARC, a Xerox Company) and LG Chem Power presents a novel method for real-time battery monitoring using embedded fiber-optic sensors. This approach enhances state-of-charge (SOC) and state-of-health (SOH) estimations, potentially improving the efficiency and lifespan of lithium-ion batteries in electric vehicles (xEVs).