Impact of Measurement Protocol on ICP-MS Data Quality Objectives: Part I
Quadrupole-based inductively coupled plasma–mass spectrometry (ICP-MS) is undoubtedly the fastest growing trace element technique today. Since its commercialization in 1983, approximately 20,000 systems have been installed worldwide to carry out a diverse range of applications, including environmental, geological, semiconductor, biomedical, food, pharmaceuticals, cannabis-hemp, petrochemical, and nuclear applications. To meet such varied application needs, modern ICP-MS instrumentation has to be very flexible if it is to keep up with the increasing demands of its users. Nowhere is this more important than in the area of peak integration and measurement protocol. The way the analytical signal is managed in ICP-MS has a direct impact on its multielement characteristics, isotopic capability, detection limits, dynamic range, precision, signal stability and sample throughput—the major strengths that attracted the trace element community to the technique almost 40 years ago. This month’s column focuses on the fundamentals of quadrupole-based ICP-MS measurement regimes—in particular, the balance between maximizing productivity and optimizing performance.
To understand signal management in greater detail and its implications on data quality objectives, it is important to discuss how measurement protocol is optimized based on the analytical requirements and, in particular, its impact on both continuous signals generated by traditional pneumatic nebulization devices and transient signals produced by sampling techniques such as laser ablation, chromatographic separation, and particle and size studies.
This month’s column will be split into two parts. The first part will focus on the fundamental principles of a scanning quadrupole and, in particular, how measurement protocols can be optimized based on the data quality objectives of the analysis. The second part, which will be published early next year, will look at different ways of evaluating detection capability with conventional continuous signals and those generated by sampling methods involving transient peaks.
Measurement Variables
There are many variables that affect the quality of the analytical signal in inductively coupled plasma–mass spectrometry (ICP-MS). The analytical requirements of the application will often dictate this, but there is no question that instrumental detection and measurement parameters can have a significant impact on the quality of data in ICP-MS. Some of the variables that can potentially impact the quality of the data, particularly when carrying out multielement analysis, are as follows:
- whether the signal is continuous or transient
- the temporal length of the sampling event
- volume of sample available
- number of samples being analyzed
- number of replicates per sample
- number of elements being determined
- detection limits required
- precision and accuracy expected
- dynamic range needed
- selection of integration time
- peak quantitation routines used.
- contamination issues
- cleanliness of labware
- purity of reagents and acids.
Before we go on to discuss these in greater detail and how these parameters affect the data, it is important to remind ourselves how a scanning quadrupole operates, and the fundamental principles of measurement protocol used for multielement peak quantitation.
Fundamentals of Measurement Protocol
A quadrupole operates by placing both a direct current (DC) field and a time-dependent alternating current (AC) of radio frequency on opposite pairs of the four rods. By selecting the optimum AC/ DC ratio on each pair of rods, ions of a selected mass-to-charge (m/z) are allowed to pass through the rods to the detector, whereas the others are unstable and ejected from the quadrupole. Figure 1 shows this in greater detail.
FIGURE 1: Schematic showing principles of mass separation using a quadrupole.
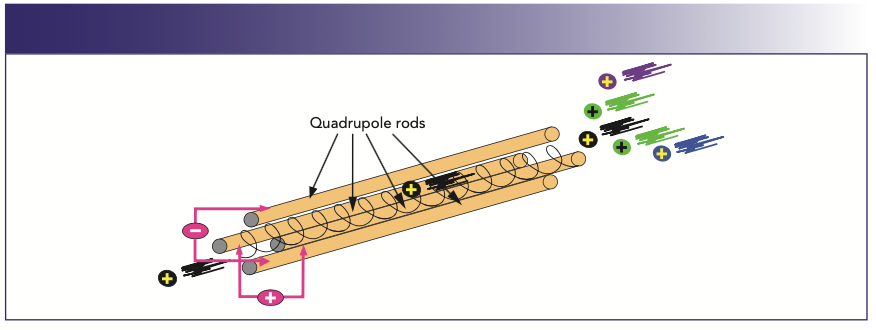
In this simplified example, the analyte ion (black) and four other ions (gray) have arrived at the entrance to the four rods of the quadrupole. When a particular AC/DC potential is applied to the rods, the positive or negative bias on the rods will electrostatically steer the analyte ion of interest down the middle of the four rods to the end, where it will emerge and be converted to an electrical pulse by the detector. The other ions of different m/z values will be unstable, pass through the spaces between the rods, and be ejected from the quadrupole. This scanning process is then repeated for another analyte with a completely different m/z ratio until all the analytes in a multielement analysis have been measured.
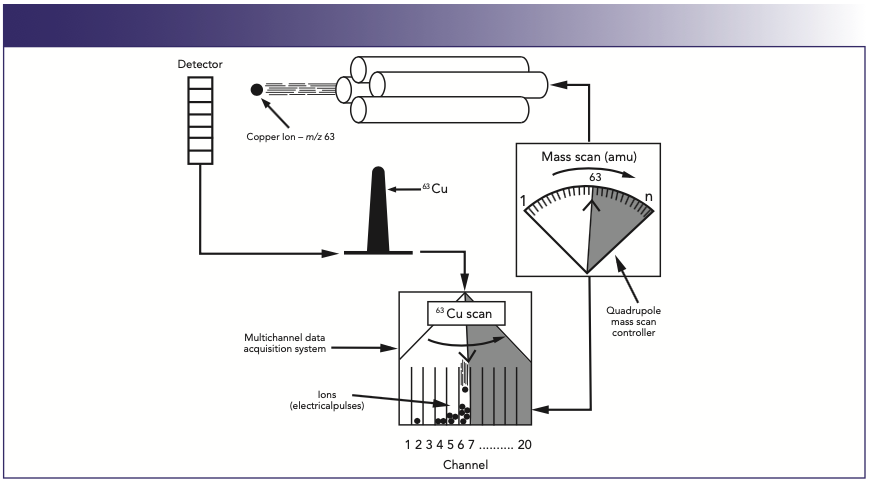
The process for the detection of one particular mass in a multielement run is represented in Figure 2, which shows a 63Cu+ ion emerging from the quadrupole and being converted to an electrical pulse by the detector. As the AC/DC voltage of the quadrupole—corresponding to 63Cu+—is repeatedly scanned, the ions are stored and counted by a multichannel analyzer as electrical pulses. This multichannel data acquisition system typically has 20 channels per mass. As the electrical pulses are counted in each channel, a profile of the mass is built up over the 20 channels, corresponding to the spectral peak of 63Cu+.
FIGURE 2: Profiles of different masses are built up using a multichannel data acquisition system (1).
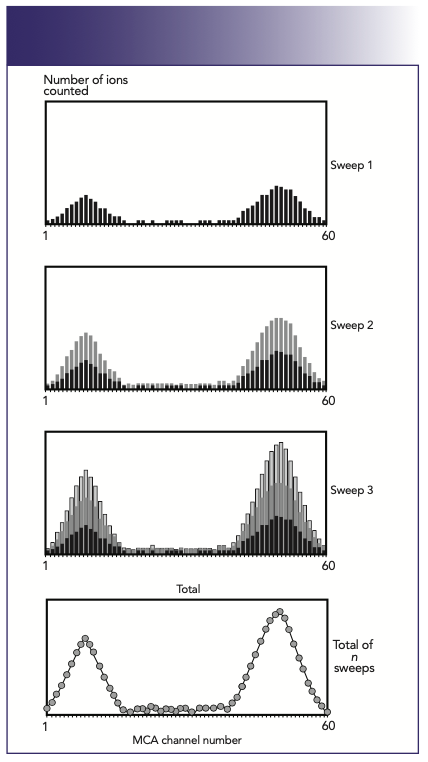
In a multielement run, repeated scans are made over the entire suite of analyte masses, as opposed to just one mass represented in this example. The principles of multielement peak acquisition are shown in Figure 3. In this example, signal pulses for two masses are continually collected as the quadrupole is swept across the mass spectrum, shown by sweeps 1–3. After a fixed number of sweeps (determined by the user), the total number of signal pulses in each channel is obtained, resulting in the final spectral peak (1).
FIGURE 3: A profile of the peak is built up by continually sweeping the quadrupole across the mass spectrum (1).
When it comes to quantifying an isotopic signal in ICP-MS, there are basically two approaches to consider. One is the multichannel ramp scanning approach, which uses a continuous smooth ramp of 1–n channels (where n is typically 20) per mass across the peak profile. This approach is shown in Figure 4 (2). In addition, there is the peak hopping approach, where the quadrupole power supply is driven to a discrete position on the peak (normally the maximum point), allowed to settle, and a measurement is taken for a fixed amount of time. This approach is represented in Figure 5.
FIGURE 4: Multichannel ramp scanning approach using 20 channels per amu.
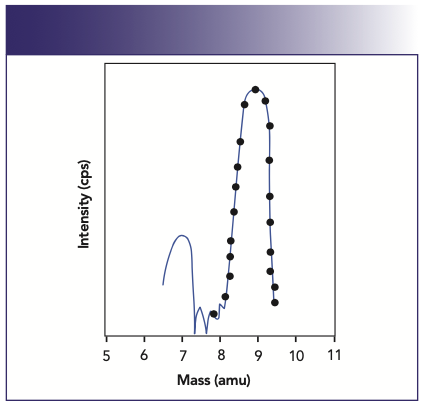
FIGURE 5: Peak-hopping approach.
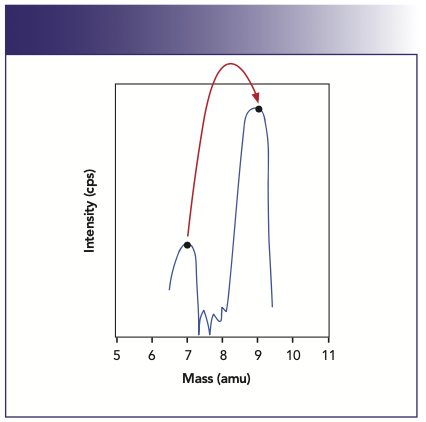
The multipoint scanning approach is best for accumulating spectral and peak shape information when doing mass scans. It is normally used for doing mass calibration and resolution checks, and as a classical qualitative method development tool to find out what elements are present in the sample, and to assess their spectral implications on the masses of interest. Full peak profiling is not normally used for doing rapid quantitative analysis, because valuable analytical time is wasted taking data on the wings and valleys of the peak, where the signal-to-noise (S/N) ratio is poorest.
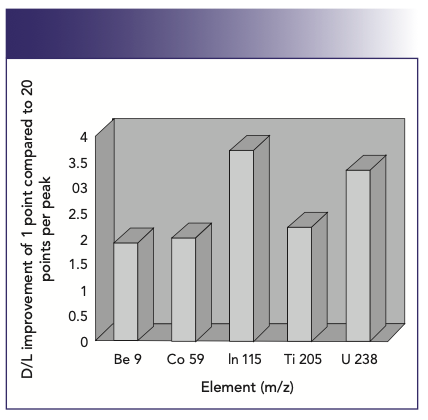
When the best possible detection limits are required, the peak-hopping approach is best. It is important to understand that to get the full benefit of peak-hopping, the best detection limits are achieved when single point–peak hopping at the peak maximum is chosen. However, to carry out single point–peak hopping, it is essential that the mass stability is “rock solid” to reproducibly go to the same peak position every time. If good mass stability can be ensured, measuring the signal at the peak maximum will always give the best detection limits for a given integration time. It is well documented that there is no benefit in spreading the chosen integration time over more than one measurement point per mass. If time is a major consideration in the analysis, then using multiple points is wasting valuable time on the wings and valleys of the peak, which contribute less to the analytical signal and more to the background noise. This is shown in Figure 6, which demonstrates the degradation in signal-to-background noise of 10 ppb Rh with an increase in the number of points per peak, spread over the same total integration time. Detection limit improvement for a selected group of elements using 1 point/peak compared to 20 points/peak is shown in Figure 7.
FIGURE 6: Signal-to-background noise degrades when more than one point, spread over the same integration time, is used for peak quantitation (2).
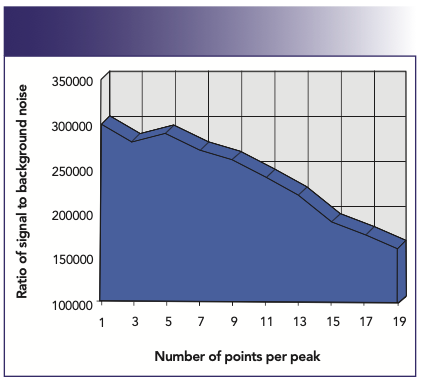
FIGURE 7: Detection limit improvement using one point per peak compared to 20 points per peak over the mass range (2).
Optimization of Measurement Protocol
Let’s now focus on the impact of optimizing the measurement protocol based on the requirements of the application. When multielement analysis is being carried out by ICP-MS, there are a number of decisions that need to be made. First, we need to know if we are dealing with a continuous signal from a nebulizer, or a transient signal from a sampling accessory (such as the laser ablation system of a chromatographic separation device). If it is a transient event, how long will the signal last? Another question that needs to be addressed is “How many elements are going to be determined?” With a continuous signal, a problem should not occur. Change to it may be an issue if we are dealing with a transient signal that lasts only a few seconds. We also need to be aware of the level of detection capability required, which is a major consideration with a single shot laser pulse of 5–10 s duration, and even more critical when characterizing nanoparticles which only last for a few milliseconds. But it is also an issue with a continuous signal produced by a concentric nebulizer, where we might have to accept a compromise of detection limit based on the speed of analysis requirements or amount of sample available. What analytical precision is expected? If isotope ratio or dilution work is being done, how many ions do we have to count to guarantee good precision? Does increasing the integration time of the measurement help the precision? Finally, is there a time constraint on the analysis? A high-throughput laboratory might not be able to afford to use the optimum sampling time to get the ultimate in detection limit. In other words, what compromises need to be made between detection limit, precision, and sample throughput? It is clear that, before the measurement protocol can be optimized, the major analytical requirements of the application need to be defined. Let us look at this in greater detail.
Multielement Data Quality Objectives
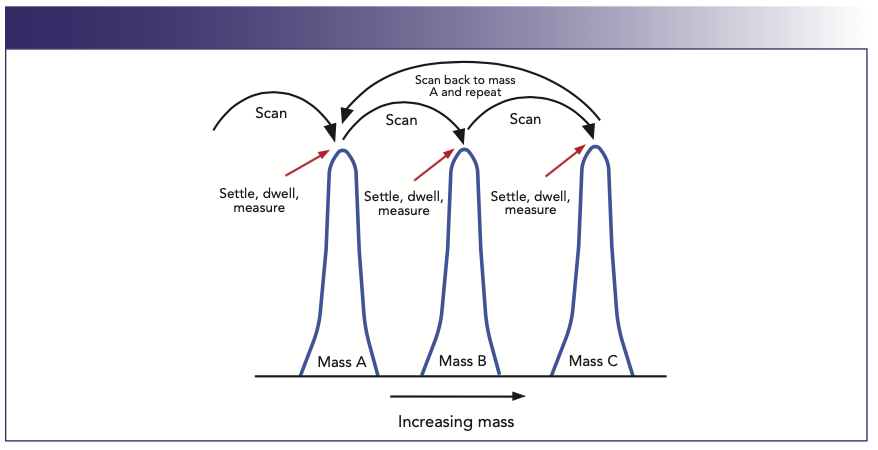
Because multielement detection capability is probably the major reason why most laboratories invest in ICP-MS, it is important to understand the impact of measurement criteria on detection limits. We know that, in a multielement analysis, the quadrupole’s RF-to-DC ratio is “driven” or scanned to mass regions, which represent the elements of interest. The electronics are allowed to settle and then “sit” or dwell on the peak and take measurements for a fixed period of time. This is usually performed a number of times until the total integration time is fulfilled. For example, if a dwell time of 50 ms is selected for all masses and the total integration time is 1 s, then the quadrupole will carry out 20 complete sweeps per mass, per replicate. It will then repeat the same routine for as many replicates that have been built into the method. This process is shown in a simplified manner in Figure 8, which displays the scanning protocol of a multielement scan of three different masses.
FIGURE 8: Multielement scanning and peak measurement protocol used for peak quantitation in a quadrupole-based ICP-MS.
Scanning and Settling Time
In this example, the quadrupole is scanned to mass A. The electronics are allowed to settle (settling time), left to dwell for a fixed period of time at one or multiple points on the peak (dwell time), and intensity measurements are taken (based on the dwell time). The quadrupole is then scanned to masses B and C, and the measurement protocol is repeated. The complete multielement measurement cycle (sweep) is repeated as many times as needed to make up the total integration per peak. It should be emphasized that this is a generalization of the measurement routine—management of peak integration by the software will vary slightly based on different instrumentation.
Duty Cycle
It is clear from Figure 8 that, during a multielement analysis, there is a significant amount of time spent scanning and settling the quadrupole, which does not contribute to the quality of the analytical signal. Therefore, if the measurement routine is not optimized carefully, it can have a negative impact on data quality. The dwell time can usually be selected on an individual mass basis, but the scanning and settling times are normally fixed because they are a function of the quadrupole and detector electronics. For this reason, it is essential that the dwell time, which ultimately affects detection limit and precision, dominates the total measurement time, compared to the scanning and settling times. It follows, therefore, that the measurement duty cycle (percentage of actual measuring time compared to total integration time) is maximized when the quadrupole and detector electronics settling times are kept to an absolute minimum. The measurement duty cycle can be seen in Figure 9, which shows a plot of percent measurement duty cycle against dwell time for four different quadrupole settling times—0.2, 1.0, 3.0, and 5.0 ms for one replicate of a multielement scan of five masses, using one point per peak. In this example, the total integration time for each mass was 1 s, with the number of sweeps varying depending on the dwell time used. For this exercise, the % duty cycle is defined by the following equation:

FIGURE 9: Measurement duty cycle as a function of dwell time with varying scanning/settling times. (Measuring 1 replicate of 5 masses using 1 point per peak)
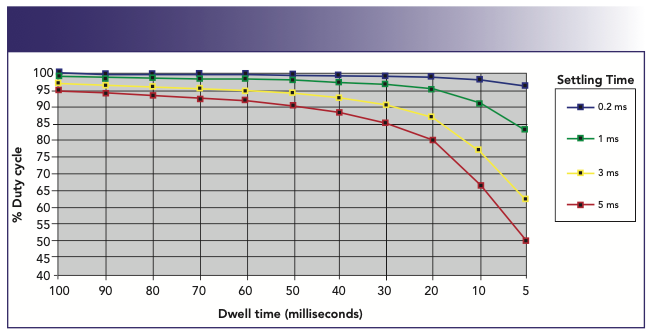
To achieve the highest duty cycle, the non-analytical time must be kept to an absolute minimum. This leads to more time being spent counting ions, and less time scanning and settling, which do not contribute to the quality of the analytical signal. This becomes critically important when a rapid transient peak is being quantified, because the available measuring time is that much shorter. It is therefore a good rule of thumb, when setting up your measurement protocol in ICP-MS, to use single point-peak hopping and, if possible, shorter settling times, because it will ultimately improve the quality of the data for a given integration time.
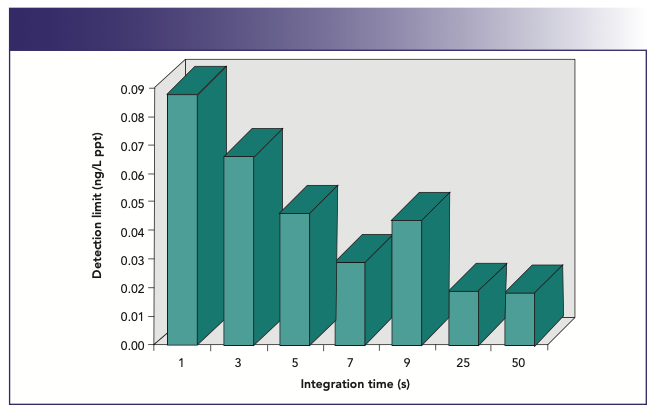
It can also be seen in Figure 9 that shorter dwell times translate into a lower duty cycle. For this reason, for normal quantitative analysis work, it is probably desirable to carry out multiple sweeps with longer dwell times (typically, 50 ms) to get the best detection limits. So, if an integration time of 1 s is used for each element, this would translate into 20 sweeps of 50 ms dwell time per mass. Although 1 s is long enough to achieve reasonably good detection limits, longer integration times generally have to be used to reach the lowest possible detection limits. This is shown in Figure 10, which shows detection limit improvement as a function of integration time for 238U+. As would be expected, there is a fairly predictable improvement in the detection limit, as the integration time is increased because more ions are being counted without an increase in the background noise. However, this only holds true up to the point where the pulse-counting detection system becomes saturated, and no more ions can be counted. In the case of 238U+, it can be seen that this happens at around 25 s, because there is no obvious improvement in detection limit (D/L) at a higher integration time. So, from this data, we can say that there appears to be no real benefit in using longer than a 7 s integration time. When deciding the length of the integration time in ICP-MS, you have to weigh up the detection limit improvement against the time taken to achieve that improvement. Is it worth spending 25 s measuring each mass to get 0.02 ppt detection limit, if 0.03 ppt can be achieved using a 7 s integration time? Alternatively, is it worth measuring for 7 s when 1 s will only degrade the performance by a factor of 3? It really depends on your data quality objectives.
FIGURE 10: Plot of detection limit against integration time for 238U+.
Counting Statistics
For some applications like isotope dilution or ratio studies, high precision is also a very important data quality objective (3). However, to understand what is realistically achievable, we have to be aware of the practical limitations of measuring a signal and counting ions in ICP-MS. Counting statistics based on the Poisson distribution tells us that the standard deviation of a digital ion signal is proportional to the square root of the signal. It follows, therefore, that the relative standard deviation (RSD) or precision should improve with an increase in the number (N) of ions counted as shown by the following equation:

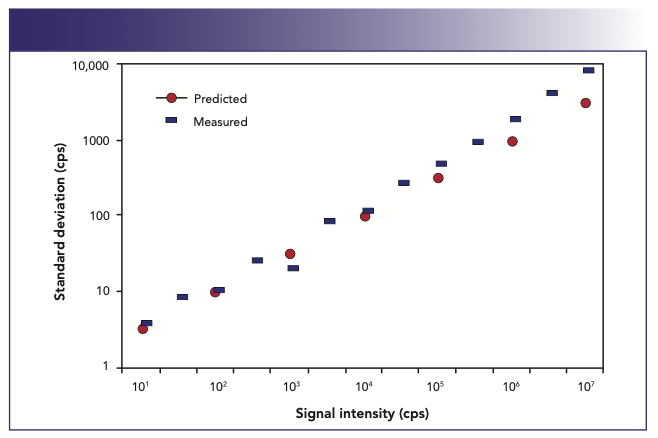
In practice, this holds up very well, as can be seen in Figure 11. In this plot of standard deviation as a function of signal intensity for 208Pb+, the black dots represent the theoretical relationship as predicted by Poisson counting statistics. It can be seen that the measured standard deviation (black bars) follows theory very well up to about 100,000 cps, where detector shot noise associated with converting the ions to an electrical signal is the major contributor to the background noise. Above 100,000 cps, additional sources of noise such as sample introduction-related events including the nebulization process, drainage pulsations and plasma fluctuations, begin to impact the signal, which leads to poorer standard deviation values.
FIGURE 11: Comparison of measured standard deviation of a 208Pb+ signal against that predicted by counting statistics (3).
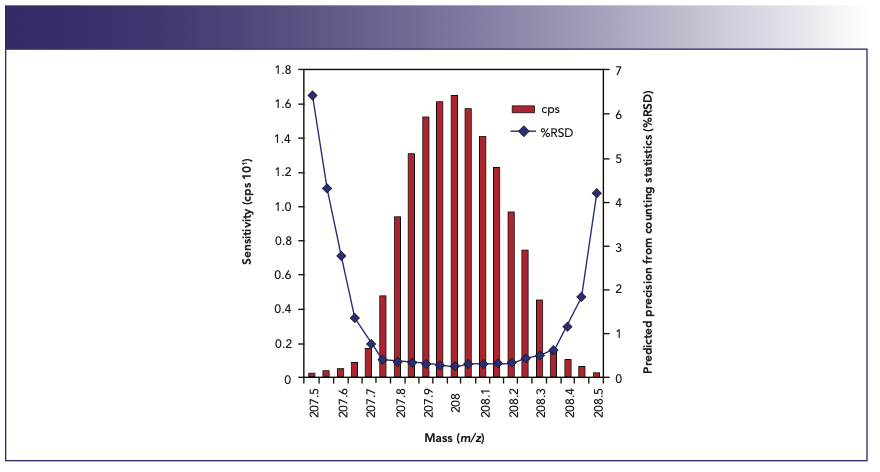
So, based on counting statistics, it is logical to assume that the more ions are counted, the better the precision will be. To put this in perspective, it means that at least 1 million ions need to be counted to achieve an RSD of 0.1%. In practice, of course, these kinds of precision values are very difficult to achieve with a scanning quadrupole system because of the additional sources of noise. If this information is combined with our knowledge of how the quadrupole is scanned, we begin to understand what is required to get the best precision. This is confirmed by the spectral scan in Figure 12, which shows the predicted precision at all 20 channels of a 5 ppb 208Pb+ peak (3).
FIGURE 12: Comparison of %RSD with signal intensity across the mass profile of a 208Pb+ peak (3).
Precision
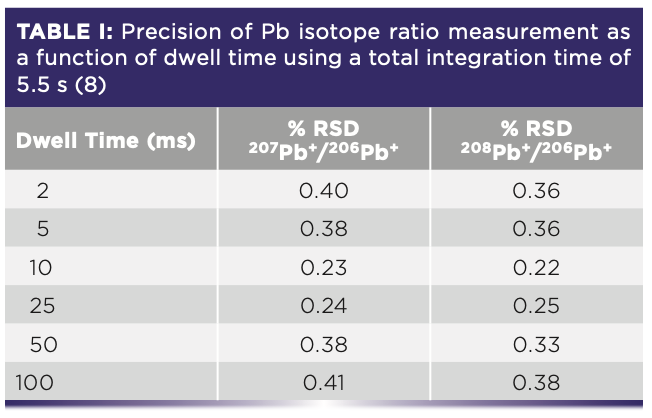
The best precision is obtained at the channels where the signal is highest, which as we can see are the ones at or near the center of the peak. For this reason, if good precision is a fundamental requirement of your data quality objectives, it is best to use single-point peak hopping with integration times on the order of 5–10 s. On the other hand, if high-precision isotope ratio or isotope dilution work is being done, where analysts would like to achieve precision values approaching counting statistics, then much longer measuring times are required. That is why integration times on the order of 5–10 min are commonly used for determining isotope ratios involving environmental pollutants (4) or clinical metabolism studies (5). For this type of analysis, when two or more isotopes are being measured and ratioed to each other, it follows that the more simultaneous the measurement, the better the precision becomes. Therefore, the ability to make the measurement as simultaneous as possible is considered more desirable than any other aspect of the measurement. This is supported by the fact that the best isotope ratio precision data is achieved with multicollector, magnetic sector ICP-MS technology that carries out many isotopic measurements at the same time using multiple detectors (6). Also, time-of-flight (TOF) technology, which simultaneously samples all the analyte ions in a slice of the ion beam, offers excellent precision, particularly when internal standardization measurement is also carried out in a simultaneous manner (7). Therefore, the best way to carry out pseudo-simultaneous measurement with a rapid scanning device such as a quadrupole is to use shorter dwell times (but not too short that insufficient ions are counted) and keep the scanning/settling times to an absolute minimum, which results in more sweeps for a given measurement time. This can be seen in Table I, which shows the precision of Pb isotope ratios at different dwell times carried out by researchers at the Geological Survey of Israel (8). The data are based on nine replicates of a NIST SRM-981 (75 ppb Pb) solution, using 5.5 s integration time per isotope.
Isotope Ratios
From these data, the researchers concluded that a dwell time of 10 or 25 ms offered the best isotope ratio precision measurement (quadrupole settling time was fixed at 0.2 ms). They also found that they could achieve slightly better precision by using a 17.5 s integration time (700 sweeps at 25 ms dwell time), but felt the marginal improvement in precision for nine replicates was not worth spending the approximately three-and-a-half times longer analysis time. This can be seen in Table II.

This work shows the benefit of being able to optimize the dwell time, settling time, and the number of sweeps to get the best isotope ratio precision data using a scanning quadrupole. It also helps to be working with relatively healthy ion signals for the three Pb isotopes, 206Pb, 207Pb, and 208Pb (24.1%, 22.1%, and 52.4% abundance, respectively).
It is clear that the analytical demands put on ICP-MS are probably higher than any other trace element technique, because it is continually being asked to solve a wide variety of application problems at increasingly lower levels. However, by optimizing the measurement protocol to fit the analytical requirement, quadrupole ICP-MS has shown that it has the unique capability to carry out rapid trace element analysis, with superb detection limits and good precision on both continuous and transient signals, and still meet the most stringent data quality objectives.
Part II of this article will focus on different ways to assessing detection capability by looking at the data quality objectives when dealing with a continuous signal generated by a conventional sample introduction system when measuring ions in solution and a transient signal generated by different types of alternative sampling methods such as chromatographic separation techniques and single nanoparticle studies.
References
(1) E. R. Denoyer, Principles of Multichannel Analysis in ICP-MS, PerkinElmer Application Note, TSMS-25, (1992)
(2) E. R. Denoyer, At. Spectrosc. 13(3), 93–98 (1992).
(3) T. Catterick, H. Handley, and S. Merson, At. Spectrosc. 16(10), 229–234 (1995).
(4) T. A. Hinners, E. M. Heithmar, T. M. Spittler, and J. M. Henshaw, Anal. Chem. 59, 2658–2662 (1987).
(5) M. Janghorbani, B.T.G. Ting, and N.E. Lynch, Microchem. Acta 3, 315–328 (1989).
(6) J.S. Becker and H.J. Dietz, J. Anal. At. Spectrom. 12, 881–889 (1997).
(7) S.N Willie and R.E. Sturgeon, Spectrochim. Acta, Part B 56(9), 1707–1716, (2001).
(8) L. Halicz, Y. Erel, and A. Veron, At. Spectrosc. 17(5), 186–189 (1996).
Robert Thomas is the editor and frequent contributor to the “Atomic Perspectives” column in this magazine. He is the principal of Scientific Solutions, a consulting company that serves the educational and writing needs of the trace element analysis user community. Rob has worked in the field of atomic and mass spectroscopy for more than 45 years, including 24 years for a manufacturer of atomic spectroscopic instrumentation. He has authored more than 100 scientific publications, including a 15-part tutorial series, A Beginners Guide to ICP-MS. In addition, he has authored five textbooks on the fundamentals and applications of ICP-MS. His most recent book, Measuring Heavy Metal Contaminants in Cannabis and Hemp, was published in September 2020. Rob has an advanced degree in analytical chemistry from the University of Wales, UK, and is a Fellow of the Royal Society of Chemistry (FRSC) and a Chartered Chemist (CChem). Direct correspondence to: robert.james.thomas@verizon.net●


High-Speed Laser MS for Precise, Prep-Free Environmental Particle Tracking
April 21st 2025Scientists at Oak Ridge National Laboratory have demonstrated that a fast, laser-based mass spectrometry method—LA-ICP-TOF-MS—can accurately detect and identify airborne environmental particles, including toxic metal particles like ruthenium, without the need for complex sample preparation. The work offers a breakthrough in rapid, high-resolution analysis of environmental pollutants.
Atomic Perspectives: Highlights from Recent Columns
March 3rd 2025“Atomic Perspectives,” provides tutorials and updates on new analytical atomic spectroscopy techniques in a broad range of applications, including environmental analysis, food and beverage analysis, and space exploration, to name a few. Here, we present a compilation of some of the most popular columns.