Challenges of Spectrofluorometry, Part 1: Collect Data Right the First Time
This article is the first of a 3-part series that gives a procedure to avoid common errors in spectrofluorometry using an example case. Part 2 will focus on throughput and polarization correction of spectrofluorometers for the purpose of inter-laboratory comparisons, while Part 3 will focus on non-ideal sample behavior.
In this first of a three-part series, we address the challenge of collecting good quality data by recommending procedures designed to “collect data right the first time." We focus our attention on the two most common fluorescence spectroscopies. The first is fluorescence emission spectroscopy, in which a single excitation wavelength is used and fluorescence is measured as a function of emission wavelength. The second is fluorescence excitation spectroscopy, in which a single emission wavelength is used to measure how well fluorescence is excited as a function of excitation wavelength. We assume the case in which the user plans to record both types of spectra for a compound in a solution.
Spectrofluorometers
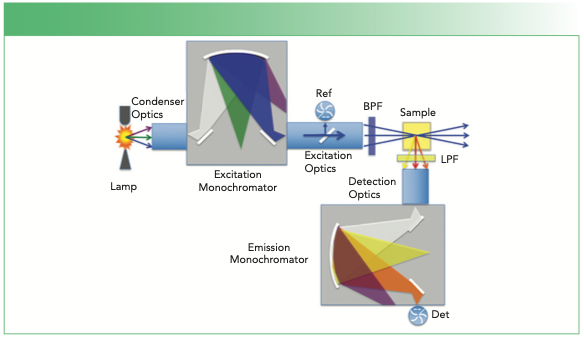
All spectrofluorometers have a light source with a wavelength selector, optics that transfer the light to a sample, optics that pick up light from the sample, a wavelength selector for detection, and one or multiple light detectors. A common instrument layout for the optical bench of a spectrofluorometer is shown in Figure 1.
FIGURE 1: Instrument layout for a common commercial spectrofluorometer. A xenon arc lamp is illustrated as the light source that is focused into an excitation monochromator. This unit selects a narrow excitation wavelength band that is focused into a sample in a cuvette. Fluorescence is emitted at longer wavelengths and directed into an emission monochromator, where a narrow emission wavelength band reaches a detector (Det). A reference photomultiplier tube (Ref) measures a fraction of the excitation light to correct for excitation source intensity, and a bandpass filter (BPF) and longpass filter (LPF) prevent stray light from the excitation monochromator from being detected. The 90-degree angle between rays entering the sample and the fluorescence emerging toward the detector defines a horizontal plane.All light rays polarized in this plane at the sample are called horizontally polarized, while rays polarized perpendicularly to this plane at the sample are called vertically polarized.

In a classic instrument, the light source might be a broadband high-pressure xenon arc lamp. For this type of light source, a housing with mirror optics and a condenser lens are used to transfer the brightest part of the emission from the arc to the entrance slit of an excitation monochromator. The excitation monochromator selects mostly a narrow band of wavelengths that exit toward the sample. Many instruments include a pick-off mirror in this region that directs light to a reference detector (often a photomultiplier tube) to compensate for the varying intensity of light at each wavelength emerging from the excitation monochromator. Most spectrofluorometers have a provision for a bandpass filter (BPF) to clean up the excitation light, after which the excitation then encounters a sample. The sample is often a solution of an analyte in a 1-cm pathlength fluorescence cuvette.
Fluorescence from the sample emerging at right angles to the excitation is collected by more optics. A longpass filter (LPF) is frequently used here to remove any scattered excitation light from the emission before it focuses on the entrance slit of an emission monochromator. Wavelengths are again selected and a narrow band of emission wavelengths is focused to a detector, which is often a red-enhanced photomultiplier tube.
The Common Errors
The most common substantial errors we observe in spectrofluorometry are as follows: a) poor choices of excitation and emission wavelengths leading to noisy spectra; b) a poor choice of the sample concentration leading to inner-filter effects; c) a poor choice of the spectral bandwidth (SBW) and step size leading to an unfaithful reproduction of the true spectrum, or long, noisy measurements; d) a poor choice of sample cell or solvent that obstructs the analyte spectrum; and e) detecting scattered light that leads to artifacts in the spectra.
Procedure: Absorption → Emission → Excitation
You can avoid all of these problems by beginning studies with a good quality absorption spectrum of the analyte recorded on a spectrophotometer using the same sample cuvette you intend to use for spectrofluorometry, ideally with a SBW of 2 nm or better. This measurement helps you select the best choices for excitation wavelengths, the likely range for emission wavelengths, an appropriate concentration, and an appropriate SBW and step size. It confirms that the sample cell and solvent are suitable. Finally, it allows you to select conditions that avoid most problems with scattered light.
If you are planning to record fluorescence emission and excitation spectra for a compound in solution, the best procedure for getting your data right the first time is to do the following in order:
- use a spectrophotometer to collect an absorption spectrum of the sample
- record a fluorescence emission spectrum of the sample based on information in the absorption spectrum
- record a fluorescence excitation spectrum based on the information in the absorption and fluorescence emission spectra.
Example
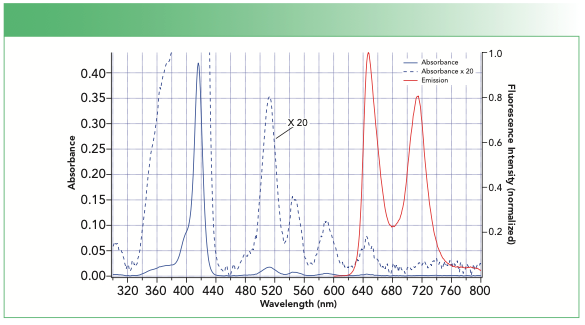
As an example, let us consider the following absorption and fluorescence spectra (Figure 2) for tetrakis(4-carboxyphenyl)porphyrin (TCPP). Consider the absorption spectrum recorded in our intended fluorescence cuvette and solvent first. The fact that we can see the absorption spectrum tells us that ethanol and the quartz sample cell are appropriate for the measurement through this range of wavelengths. If the solvent or cuvette absorb light, the absorption spectrum will either go off-scale or will be nothing but random noise.
FIGURE 2: (Blue solid line) Absorption and (red solid line) fluorescence emission spectra of tetrakis(4-carboxyphenyl)porphyrin in ethanol in a quartz fluorescence cuvette. The absorption spectrum multiplied by 20 is shown as a dashed blue line.

The absorption spectrum itself tells us that we could potentially excite TCPP at most wavelengths below about 660 nm because it has absorption throughout the region, although the best initial choice of excitation wavelength is likely near 417 nm because that is where the strongest absorption is.
Our next step would be to record a fluorescence emission spectrum using our selected excitation wavelength. The absorption spectrum does not give us direct information on the wavelength range where the strongest emission will occur in our fluorescence or phosphorescence spectrum. But even this is guided by our absorption spectrum, because it tells us what wavelength range to consider.
The longest wavelength absorption we see for TCPP has a maximum near 645 nm; our fluorescence will likely not be at a significantly shorter wavelength (in fact this molecule has its apparent emission maximum at nearly the same wavelength, which is unusual). Because our selected excitation wavelength of 417 nm is pretty far below 645 nm, we might suggest recording our first fluorescence emission spectrum beginning at 600 nm to start.
The absorption spectrum also tells us what concentration of analyte to use. The peak absorbance at 417 nm in Figure 2 is near A = 0.42. That is far too high, and as a result, we should dilute the sample so that its peak absorbance is in the range A = 0.05–0.1 before spectrofluorometry, which avoids a phenomenon known as an inner-filter effect.
The absorption spectrum further helps us choose the SBW for our fluorescence emission spectrum. In Figure 2, we observe that the sharpest spectral feature has a full width at half maximum (fwhm) near 10 nm. This is much broader than the SBW of the spectrophotometer we used for the absorption measurement, so we can feel confident this represents something inherent to our analyte. We should not use any SBW broader than that, and probably should start a little better—for instance, a SBW of 5 nm. As a first guess, we can use a SBW of 5 nm for both the emission monochromator and the excitation monochromator. The maximum step size for the measurement follows directly from our SBW: We should record a minimum of two points in each SBW. If the SBW is 5 nm, it is convenient to choose a step size of 1 or 2 nm.
The absorption spectrum also helps us address the issue of scattered light. There are two types of scattered light problems that we face, but the first and most obvious is because of the second-order transmission of light in the emission monochromator. For example, if your emission monochromator is set at a wavelength of 834 nm, this means it transmits light at a wavelength of 834 nm to the detector in the first order; however, it can also transmit light at 417 nm in the second order. Running our fluorescence emission spectrum through 834 nm could produce a giant spike in our spectrum because of scattered excitation that could easily saturate our detector. The second, less obvious scattered light problem is stray light in our excitation and emission monochromators. This stray light can cause a baseline artifact, which could be important if the spectrum is weak.
Both of these stray light problems can be avoided with optical filters that clean up out-of-band light from your excitation source and prevent the excitation from reaching your emission monochromator. A BPF that transmits 417 nm light, but blocks shorter and longer wavelengths, and a LPF that blocks 417 nm light, but transmits 600 nm wavelength light and beyond, will prevent scattered light from impacting the measurement at all. If you only have a longpass filter, that is still helpful; if you have no filters at all—and many spectrofluorometers do not come with them automatically—then avoid running the emission monochromator to a wavelength that is an integer multiple of the excitation wavelength.
We’re now ready to record our fluorescence emission spectrum, shown in Figure 2 as a red curve.
Our fluorescence emission and absorption spectra can then help us decide how to record a fluorescence excitation spectrum. For example, in our fluorescence emission spectrum of TCPP above, there are two large fluorescence maxima, one at 646 nm and another at 713 nm. But the absorption spectrum tells us that our fluorescence excitation spectrum will likely continue to ~660 nm. It makes sense then to choose 713 nm as our detection wavelength and record our excitation spectrum from 360 nm (below that could potentially produce a second-order peak) to 670 nm. A LPF that transmits 713 nm but blocks below 670 nm will help us avoid most light scattering problems, and we have already selected a SBW and step size for our measurement, so a good quality fluorescence excitation spectrum can then be acquired.
Improving the Result
If you decide you want better data than this procedure provides, you can return and adjust the SBW separately for excitation and emission spectra. For example, the SBW for the excitation source can usually be increased when you are recording a fluorescence emission spectrum, and the SBW for the emission detector can be increased when you are recording a fluorescence excitation spectrum. In addition, the integration time or dwell time at each measurement point can be increased from the default offered in commercial software. Each of these changes will increase the measurement signal-to-noise ratio.
Conclusion
The procedure we provided here will allow you to record good quality spectra in most cases in your first measurement. Part 2 of this three-part series will focus on generating data that can be reproduced on different instruments. Part 3 will discuss how some samples can be responsible for making data irreproducible, even when everything else was "done right the first time".
Resources We Recommend
(1) J.R. Lakowicz, Principles of Fluorescence Spectroscopy (Springer, Boston, Massachusetts, 3rd Ed., 2006).
(2) J.D. Ingle, Jr. and S.R. Crouch, Spectrochemical Analysis (Prentice-Hall Inc., Englewood Cliffs, New Jersey, 1988).
Caitlyn English, Zechariah Kitzhaber, Joshua Williams, Amanda Humphries, and M.L. Myrick are with the University of South Carolina, in Columbia, South Carolina. Direct correspondence to: MYRICK@mailbox.sc.edu ●

New Study Reveals Insights into Phenol’s Behavior in Ice
April 16th 2025A new study published in Spectrochimica Acta Part A by Dominik Heger and colleagues at Masaryk University reveals that phenol's photophysical properties change significantly when frozen, potentially enabling its breakdown by sunlight in icy environments.
Tracking Molecular Transport in Chromatographic Particles with Single-Molecule Fluorescence Imaging
May 18th 2012An interview with Justin Cooper, winner of a 2011 FACSS Innovation Award. Part of a new podcast series presented in collaboration with the Federation of Analytical Chemistry and Spectroscopy Societies (FACSS), in connection with SciX 2012 ? the Great Scientific Exchange, the North American conference (39th Annual) of FACSS.
Can Fluorescence Spectroscopy Evaluate Soil Dissolved Organic Matter Dynamics?
February 20th 2025A new study published in Chemical Engineering Journal by researchers from Northeast Agricultural University in China reveals that biochar aging, influenced by environmental factors like UV exposure and wet-dry cycles, alters dissolved organic matter composition and affects its effectiveness in remediating cadmium-contaminated soil.
FT-IR Microscopy, Part 2: Mid-IR Sampling with DRIFTS, IRRAS, and ATR
February 14th 2025Fourier transform infrared (FT-IR) microscopy using reflection methods (diffuse reflection, reflection/reflection-absorption, or attenuated total reflectance) typically requires less sample preparation than transmission. However, optimal results will depend upon the sample and, in particular, the sample surface.
New Fluorescent Raman Technique Enhances Detection of Microplastics in Seawater
November 19th 2024A novel method using fluorescence labeling and differential Raman spectroscopy claims to offer a more efficient, accurate approach to detect microplastics in seawater. Developed by researchers at the Ocean University of China, this method improves both the speed and precision of microplastic identification, addressing a key environmental issue affecting marine ecosystems.