Impact of Measurement Protocol on ICP-MS Data Quality Objectives: Part II
The first part of this article focused on the fundamental principles of a scanning quadrupole and how measurement protocol can be optimized based on the data quality objectives of the analysis and in particular the compromise between limit of detection and sample throughput. Part 2 looks at different ways to assess detection capability when processing continuous signals generated by a conventional sample introduction system, and also transient signals produced by different types of sampling methods such as chromatographic separation techniques and nanoparticle size studies.
Detection capability is a term used to assess the overall detection performance of an inductively coupled plasma (ICP)–mass spectrometry (MS) instrument. There are a number of different ways of looking at detection capability, including instrument detection limit (IDL), limit of quantitation (LOQ), elemental sensitivity, background signal, method detection limit, and background equivalent concentration. Of these four criteria, the IDL is generally thought to be the most accurate way of assessing instrument detection capability, but it’s important to emphasize that it is not considered an assessment of real-world limit of quantitation. It is often referred to as signal-to-background noise, and for a 99% confidence level is typically defined as 3× standard deviation (SD) of n replicates (n = ~10) of the sample blank and is calculated in the following manner:

However, there are slight variations of both the definition and calculation of IDLs, so it is important to understand how they are being calculated if a comparison is to be made. So, for example, are they being run in single-element mode, using extremely long integration times (5–10 s) to achieve the highest-quality data, or in multielement mode using multielement standards? Whatever measurement protocol is used, it is generally acknowledged that the achievable LOQ of an analysis is approximated by multiplying the instrument detection limit by at least a factor of 10 and with some difficult samples, by a factor of 100. So, when comparing instrument detection capability, it is important to know and understand what measurement regime is being used.
Method Detection Limits
A more realistic way of calculating analyte detection limit performance in your sample matrices is to use the method detection limit (MDL). The MDL is broadly defined as the minimum concentration of analyte that can be determined from zero with 99% confidence. MDLs are calculated in a similar manner to IDLs, except that the test solution is taken through the entire sample preparation procedure before the analyte concentration is measured multiple times. This difference between MDL and IDL is exemplified in EPA Method 200.8 where a sample solution at 2–5 times the estimated IDL is taken through all the preparation steps and analyzed. The MDL is then calculated in the following manner:

where t = Student’s “t” value for a 95% confidence level and specifies a standard deviation estimate with n − 1 degrees of freedom (t = 3.14 for 7 replicates) and S = the SD of the replicate analyses.
Both IDL and MDL are very useful in understanding the capability of an ICP- MS system. However, regardless of the method used to compare instrument detection limits, it is essential to carry out the test using realistic measurement times that reflect your analytical situation. For example, if you are determining a group of elements across the mass range in a digested rock sample, it is important to know how much the sample matrix suppresses analyte sensitivity, because the detection limit of each analyte will be impacted by the amount of suppression across the mass range. On the other hand, if you are carrying out high-throughput multielement analysis of drinking or wastewater samples, you probably need to be using relatively short integration times (1–2 s per analyte) to achieve the desired sample throughput. Or if you are dealing with a laser ablation transient peak that perhaps lasts just a few seconds, it is important to understand the impact that the time has on detection limits compared to a continuous signal generated with a conventional nebulizer. In other words, when comparing detection limits, it is critical that the tests rep- resent your real-world analytical situation.
Analyte Sensitivity and Background
Elemental sensitivity is also a useful assessment of instrument performance, but it should be viewed with caution. It is usually a measurement of background-corrected intensity at a defined mass, and is typically specified as counts per second (cps) per concentration (ppb or ppm). However, unlike detection limit, raw intensity usually does not tell you anything about the intensity of the background or the level of the background noise. It should be emphasized that instrument sensitivity can be enhanced by optimization of operating parameters such as RF power, nebulizer gas flows, torch-sampling position, interface pressure, and sampler or skimmer cone geometry, but usually comes at the expense of other performance criteria, including oxide levels, matrix tolerance, or background intensity. So, be very cautious when you see an extremely high sensitivity specification, because it could be that the instrument has been optimized for sensitivity, and, as a result, the oxide or background signal might also be high. For this reason, it is unlikely there will be an improvement in detection limit unless the increase in sensitivity comes with no compromise in the level of the background.
It is also important to understand the difference between background and background noise when comparing specifications (the background noise is a measure of the stability of the background and is defined as the square root of the background signal). Most modern quadrupole instruments today are capable of 100–200 million cps per ppm of a mid-mass isotope such as rhodium (103Rh+) or indium (115In+) and <1–2 cps at a background mass where there are little or no spectral features (usually at 220 amu), However, some commercial instruments offer what is called a high sensitivity option with sensitivity in the order of 1 billion cps/ppm. This is a very attractive feature for many application areas, particularly when characterizing small inclusions on the surface of a geological mineral using laser ablation. However, when solution nebulization is being carried out, the additional sources of noise related to the sample introduction system (mentioned earlier) could have a negative impact on the background and the increased sensitivity might not produce a significant improvement in the detection capability.
Background Equivalent Concentration (BEC)
Another useful figure of merit that is being used more routinely nowadays is background equivalent concentration (BEC), defined as the intensity of the background at the analyte mass, expressed as an apparent concentration and is typically calculated in the following manner:

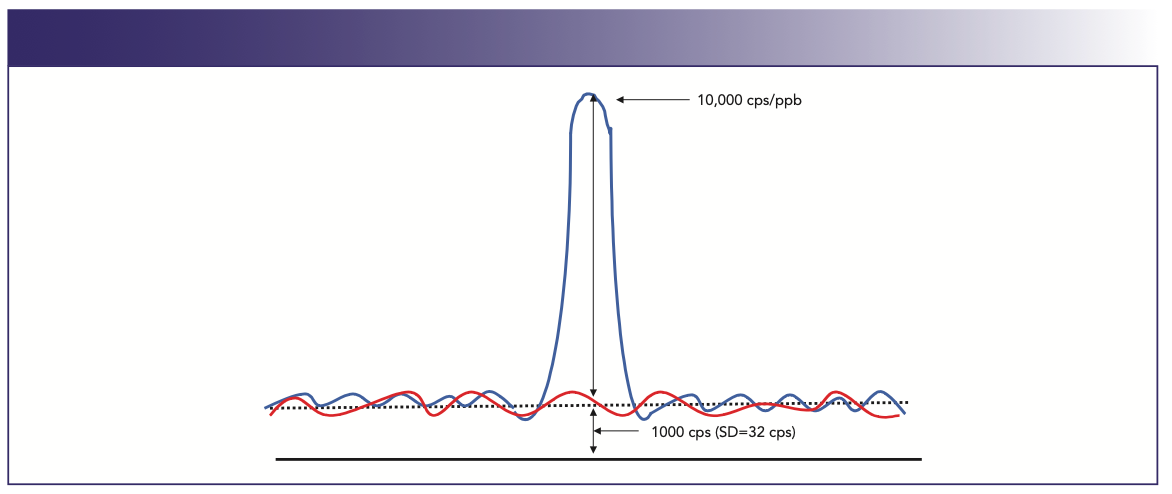
BEC is considered a more realistic assessment of instrument performance in complex sample matrices (especially if the analyte mass sits on a high continuum or background feature), because it gives an indication of the level of the background, defined as a concentration value. Detection limits alone can sometimes be misleading because they are influenced by the number of readings taken, integration time, cleanliness of the blank, and at what mass the background is measured—and are rarely achievable in a real-world situation. Figure 1 emphasizes the difference between detection limit and BEC. In this example, 1 ppb of an analyte produces a signal of 10,000 cps and a background of 1000 cps. Based on the calculations defined earlier, the BEC is equal to 0.11 ppb, because it is expressing the background intensity as a concentration value. On the other hand, the detection limit is 10 times lower because it is using the SD of the background (or the noise) in the calculation. For this reason, BECs are particularly useful when it comes to comparing the detection capabilities of techniques such as cool or cold plasma and collision–reaction cell interface technology, because it gives a very good indication of how well the polyatomic spectral interference has been reduced.
FIGURE 1: Detection limit is calculated using the noise of the background, whereas background equivalent concentration is calculated using the intensity of the background signal. Abscissa label is mass (m/z), and ordinate label is Intensity (cps).

Transient Peak Capability
Peak measurement protocol wouldn’t be complete without mentioning that some applications involve a signal that is transient in nature. Most ICP-MS applications involve a continuous signal generated by a sample that is being aspirated into the plasma by a conventional pneumatic nebulizer and spray chamber. However, for some analyses, the sample is being delivered over a finite period of time dictated by the sampling system. Common ICP-MS applications that generate transient signals include:
- nanoparticle size studies
- laser ablation of solid samples
- electrothermal vaporization (ETV) of small volume samples
- flow injection analysis of samples with high dissolved solids
- high performance liquid chromatography (HPLC) separation systems for speciation studies.
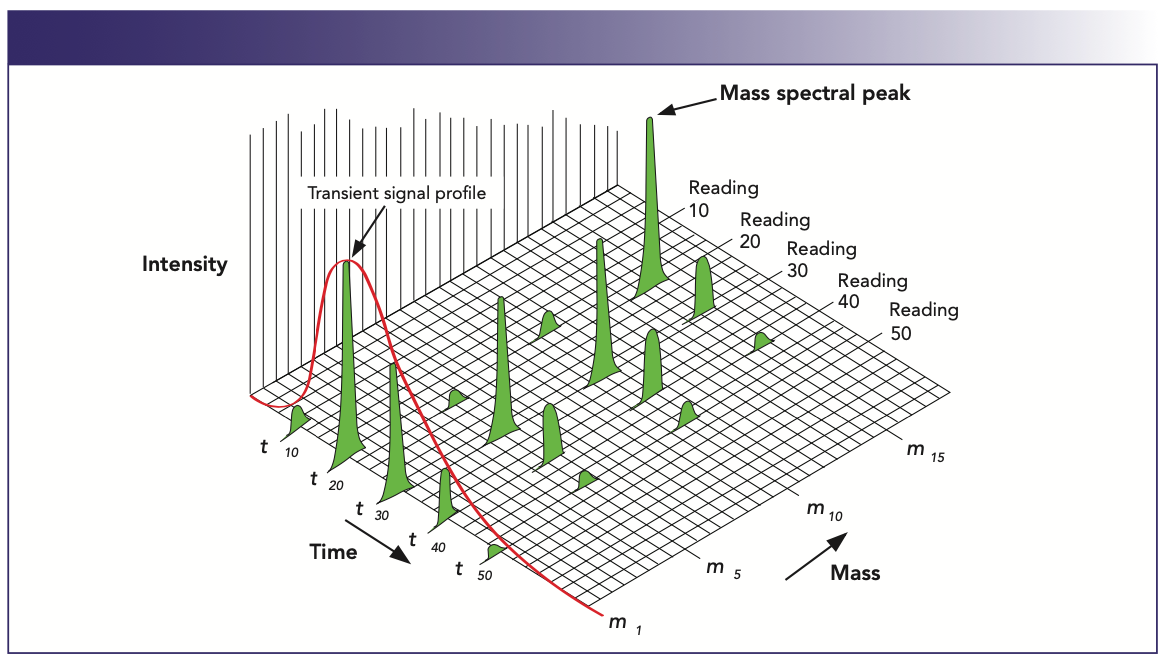
Depending on the sampling technology being used, the duration of the transient event can be anything from a few milliseconds (nanoparticle studies) to up to 10 min (HPLC separations). For that reason, it is critical to optimize the measurement time to achieve the best multielement S/N ratio in the sampling time available. This is demonstrated in Figure 2, which shows the temporal separation of a group of elemental species in a typical chromatographic transient peak. The plot represents signal intensity against mass over the time period of the chromatogram. When carrying out elemental speciation studies using ICP-MS, chromatography transient peaks typically last a few minutes, so if 3–4 species of the same element are being measured in duplicate, as is fairly common when characterizing different species of arsenic in water samples, there has to be a realistic understanding of the real-world LOQs, based on the available measurement time. And the more elements being separated the more challenging the application. So, to get the best detection limits for this group of multielement species exemplified in Figure 2, it is very important to spend all the available time quantifying the analyte peaks of interest (1).
FIGURE 2: Temporal separation of a group of elemental species in a transient peak (1).

This problem is even more challenging when the transient peak is lasting only a few milliseconds such as signals generated by metal-based nanoparticles studies. Nanoparticles, which are defined as particles of less than 100 nm diameter, are now being used in a variety of products, including scratch-proof eyeglasses, crack-resistant paints, transparent sunscreens, deodorants, stain-repellent fabrics, and ceramic coatings for solar cells using a variety of metals such as gold, silver, titanium, antimony, iron, and silicon. Unfortunately, they can get into the environment from water treatment plants, effluents, and industrial wastes and have a negative impact on surrounding ecosystem, affecting the health of animals and plants.
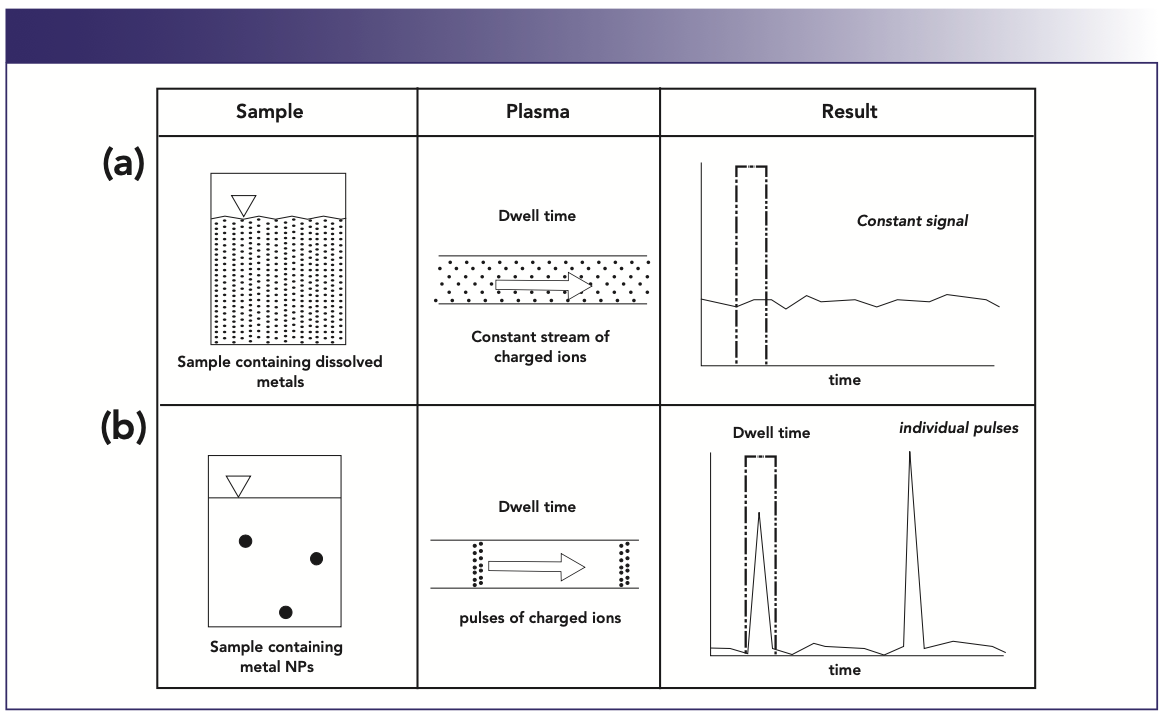
So instead of dealing with a continuous signal generated by metallic ions in solution, the nanoparticles generate a rapid transient signal, as shown in Figure 3. Figure 3a shows a constant signal generated by positively charged ions in solution. Because the signal is continuous it does not matter when the measurement dwell time is initiated to measure and quantify the analyte mass. However, Figure 3b shows a small number of metal nanoparticles suspended in a sample solution, which will generate pulses of charged ions. So the timing of the measurement is absolutely critical, because the individual pulses could be missed if the dwell time isn’t initiated at the right time. Depending on the size of the nanoparticles, the transient event often last less than a millisecond. So, in order to fully characterize the peak, dwell times in the order of 50–100 microseconds are required, with settling times as short as possible. In fact, when attempting to quantify the size of the nanoparticles from the number and intensity of the pulses, no settling time is the preferred option to maximize the measurement duty cycle (2).
FIGURE 3: Nanoparticle studies using quadrupole ICP-MS generate transient peaks of less than 1 ms.

So, to successfully carry out an analysis that generates a transient peak using a scanning quadrupole-based ICP-MS instrument, a great deal of flexibility is required to allow very short dwell and settling times to maximize the quality of the generated data. For this reason, the quadrupole scanning or settling time and the time spent measuring the analyte peaks must be optimized to achieve the highest signal quality, which basically involves optimizing the number of sweeps, selecting the best dwell time, and using short settling times to achieve the highest measurement duty cycle and maximize the peak S/N ratio over the duration of the transient event. If this is not done, there is a high likelihood that the quality of the generated data could be compromised. In other words, the data quality objectives of the analysis would need to be reassessed, because it is unrealistic to expect to carry out multielement or species quantitation at detection limit levels when dealing with such a short transient signal.
Conclusion
Although the cost of an ICP-MS system has dropped considerably over the past 38 years, it is still considered a fairly complex technique, requiring a very skilled person to operate it. Manufacturers of ICP-MS equipment are constantly striving to make the instrumentation simpler to operate, offer better interference reduction capabilities, design easy-to-use-software, and configure hardware components that are less complicated to clean and maintain. You have only got to look at the newer triple and multi-quadrupole instruments on the market today to realize that they all do an excellent job of maximizing the capabilities of the technique. However, even with all these enhanced problem-solving tools, it is still not a technique you can place in the hands of a complete novice and expect to get high quality data, particularly when it comes to analyzing difficult matrices.
For these reasons, the ICP-MS marketplace appears to be separating into two distinct categories. One is for more advanced users, which includes high performance techniques to reduce or minimize interferences and enhance detection capabilities in complex samples. The second category is targeted at more routine, high throughput applications. These instruments will be relatively simple to operate and easy to maintain and include built-in, standard operating methods or procedures to ensure that the desired application methodology is “bullet-proof” for the less-experienced users.
As the price for this “routine” category is slowly being eroded, it will most definitely attract more application areas to the technique, and as a result novice ICP-MS practitioners will be called upon to run the instrumentation. The challenge with opening up the technique to new application areas, such as those found in the pharmaceutical and cannabis industries, is that many of these operators will have very little experience developing ICP-MS methods. This makes it all the more reason why there is still a need for information in the public domain about the fundamental principles of how the technique works, its strengths and weaknesses, and how it’s applied to solve real-world analytical problems. This concern was the major incentive for writing this column on optimizing measurement protocol as well as giving a talk at a Spectroscopy magazine virtual symposium focusing on trace element detection limits and how they are impacted by the demands of the application (3). My goal is to educate and help ICP-MS practitioners with limited knowledge of the technique to better understand its analytical capabilities, and in particular, the balance between maximizing productivity and optimizing detection capability. I hope I have achieved that goal.
References
(1) K.R. Neubauer, P.A. Perrone, W. Reuter, and R. Thomas, Curr. Trends in Mass Spectrosc. 4(5), 209 (2006)
(2) C. Stephan and R. Thomas, Spectroscopy 32(3), 12–252017
(3) R. Thomas, Trace Element Analysis in the Real World: Practical Considerations Driving ICP-MS Detection Performance, “Symposium on Trace Element Detection Limits: What Every Spectroscopist Should Know,” Spectroscopy Magazine/Milestone Inc. webcast, September 23, 2021. http://www.spectroscopyonline.com/spec_d/trace.
Robert Thomas, the editor of the “Atomic Perspectives” column, is the principal of Scientific Solutions, a consulting company that serves the educational and writing needs of the trace element analysis user community. Rob has worked in the field of atomic spectroscopy and mass spectrometry for more than 45 years, including 24 years for a manufacturer of atomic spectroscopic instrumentation. He has authored more than 100 scientific publications, including a 15-part tutorial series, “A Beginners Guide to ICP-MS.” In addition, he has authored five textbooks on the fundamentals and applications of ICP-MS. His most recent book, Measuring Heavy Metal Contaminants in Cannabis and Hemp was published in September 2020. Rob has an advanced degree in analytical chemistry from the University of Wales, UK, and is a Fellow of the Royal Society of Chemistry (FRSC) and a Chartered Chemist (CChem). Direct correspondence to: SpectroscopyEdit@mmhgroup.com ●


High-Speed Laser MS for Precise, Prep-Free Environmental Particle Tracking
April 21st 2025Scientists at Oak Ridge National Laboratory have demonstrated that a fast, laser-based mass spectrometry method—LA-ICP-TOF-MS—can accurately detect and identify airborne environmental particles, including toxic metal particles like ruthenium, without the need for complex sample preparation. The work offers a breakthrough in rapid, high-resolution analysis of environmental pollutants.
Atomic Perspectives: Highlights from Recent Columns
March 3rd 2025“Atomic Perspectives,” provides tutorials and updates on new analytical atomic spectroscopy techniques in a broad range of applications, including environmental analysis, food and beverage analysis, and space exploration, to name a few. Here, we present a compilation of some of the most popular columns.