Insights Toward Standardization of the Analysis of Microplastics by Infrared Microscopy
Here we conduct an evaluation of significant operational parameters of IR microscopy for accurately determining the size of microplastics, with the overarching goal of outlining performance parameters that will help in the standardization of microplastics analysis.
Micro- and nanoplastics enter the environment as manufactured products in cosmetics and other industrial products, and as breakdown products of plastics of larger size (macroplastics). Recent estimates suggest that the mass of microplastics in aquatic habitats will surpass that of fish by 2050; therefore, plastic pollution is a major environmental issue faced at global scale. Marine scientists have been working in this field for over a decade, and more recently the study of microplastics has captured the attention of other scientists in the environmental field. Despite efforts focused on identifying, quantifying, and assessing the size of microplastics in the environment, standardized methods are lacking. As a result, studies cannot be compared or reproduced. Infrared (IR) microscopy has become an essential technique in the toolbox for the analysis of microplastics in environmental samples. In this work, we conducted a methodical evaluation of significant operational parameters of IR microscopy for accurately determining the size of microplastics, with the overarching goal of outlining performance parameters that will help in the standardization of microplastics analysis.
Plastic pollution is a major environmental issue faced at global scale. Micro- and nanoplastics enter the environment as manufactured products in cosmetics and other industrial products, and as breakdown products of plastics of larger size (macroplastics). According to a recent perspective paper (1), the most pessimistic estimates suggest that the mass of microplastics in aquatic habitats will surpass that of fish by 2050. Interest in the scientific community and public has exponentially increased in the past few years, resulting in a significant increase in the number of publications focused on this topic (2). Marine scientists have been working on this field for a decade, and more recently the study of microplastics has captured the attention of other scientists in the environmental field. Despite efforts focused on identifying, quantifying, and assessing the size of microplastics in the environment, standardized methods and agreement of reporting parameters are lacking (3). As a result, studies cannot be compared or reproduced. Common requests from scientists engaged in the field include the need for reference materials, proficiency tests and interlaboratory studies, and detailed descriptions of instrumental and spectral treatment parameters (2). Multiple international groups (2,3), scientific organizations (such as the Society of Environmental Toxicology and Chemistry), and standardization agencies (such as the American Society for Testing and Materials [ASTM] and the International Organization for Standardization [ISO]) are currently engaging in efforts to fulfill these requests.
A recent review published in Trends in Analytical Chemistry (4) provides an excellent summary of various techniques suitable of the identification of microplastics and their scope. Infrared (IR) microscopy has become an essential technique in the toolbox for the analysis of microplastics in environmental samples. IR microscopy is often used for two purposes: the identification and sizing of microplastics present in the sample. While lack of appropriate standard spectra in the libraries could cause challenges in proper identification, especially for weathered plastics, this problem can be overcome with custom-created libraries and analyzing specific regions of the spectra (unique peaks, valleys, and intensity ratios, to name a few). Therefore, the real challenge is to understand the capability of IR microscopy for microplastics analysis, mainly in terms of smallest measurable microplastic particle size.
The objective of the work presented here was to collect data to support current standardization efforts for the analysis of microplastics in environmental samples by IR microscopy. For this purpose, we conducted a methodical evaluation of significant operational parameters of IR microscopy for accurately determining the size of microplastics, including optical mode, number of scans, and background contribution from filters.
Materials and Methods
Reagents
Microplastic standards were purchased from Sigma-Aldrich. They were polymer based micro particles with various diameters: 100 µm polystyrene (P/N 59336), 50 µm polymethacrylate (P/N 74161), 50 µm polystyrene (P/N 74491) and 10 µm polystyrene (P/N 72986).
Three types of filters commonly used to hold the microplastics samples for Fourier transform infrared (FT-IR) spectroscopy studies were evaluated: a stainless-steel mesh filter (Utah Biodiesel Supply, 5 μm pore size), a cellulose ester filter (Whatman, 0.6 μm pore size) and a glass fiber filter (Whatman, 934-AH grade, 1.5 μm pore size).
Instrumental Conditions
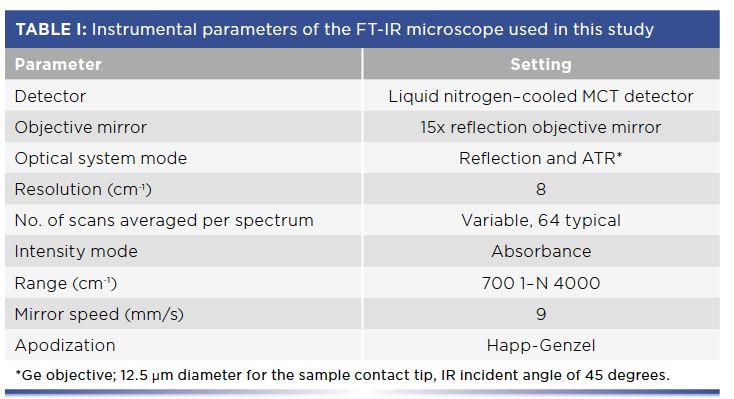
The measurements were carried out with a Shimadzu AIM-9000 FT-IR microscope in combination with an IRTracer-100 FT-IR spectrophotometer. Instrumental control and data acquisition were done automatically by the AIMSolution software. Data were collected in reflection mode and attenuated total reflectance (ATR) mode. When measuring in the reflection mode, background was acquired using a silver mirror. Experiments conducted in ATR mode were conducted with the Shimadzu ATR attachment with a Ge objective on the FT-IR microscope. The only post-processing steps performed were baseline correction of the data whose signal to noise ratio were calculated, and Kubelka-Munk transformation of the spectrum of the cellulose ester filter. The instrumental parameters are listed in Table I.
Sample Preparation
All samples were diluted first to 1 mL of Deionized water, except for the 100 μm polystyrene based microplastics sample. For reflection mode measurements, the samples were dispensed onto the filters and dried under ambient conditions. For ATR mode studies, 1–2 drops of the diluted samples or the 100 μm polystyrene-based stock sample were dispensed on a low-E microscope slide, and dried under ambient conditions.
Experimental Approach
To get a better understanding of types and distribution of the particles on the filters, infrared mapping measurements were carried out using the reflection mode on the FT-IR microscope. The information obtained from mapping is often qualitative; however, some quantitative information can also be obtained with further data analysis. In-depth measurements using more sensitive setup and parameters were carried out on areas of interest determined by mapping.
Samples containing microplastics of decreasing particle size (described in the section Reagents) were analyzed in reflection mode with the conditions listed in Table I. These experiments were repeated using three filter types (stainless-steel mesh filter, cellulose ester filter, and glass fiber filter) to assess the impact of the background spectra on the detection threshold of the particle sizes.
The reflection mode measurement of the samples was obtained as-is in the filter, and although this measurement mode allows for faster data acquisition with the ability to analyze multiple particles or an entire area automatically, it is susceptible to background noise from the filter element, surrounding particles, and matrix. Therefore, once the particles were identified using the reflection method, a more targeted measurement with better signal-to-noise ratio (S/N) using the ATR attachment on single particles was carried out. Samples containing microplastics of decreasing particle size were analyzed in ATR mode with the conditions listed in Table I. Because ATR is a contact-based measurement for surface measurement (no more than 2–5 µm into the surface), only particles pressed against the ATR crystal are measured, ensuring
higher accuracy.
Evaluation of S/N and Threshold of Detection Based on Sample Size
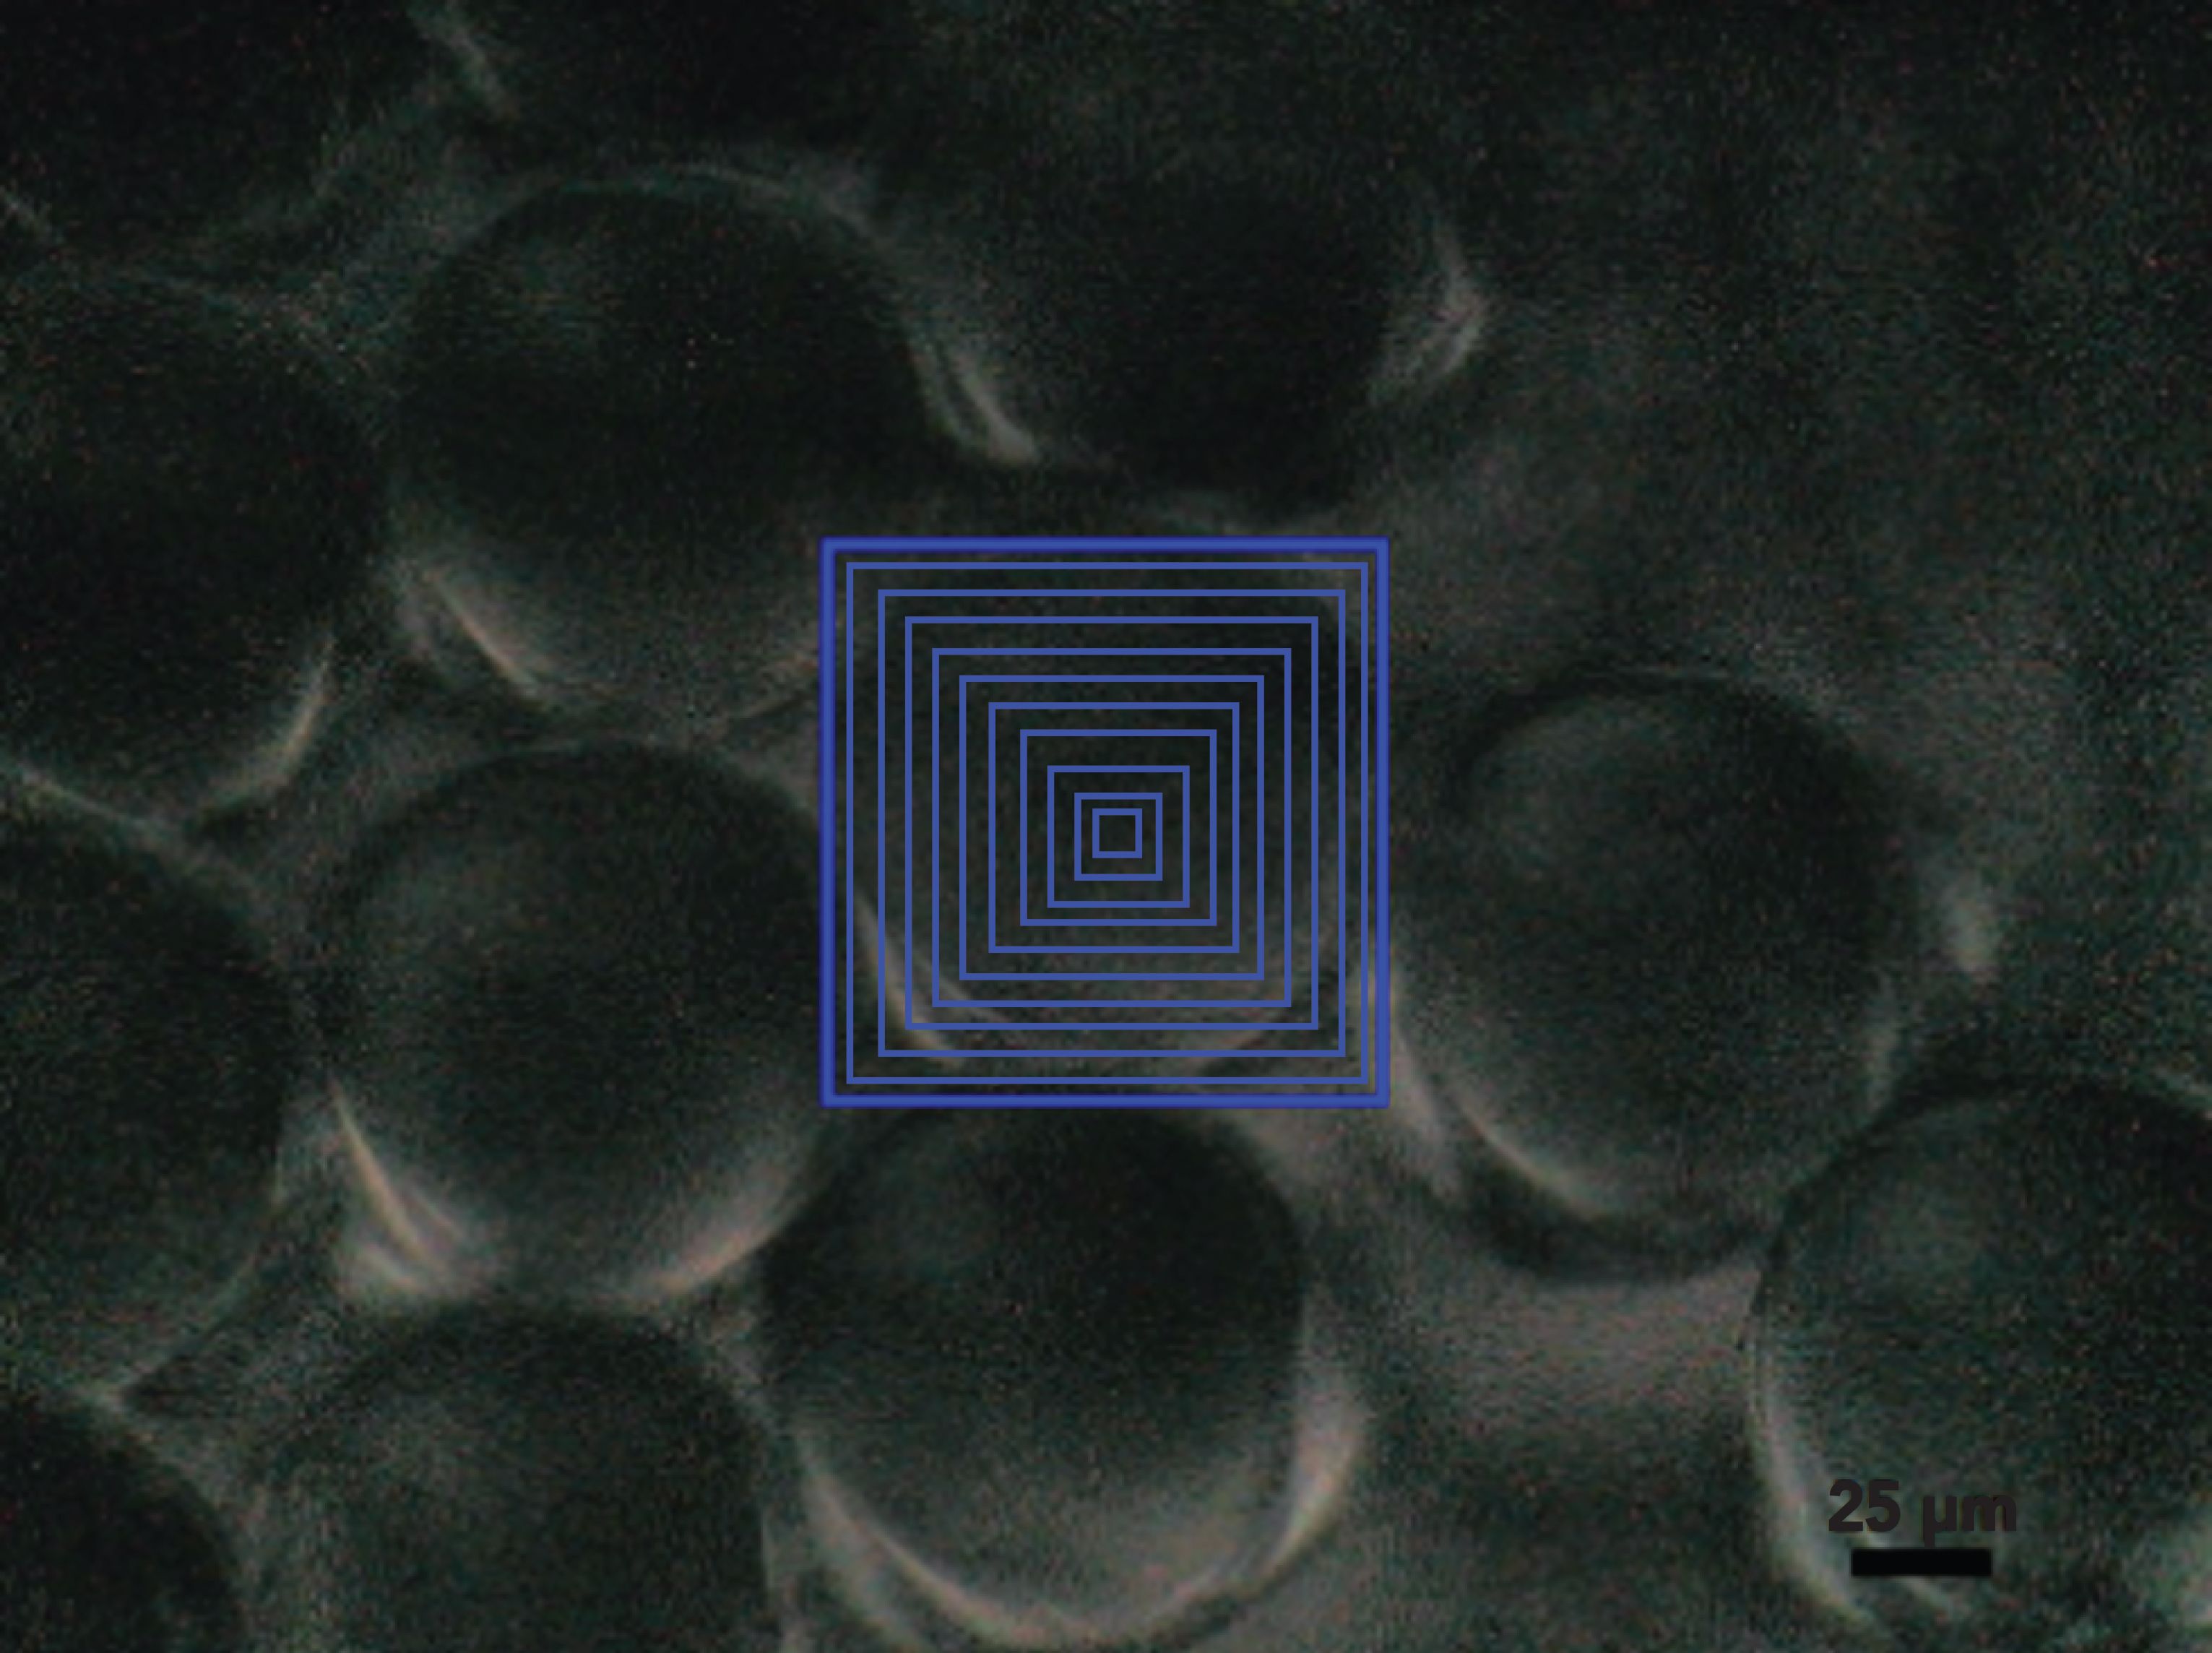
An experiment was conducted for IR spectral acquisition (reflection mode) on the 100 μm polystyrene-based sample with varying aperture sizes. The aperture sizes started from 5x5 μm, then increased to 10x10 μm. The aperture sizes were gradually increased from 10x10 μm to 100x100 μm, with an interval of 10 μm (Figure 1). This change in aperture size can be directly correlated to the difference in sample size. In addition, and more importantly, using the same particle but with different aperture sizes also ensured that any other experimental variations (inter-sample variation and instrument conditions) were eliminated. In a second experiment, the impact of the number of scans in the S/N of the measurement at each aperture size was evaluated.
Figure 1: Aperture settings over a 100 μm polystyrene-based particle from 5x5 μm (center) to 100x100 μm (outer box), increasing in intervals of 10 μm.
Spectral Search Using the FT-IR Polymer Library
Spectral searches for all spectra were performed using polymer libraries provided by the microscope software. The Shimadzu AIM-9000 FT-IR microscope adopts a score system from 0 to 1000 to report search results. In this study, the differential derivative algorithm was used, which calculates the primary differential of each data and compares the differential factor at each point with fitting of whole curves.
Results and Discussion
Reflection Mode Mapping Measurement Results
Microplastics samples dispensed on filters were scanned automatically using the mapping function of the AIMSolution Software. Aperture sizes were adjusted according to the dimension of the microplastics particles. The ratio of the signature peak intensity over the baseline intensity could be mapped to reflect the specific microplastics abundance at the locale. Figure 2 shows the mapping area settings and the resulting chemical mapping of microplastics samples of four different sizes on a stainless-steel mesh filter.
Figure 2: (Left column) Mapping area setting, and (right column) chemical mapping of microplastics samples on a stainless-steel mesh filter. (a,b) 100 μm polystyrene; (c,d) 50 μm polymethacrylate; (e,f): 20 μm polystyrene-based microplastics sample; (g,h): 10 μm polystyrene-based microplastics sample.
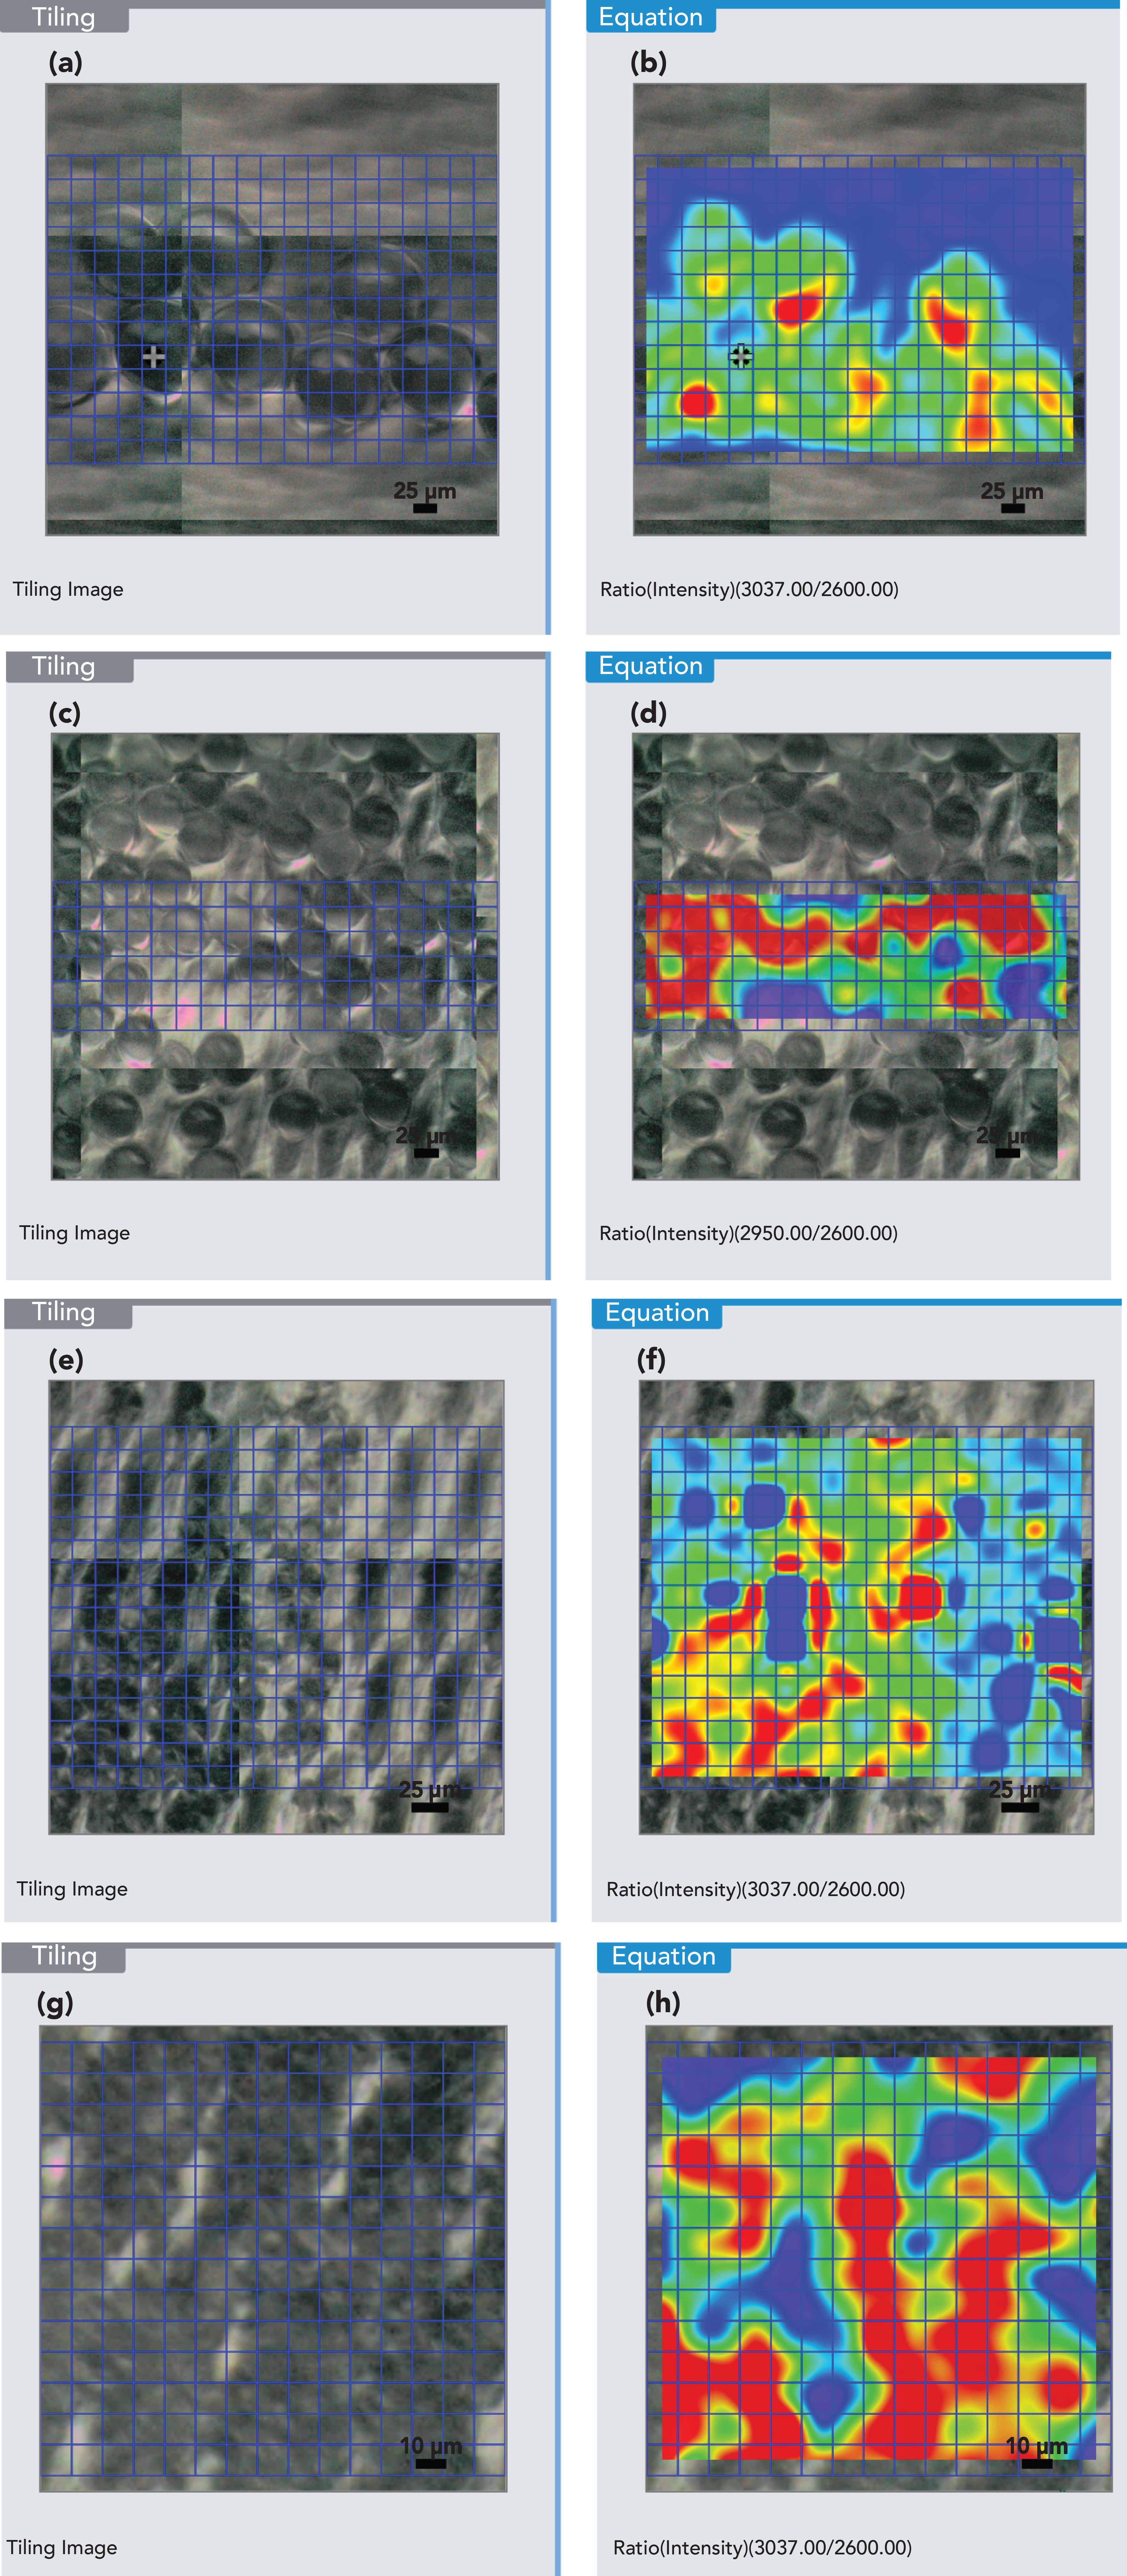
In Figure 2, it can be observed that mapping measurement in the reflection mode can provide relatively quick qualitative analysis of the microplastics samples in a potentially large area. When measuring particles with a size of 10x10 μm, it became challenging to capture focused images of the samples because the unevenness and the structure of the filters made it almost impossible for the microplastics particles to lie within the focal plane. As a result, the FT-IR spectra acquired for the 10 μm samples tended to reflect signals contributed by a subset of particles rather than that of an exact individual particle.
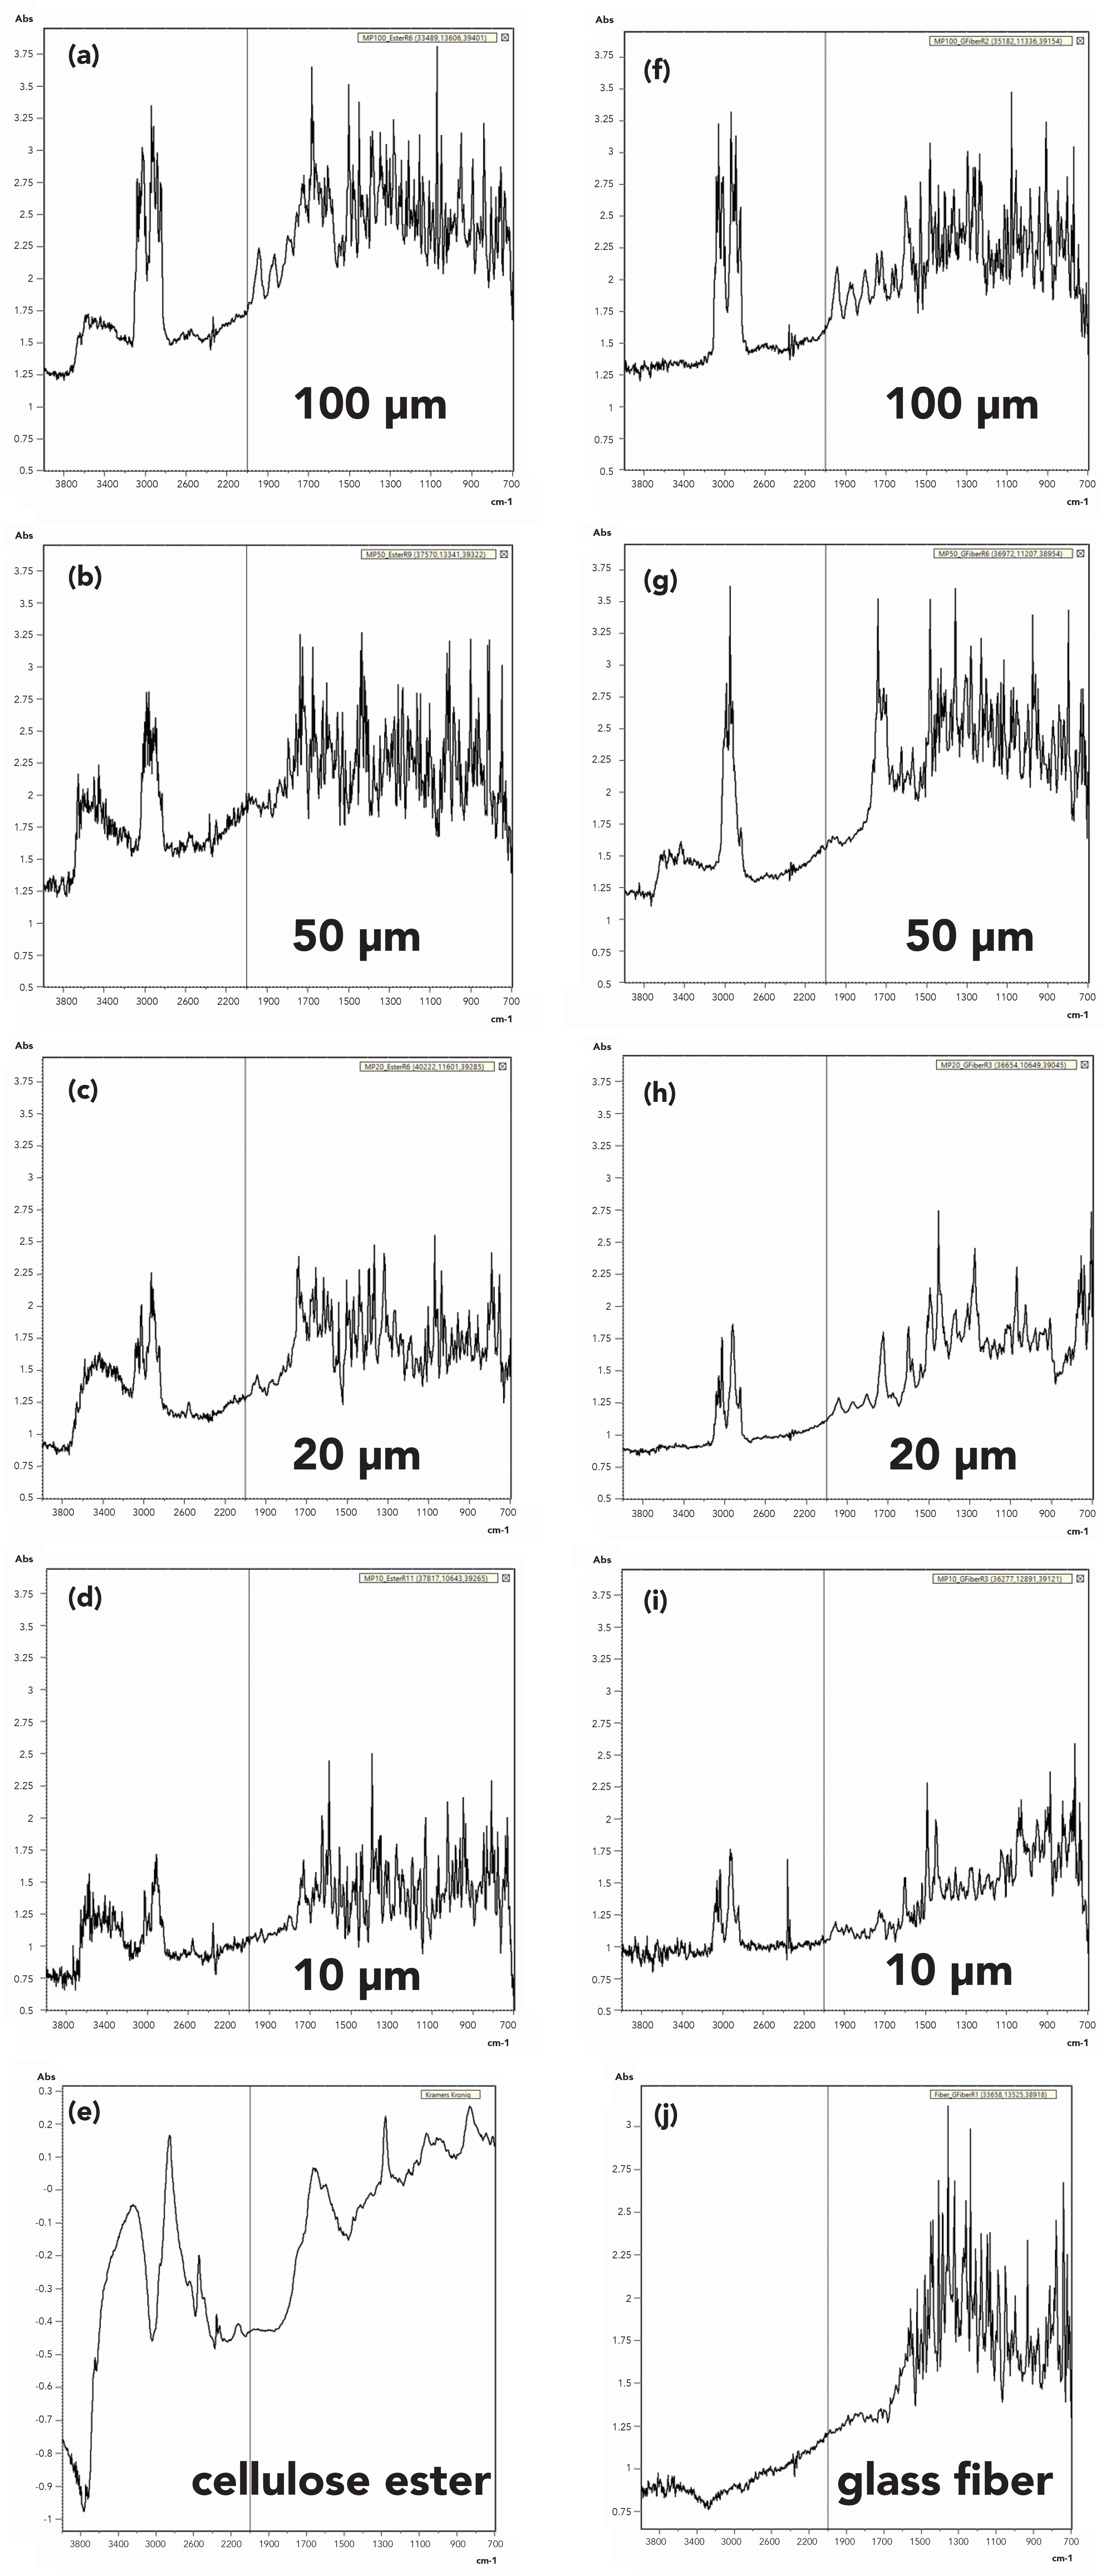
Similar reflection mapping measurements were obtained for microplastics samples held on a cellulose ester filter and a glass fiber filter. These filters were selected because they are commonly used in environmental laboratories for sample filtration. When those filters were used, signal interferences from the filters were evident (Figure 3). The cellulose ester filter showed IR peaks across the whole measured region (Figure 3e), whereas the glass fiber had IR absorption mainly in the low wavenumber region (Figure 3j). The stainless-steel mesh filter is highly reflective in the IR and can be considered to share similar features to that of the metal mirror used for background measurement; therefore, the spectra were not included in Figure 3. Figure 3 also demonstrates qualitatively how the background spectra negatively affects the detection threshold of the particle size. Overall, using the stainless-steel filter had the advantage of suppressing the signal contributions of the filters.
Figure 3: Representative IR spectra of microplastics samples held collected using a cellulose ester filter (a–e): (a) 100 μm polystyrene, (b) 50 μm polymethacrylate, (c) 20 μm polystyrene, (d) 10 μm polystyrene, (e) blank filter, (f–j): 100 μm; and on glass fiber filter, (g) 50 μm polymethacrylate, (h) 20 μm polystyrene, (i) 10 μm polystyrene, and (j) blank filter.
ATR Measurement Results
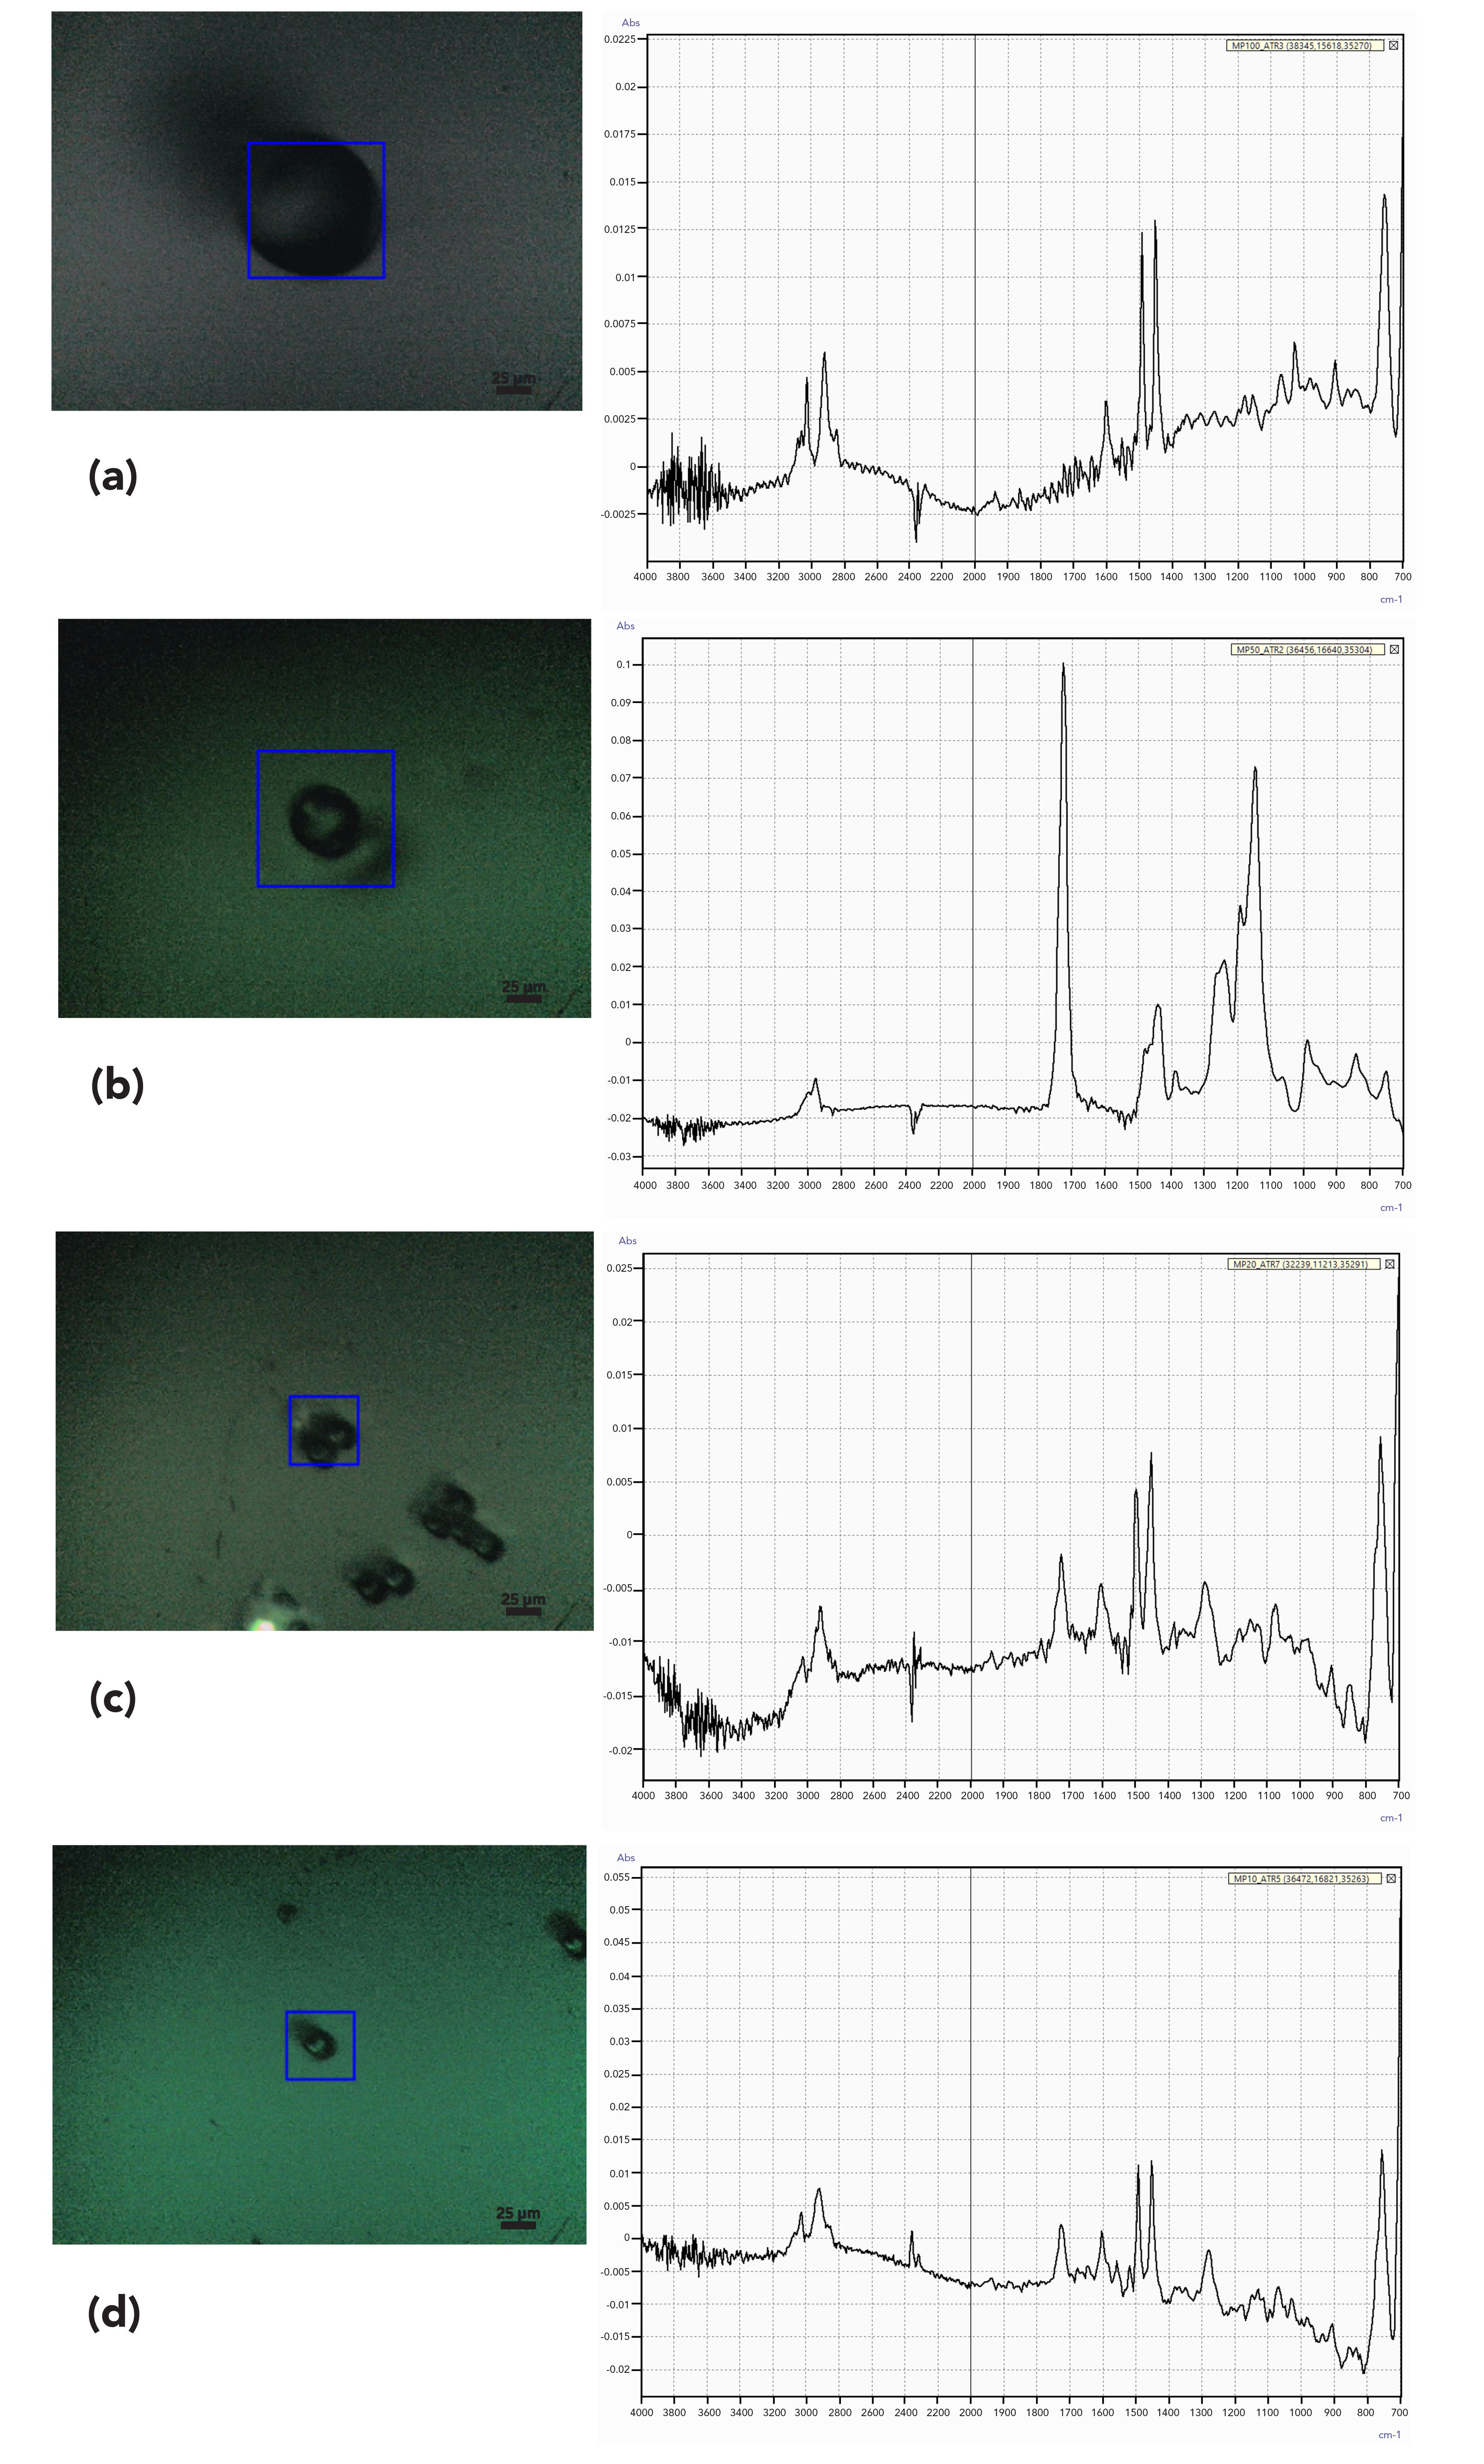
When measuring in the reflection mode, IR signals from the microplastics samples may be unable to be determined because of unwanted interference, like neighboring contaminants or substance attaching to the samples. It is desirable to measure in the ATR mode because it greatly assists in getting signal only from the targeted area. With a tip diameter of only 12.5 μm, the Shimadzu ATR attachment for AIM-9000 can acquire IR spectra from particles with high specificity. Figure 4 illustrates the microplastic samples and the FT-IR spectra acquired using ATR mode. However, samples were analyzed in triplicates; only one spectrum per particle size is included in the figure. The pictures on the left side are visible images captured for each of the samples analyzed. The FT-IR spectra are shown on the right side, and they illustrate the characteristic absorption bands of the microplastics. Spectral search was performed using polymer libraries provided by the microscope software; search results showed ≥75% match for the four samples analyzed, independently from the size of the particle. Qualitatively, the results demonstrate that FT-IR spectra of microplastics as small as 10 µm can be detected in ATR mode.
Figure 4: ATR measurement results from various microplastic samples: (a) 100 μm polystyrene, (b) 50 μm polymethacrylate, (c) 20 μm polystyrene, and (d) 10 μm polystyrene. Spectra are in wavenumbers (cm-1) vs. absorbance (AU).
Evaluation of S/N and Detection Threshold
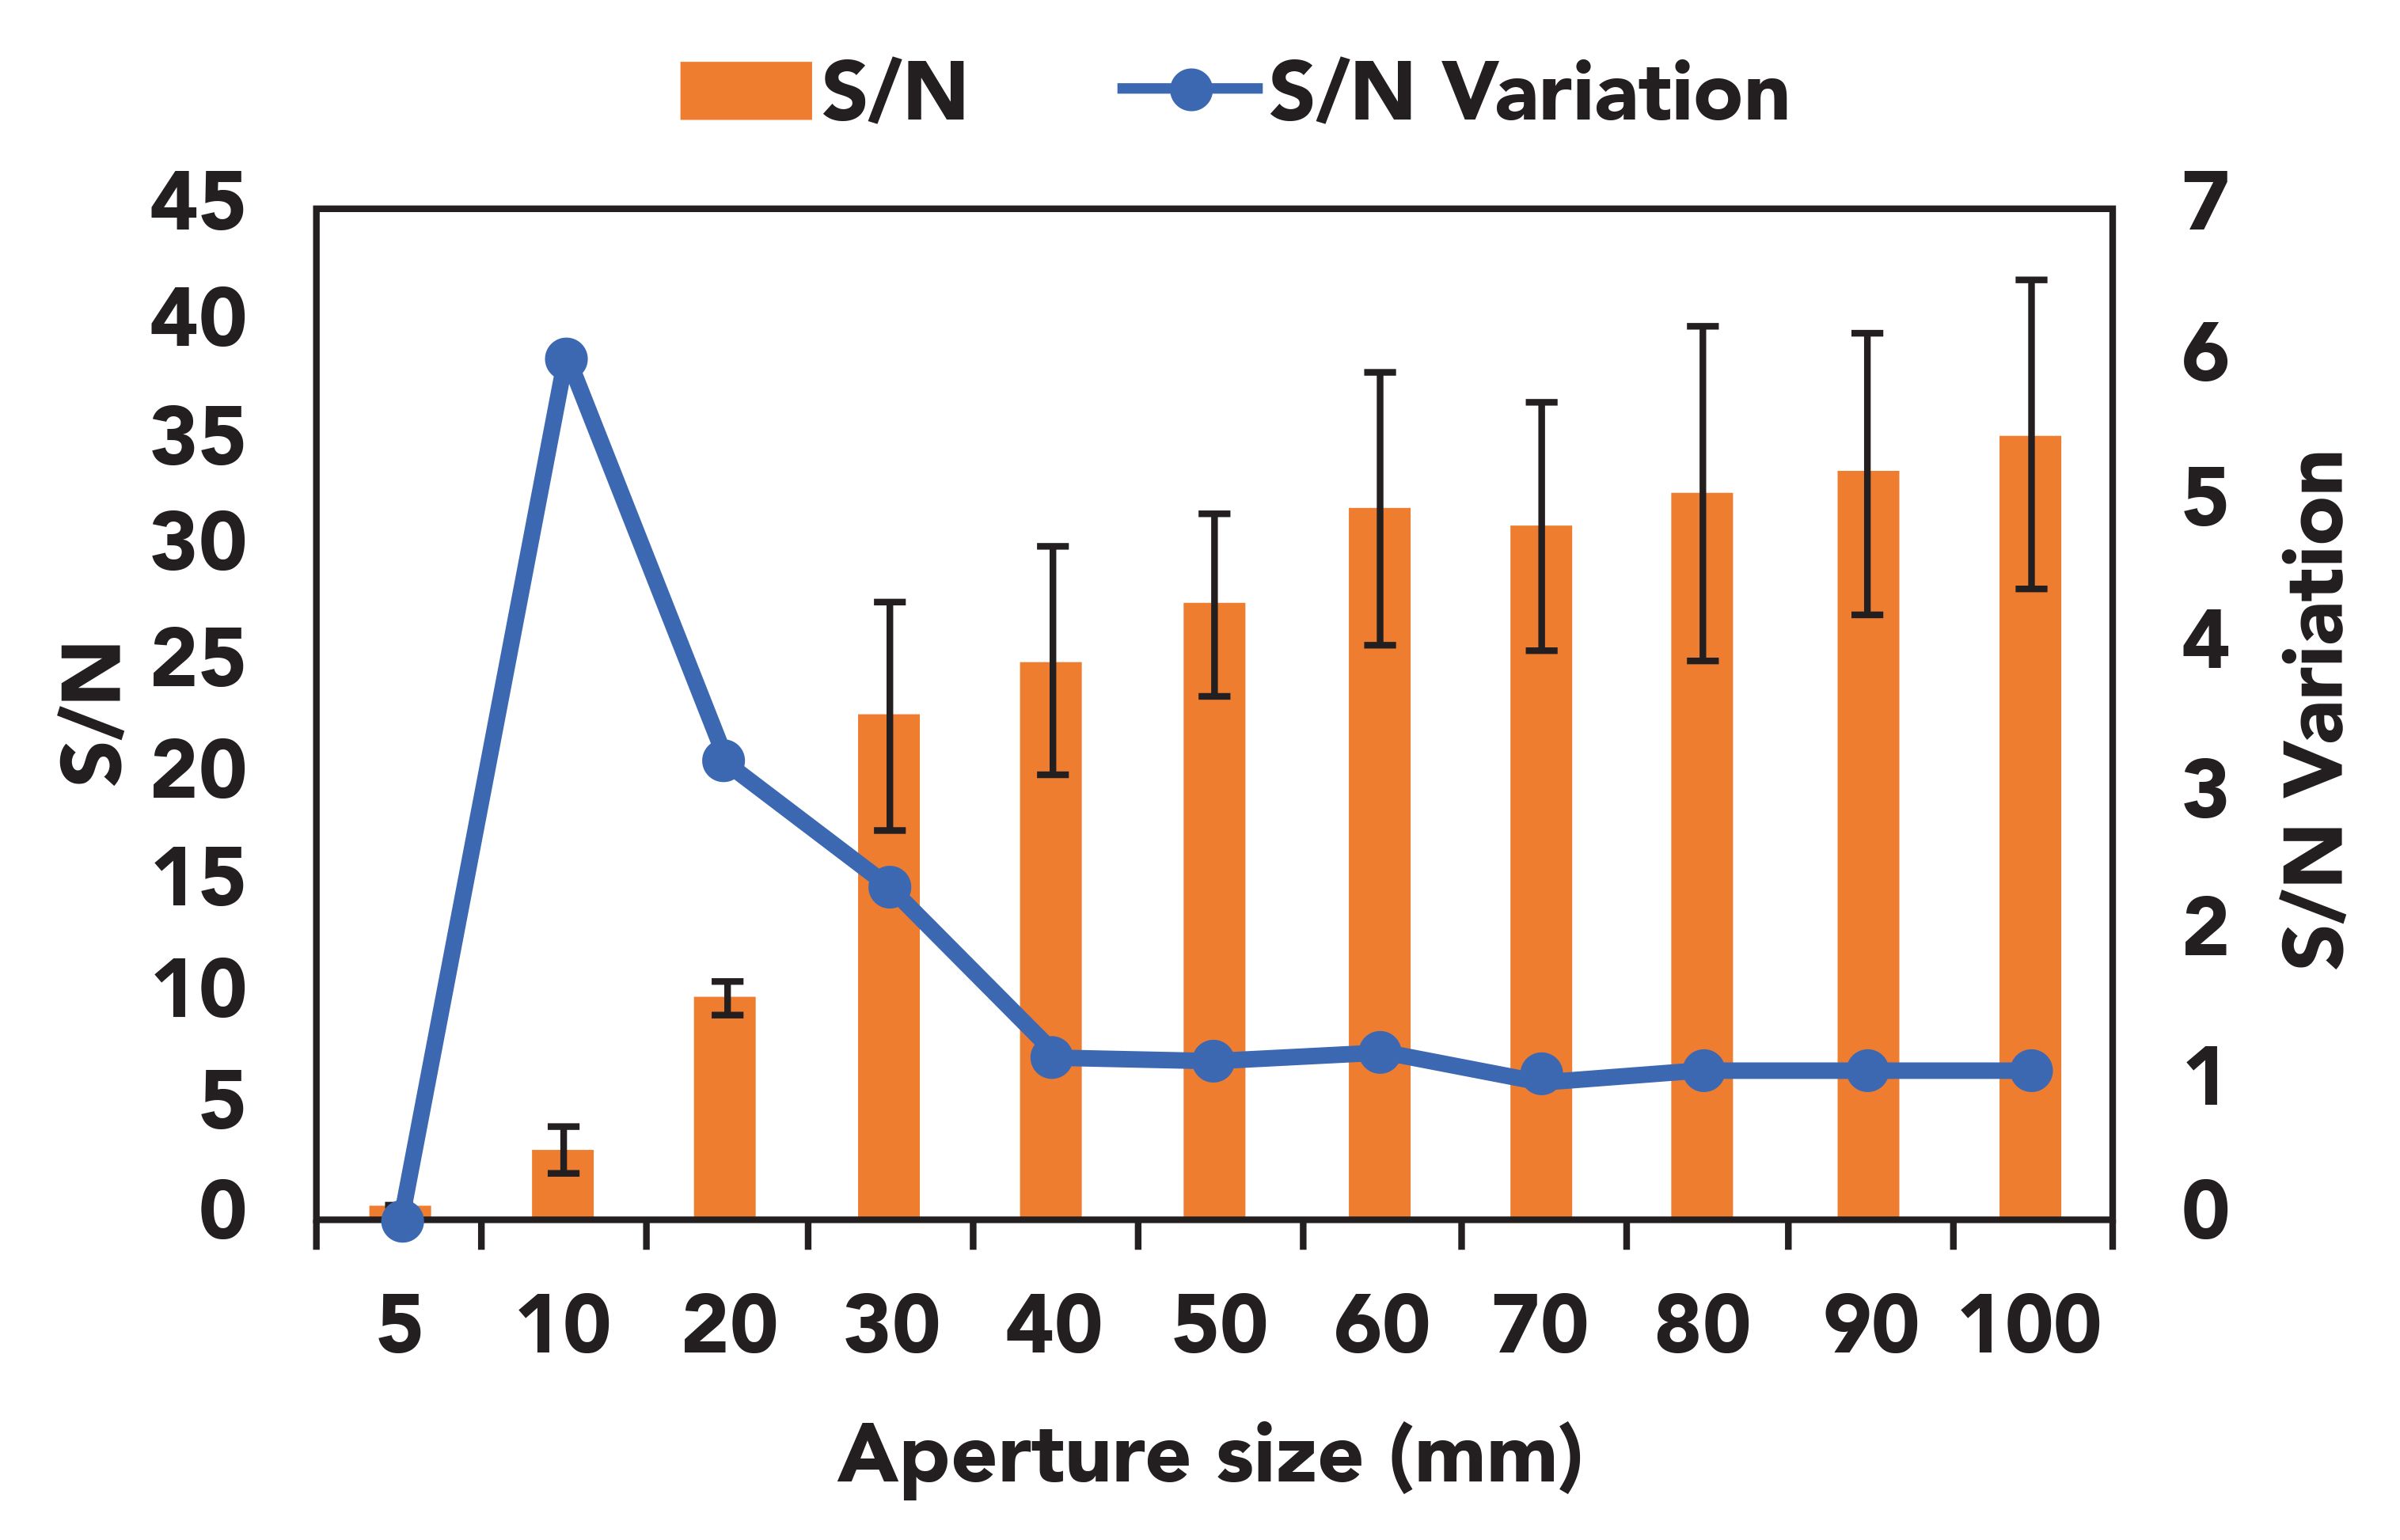
Measurements made in reflection mode are known to be more affected by the presence of interferences and background than ATR measurements; therefore, it can be assumed that the threshold of detection for determining the size of microplastics will be higher in reflection mode than ATR mode. To quantitatively determine the threshold of detection under the most challenging conditions, a series of experiments was conducted in reflection mode. FT-IR spectra were acquired on a 100 μm polystyrene particle, with variable aperture sizes gradually increasing from 5x5 μm to 100x100 μm (Figure 1); four replicate measurements at each aperture were performed. This change in aperture size can be directly correlated to the difference in sample size (See the Experimental Approach section for more details). Peak-to-peak S/N values at each aperture setting were evaluated; results are shown in Figure 4. Threshold of detection was determined based on measurements that presented a S/N > 3 (5). According to the results included in Figure 5, it can be concluded that when using the typical operational conditions of FT-IR microscopy (included in Table I), the smallest particle size that can reliably measured is 10x10 μm. From Figure 5, it was clear that the greatest increase in S/N took place when the sample (aperture) size was increased from 5x5 μm to 10x10 μm. After the sample (aperture) size was increased to 40x40 μm and higher, the rate of increase of S/N remained constant.
Figure 5: ATR measurement results from various microplastic samples: (a) 100 μm polystyrene, (b) 50 μm polymethacrylate, (c) 20 μm polystyrene, and (d) 10 μm polystyrene.
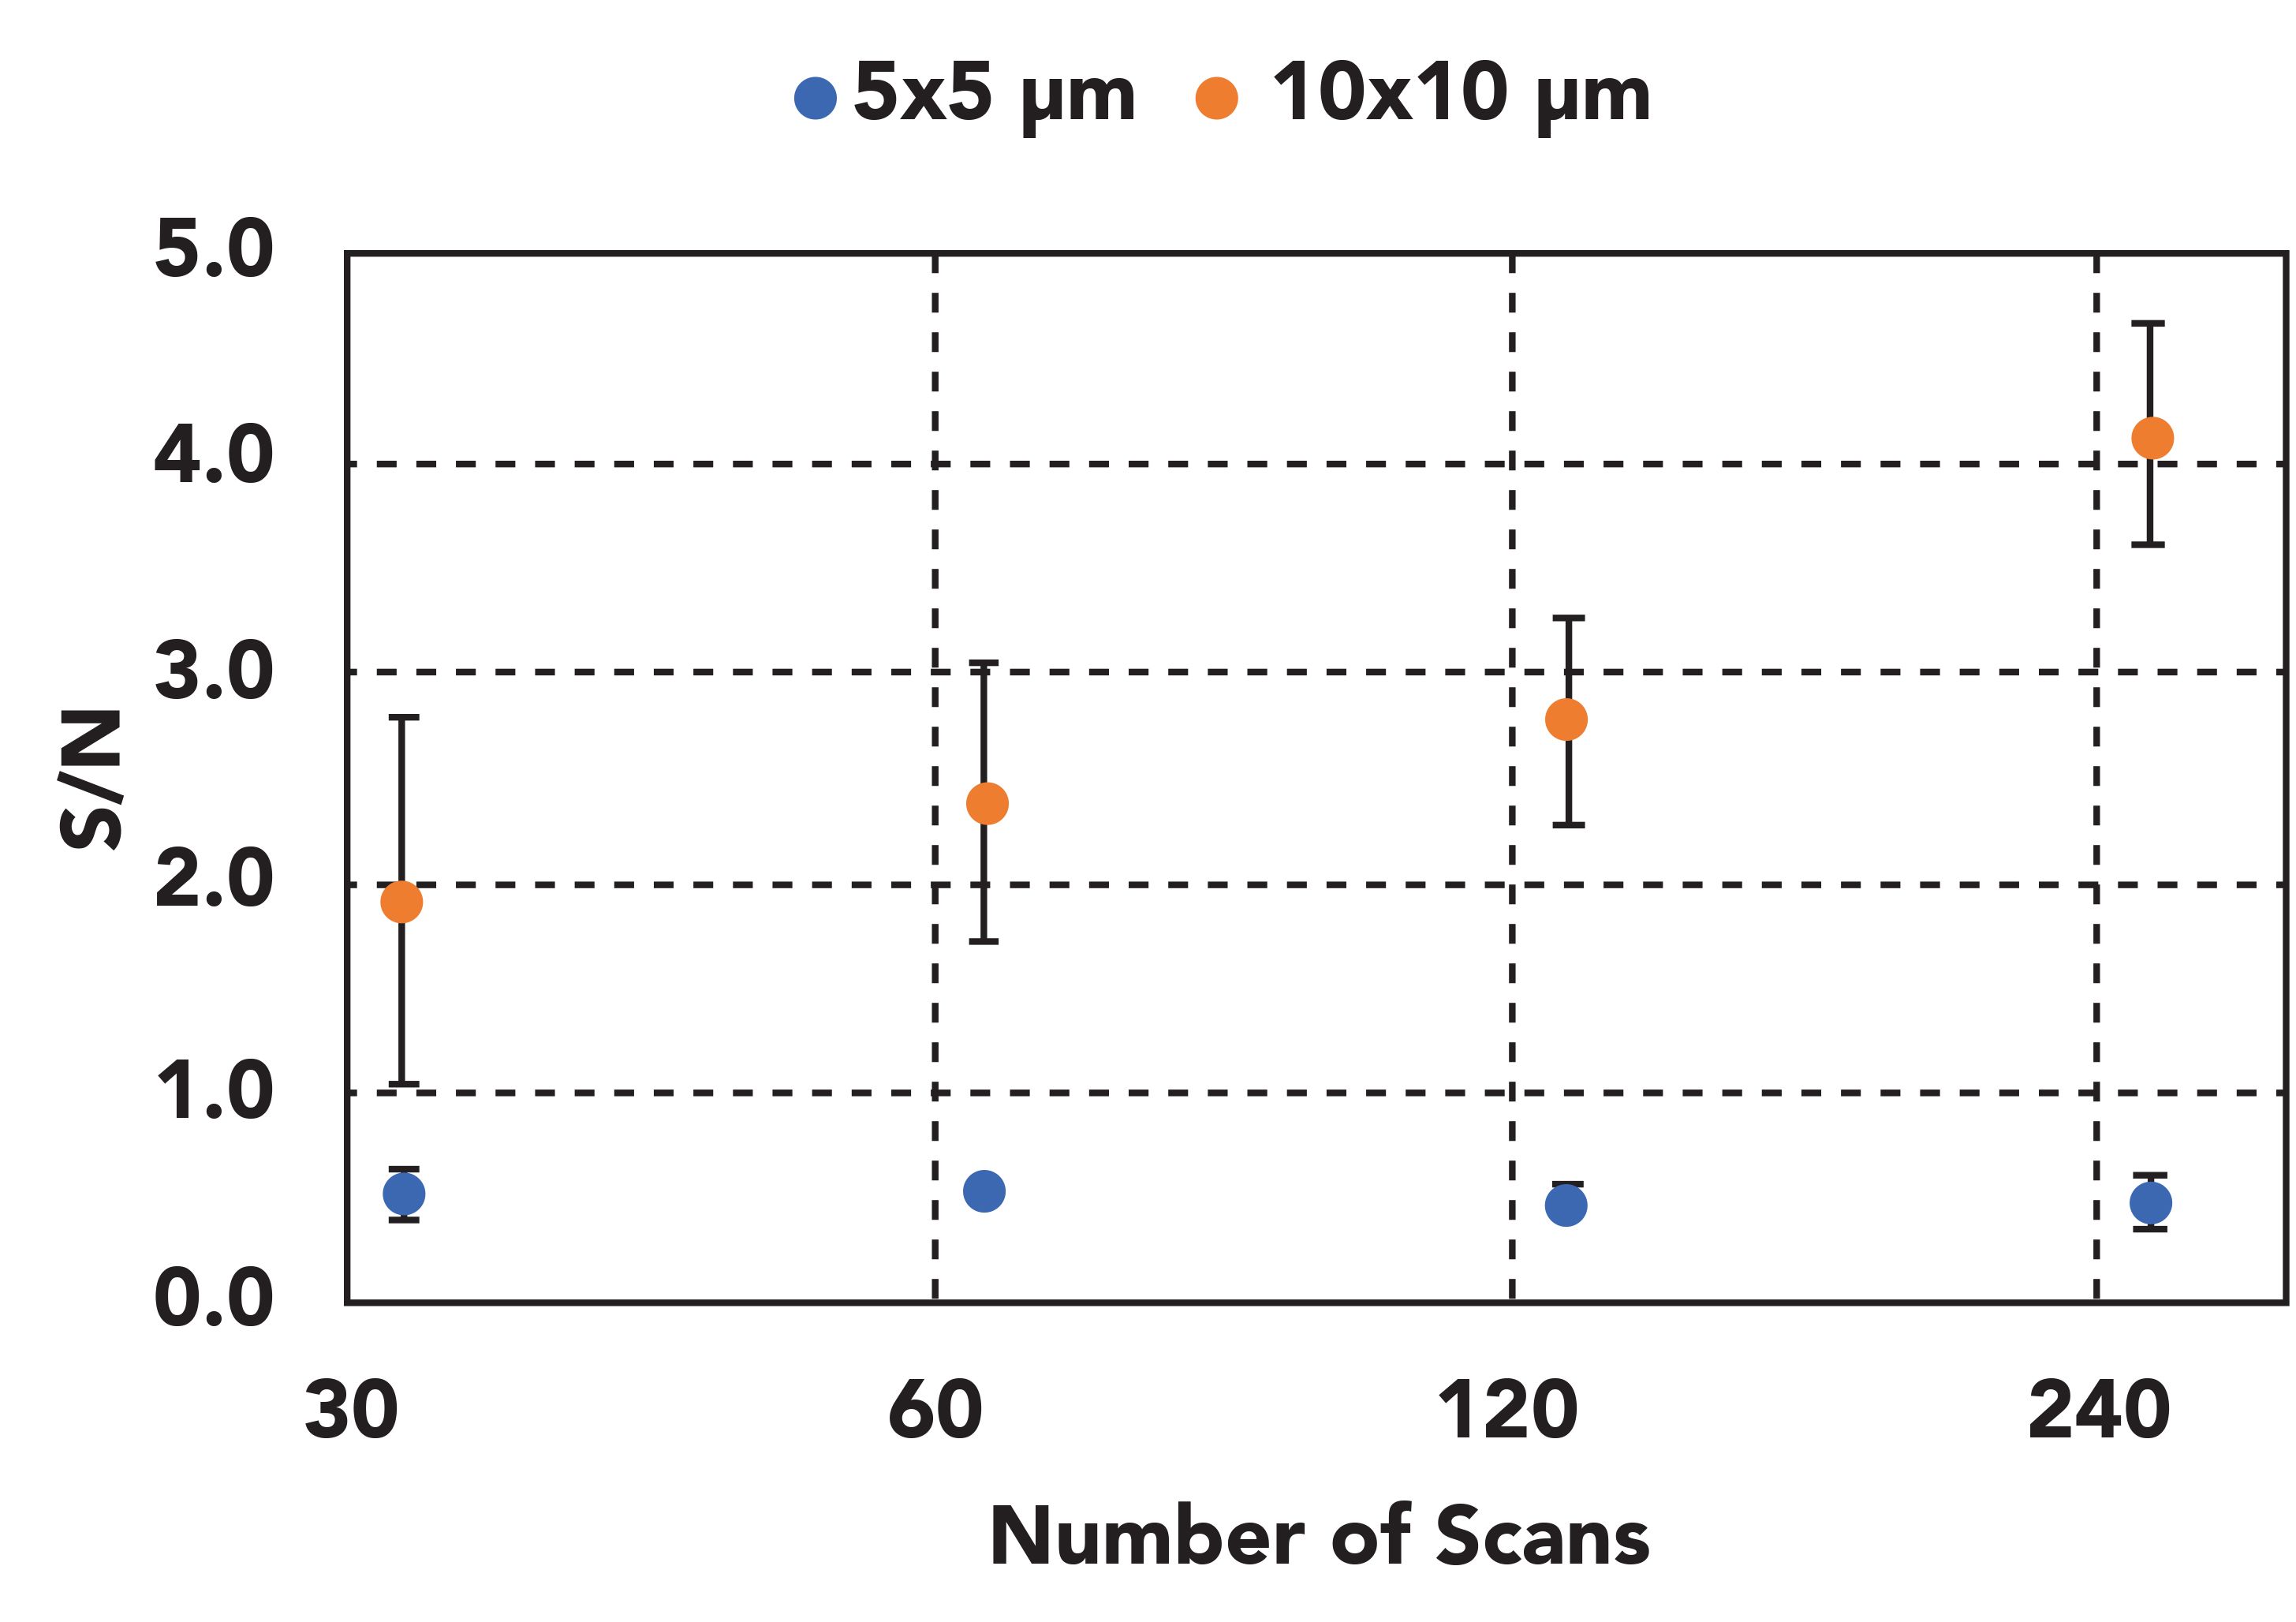
To further confirm the threshold of detection in terms of particle size, another study was carried out with sample sizes of 5x5 μm and 10x10 μm. In this study, the number of scans averaged to obtain a spectrum were gradually increased. The number of scans was set at 32, 64, 128, and 256 scans for the two sample sizes mentioned above. Measurements were replicated five times. Peak-to-peak S/N was evaluated at each measurement. As can be concluded from Figure 6, S/N in the 5x5 μm sample size did not show any substantial improvement with the increased number of scans. The averaged S/N values stayed close to 0.5, suggesting that only noise was observed. When the sample size was changed to 10x10 μm, S/N showed a noticeable increase as the number of scans increased. S/N should increase as more scans are averaged when a real signal is detected, this result further verifies that the signal from the 10x10 μm was real and that from the 5x5 μm sample was primarily noise; thereby, this confirms the threshold of 10x10 μm.
Figure 6: Variation of signal-to-noise (S/N) with number of scans at 5x5 μm and 10x10 μm aperture settings (average and standard deviation based on four replicated measurements).
This work demonstrates a series of method and experimental conditions in FT-IR microscopy in both reflectance and ATR mode for identification and accurate determination of the size of microplastics. The results presented in this paper are a subset of data being prepared for standardizing the analysis of microplastics in environmental samples. We have demonstrated that, by using typical operating conditions of FT-IR microscopy, it is possible to identify and distinguish between microplastic particles as small as 10x10 μm in dimension. This threshold value held true for both the reflection measurement method (which is faster, but can experience signal interference from neighboring particles and matrix) and the ATR method, which is specific to a particle to get “cleaner” measurements but is slower because of the setup involved. In the reflection measurement itself, this threshold value was determined and verified by two separate analysis methods, further verifying the capability of the technique.
References
- Y. Picó and D. Barceló, ACS Omega 4(4), 6709–6719 (2019).
- J.M. Andrade, B. Ferreiro, P. López-Mahía, and S. Muniategui-Lorenzo, Mar. Pollut. Bull. 154, 111035 (2020).
- W. Cowger, A. Booth, B. Hamilton, S. Primpke, et al., Appl. Spectrosc.0003702820930292 (2020).
- L.M.R. Mendoza and M.Balcer, Trends Anal. Chem.113, 402–408, (2019).
- K.L.A. Chan and S.G. Kazarian, Analyst 131, 126–131 (2006).
Liang Zhao, PhDis a Product Specialist in the Molecular Spectroscopy group at Shimadzu Scientific Instruments in Columbia, Maryland. Sudhir Dahal, PhD is the Product Manager of the Molecular Spectroscopy group at Shimadzu Scientific instruments in Columbia, Maryland. Ruth Marfil-Vega, PhD is the Environmental Market Manager at Shimadzu Scientific Instruments, in Columbia, Maryland. Direct correspondence to: rmmarfilvega@shimadzu.com.
AI Shakes Up Spectroscopy as New Tools Reveal the Secret Life of Molecules
April 14th 2025A leading-edge review led by researchers at Oak Ridge National Laboratory and MIT explores how artificial intelligence is revolutionizing the study of molecular vibrations and phonon dynamics. From infrared and Raman spectroscopy to neutron and X-ray scattering, AI is transforming how scientists interpret vibrational spectra and predict material behaviors.
Real-Time Battery Health Tracking Using Fiber-Optic Sensors
April 9th 2025A new study by researchers from Palo Alto Research Center (PARC, a Xerox Company) and LG Chem Power presents a novel method for real-time battery monitoring using embedded fiber-optic sensors. This approach enhances state-of-charge (SOC) and state-of-health (SOH) estimations, potentially improving the efficiency and lifespan of lithium-ion batteries in electric vehicles (xEVs).
New Study Provides Insights into Chiral Smectic Phases
March 31st 2025Researchers from the Institute of Nuclear Physics Polish Academy of Sciences have unveiled new insights into the molecular arrangement of the 7HH6 compound’s smectic phases using X-ray diffraction (XRD) and infrared (IR) spectroscopy.
