Multiparticle Analysis by Raman Microscopy
There are multiple circumstances where characterization of a collection of particles has value to analysts. In some environments, materials are plagued by particulate contamination that impacts product quality.
Volume 30 Number 2
Pages 14-24
There are multiple circumstances where characterization of a collection of particles has value to analysts. In some environments, materials are plagued by particulate contamination that impacts product quality. In the case of small-molecule pharmaceuticals, the solid form of the active pharmaceutical ingredient has to be controlled because of its impact on stability, bioavailability, and intellectual property protection. Raman analysis of relatively large areas with sparsely dispersed particles is now integrated with particle statistics. Results of some simple studies are shown in this column.
As a means of illustrating these capabilities, we analyzed a particle dispersion of a mixture of L-cysteine and L-cystine. The structures of these small molecules are shown in Figure 1. I selected these compounds for a model study because L-cystine is a dimer of the amino acid, L-cysteine, which is a result of oxidation and the formation of the disulfide bond. Whereas, clear differentiation of the Raman bands in the fingerprint region is often difficult because of the heavy mixing of atomic motions in molecules, in this case the -S–S- disulfide bond in the dimer does not mix appreciably with other interatomic bonds, and its vibrational band is easily recognized as a strong sharp band near 500 cm-1 in the Raman spectrum. In addition, the vibration of the monomer's –SH sulfhydryl functional group has a band in the Raman spectrum near 2500 cm-1 that also does not mix with other species. Thus, it is quite easy to differentiate these two compounds, as seen in Figure 2, with the sulfhydryl band at 2549 cm-1 and the disulfide band at 495 cm-1.
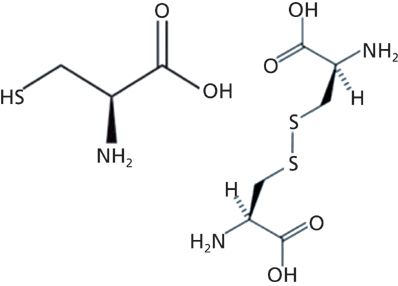
Figure 1: Molecular structure of the amino acid L-cysteine (left) and its dimer L-cystine (right).
Small amounts of the two powders were mixed on a micrograph slide. For Raman examination, the particles were transferred to a metallized surface to avoid the broad spectrum of the glass that would add noise to the results, even if the glass signal was subtracted. A region was selected for examination where the particles were well separated. This region was considerably larger than the microscopic field of view (the 100× objective normally provides a field of view of about 80–100 μm), so a montage of the field was acquired in preparation for measurement of the Raman signals. The micrograph in Figure 3 shows a dark-field image of a 600 μm × 600 μm region that was selected for analysis.
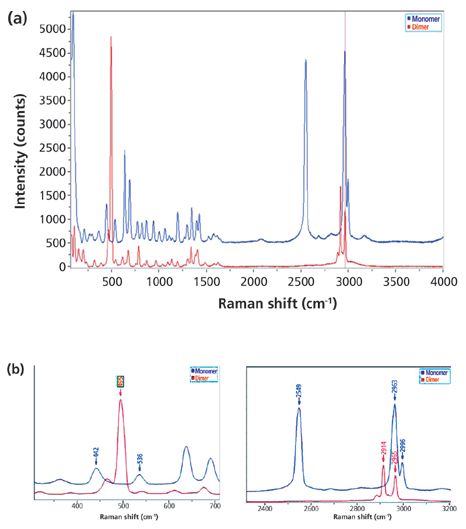
Figure 2: Raman spectra of L-cysteine (monomer) and L-cystine (dimer): (a) the full spectra, with the monomer shown in blue and the dimer in red - the disulfide band is at 495 cm-1 just below 500 cm-1, and the sulfhydryl band is near 2549 cm-1; (b) expanded views of the spectral regions around these two bands.
Before the selection of the particles and the collection of the Raman spectra are initiated, it is helpful to know that the selected area contains more than one molecular species. It is possible to use a real time display function to jump from particle to particle and examine the spectrum. Figure 4 shows (in a different region of the sample) the ability to identify the presence of two species.
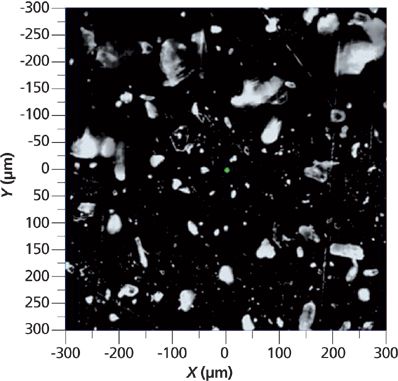
Figure 3: Micrograph montage showing a 600 μm × 600 μm region selected for particle analysis by Raman spectra.
Particle Selection for Automated Measurements
Examination of the field of view of Figure 3 indicated the presence of two populations of particles, some quite large, and some small. We chose to examine them separately. Using the image analysis features in the software we were able to select these populations independently, and the selected particles are shown highlighted in blue in Figures 5a and 5b. Particles are separated from the background with a threshold in the brightness scale. When necessary, morphological filters such as open and dilate are used to remove the noise or separate joined particles. After the particles are separated from the background, the software provides the statistics of size and shape descriptors, as well as the number of particles. We can select particles for Raman measurement based on any of the size and shape descriptors provided. We chose the area and a size descriptor, and applied a filter to select particles in a certain size range. Selected particles are numbered in the order of Raman measurements. All of this procedure is done using International Organization for Standardization (ISO) standards 13322-1 and 9726-6. Finally, the entire set of parameters of the particles selected for measurement can be stored, recalled in the software, and copied into a spreadsheet for further analysis. Table I shows how this information can be presented.
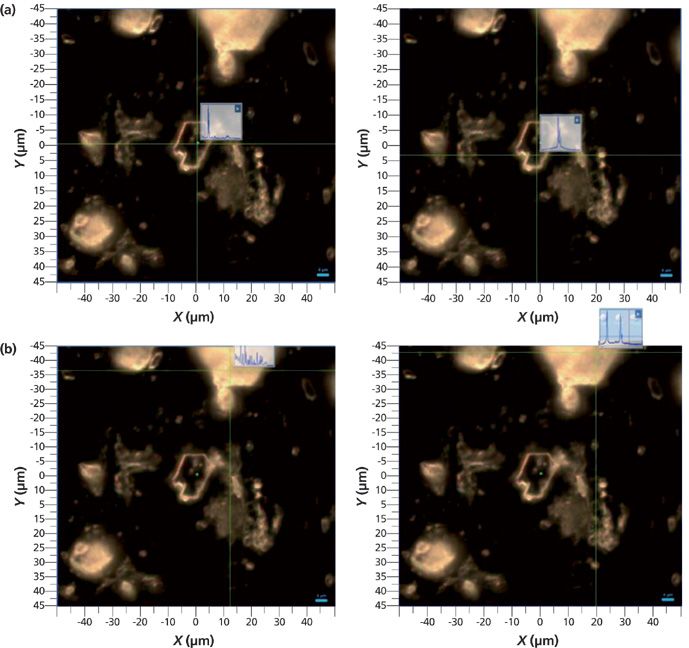
Figure 4: (a) Micrographs of a selected region with a clear platelet in the middle of the field of view exhibiting spectral features of the disulfide dimer in the fingerprint (left) and CH (right) regions. (b) Same micrograph but with the cursor pointing to a white scattering particle in the top of the field of view and exhibiting spectral features of the monomer in the fingerprint (left) and SH/CH (right) regions.
Raman Measurements
All the standard conditions for Raman measurements are available; these include laser wavelength, spectral resolution (grating), confocality, and acquisition time. The results shown below were acquired by scanning the grating to cover the entire spectrum without any compromise in spectral resolution. Note that if the goal is to distinguish chemically similar species such as crystalline polymorphs of an API, good spectral resolution could be critical.
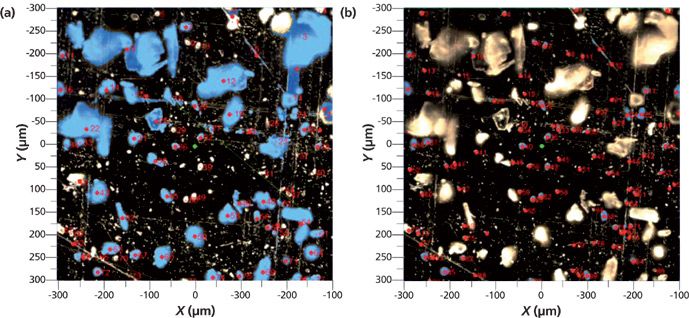
Figure 5: (a) Montage micrograph with particles of large area selected for analysis. (b) Montage micrograph with particles of small area selected for analysis.
Identification of Species from Raman Spectrum
In this example, it is straightforward to distinguish the spectrum of monomer from that of dimer. In one case, there is a strong –SH stretching band. In the other, a strong S–S stretching band. This is precisely why we selected these materials for demonstration. The difficulty is to examine a large number of spectra one by one. A multivariate analysis (MVA) method can help classify a large number of spectra into groups of the same chemistry automatically. We chose classical least squares (CLS) analysis for this analysis.
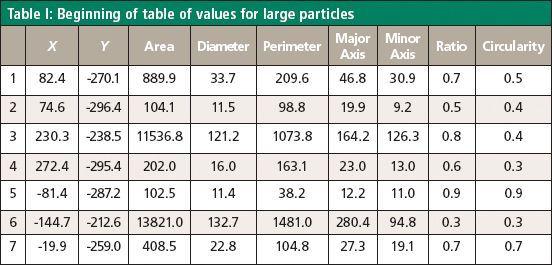
Table I: Beginning of table of values for large particles
CLS analysis fits each spectrum in a dataset with reference spectra by minimizing the least square error.

where I is a particle spectrum, A, B, C, and so on are reference spectra (or loadings), a, b, c, and so on are fitting coefficients (or scores), and ε the least square error.
Because there are only two kinds of particles in the sample, the equation becomes

where A is the L-cysteine spectrum and B is the L-cystine spectrum (Figure 2).
If the particle is L-cysteine, its spectrum would be similar to A, or I~A. The corresponding score would be close to 1, or a~1, and b~0. Similarly, if the particle is L-cystine, a~0 and b~1. Conventionally, if the CLS results show the scores for a particle spectrum as a~1, and b~0, the particle can be classified or identified as L-cysteine. Similarly, the particle is L-cystine, if scores for its spectrum are a~0 and b~1. If the particle is a mixture of L-cysteine and L-cystine, the spectrum would be a super-position of A and B, and a and b would take values between 0 and 1.
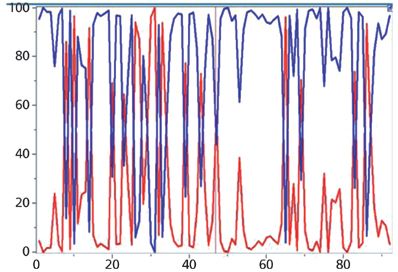
Figure 6: Calculated composition of the 92 small particles shown in Figure 5b, where the blue values correspond to the monomer and the red values to the dimer.
CLS scores of small particles are shown in Figure 6. Most of the scores are close to 0 or 100% reflecting the fact that the most of particles are pure materials. Some of the scores are values between 0 and 1 indicating that some particles are mixtures of two chemical compounds. For instance, scores for the spectrum of particle 47 (Figure 7) are 44% and 56%. Please note that these are normalized scores representing relative spectral intensities, not absolute concentrations.
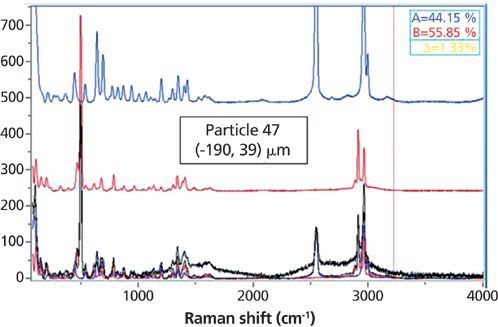
Figure 7: Raman spectrum of particle 47, decomposed into about 44% monomer and 56% dimer.
We noticed that some of the particles exhibited broad features centered between 1000 and 2000 cm-1, usually attributed to disordered carbon, which in this case was a contaminant. We isolated one of these particles and its spectrum as an additional loading. The results (Figure 8) show which particles contained contributions from the disordered carbon (for example, particle 34).
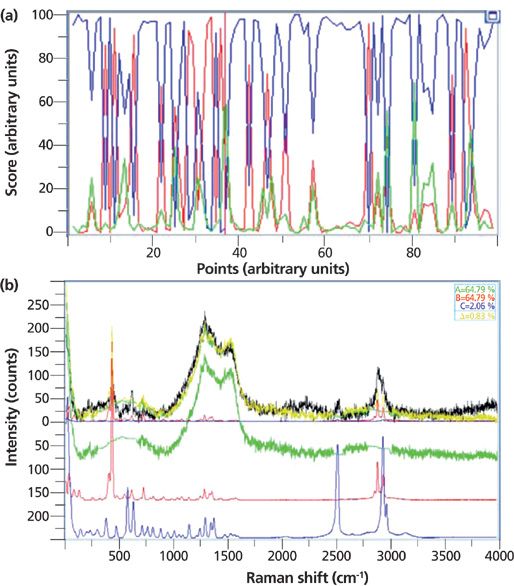
Figure 8: (a) Results of fitting Raman spectra of small particles to the two pure components and to the contribution of disordered carbon. (b) Fit to particle 34, showing a large contribution from the carbon signature.
Unlike the example above, there may be a case where no a priori information is available. We can examine the spectra one by one, but it would be highly ineffective and inefficient when the number of particles is large. Besides, there is no guarantee that any of the spectra are of pure materials, which complicates the chemical identification. There are MVA methods that aim to estimate spectra of pure compounds. Multivariate curve resolution (MCR) is one of them.
For large particle data, we pretended not to have any a priori information, and applied MCR to identify three loadings. The results of MCR are shown in Figure 9. The first loading (red) agrees well with the pure L-cysteine spectrum, and a library search would have identified it easily. The second loading (green) shows the spectral features of disordered carbon. Finally, the third loading (blue) agrees well with the pure L-cystine spectrum. Scores for each of the loadings are also shown. Similar to the analysis above, a high score translates to a high degree of resemblance of the spectrum to the loading. For example, particle 40 shows a high score for the second loading, and low scores for the first and the third loadings. Its spectrum agrees well with the second loading, and the particle is most likely disordered carbon.
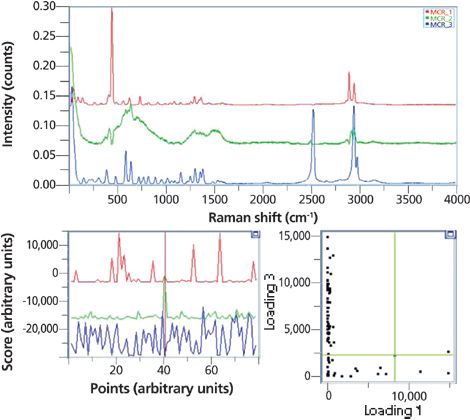
Figure 9: Top: Loadings as derived from the MCR algorithm. Bottom left: Scores for each of the loadings of each particle whose index, corresponding to the indicated particles in Figure 5a is indicated on the bottom of the figure. Bottom right: Scores plot for loading 1 (dimer) versus loading 3 (monomer).
Summary
Capabilities for composition analysis of microscopic particles on a Raman microscope have been described. These capabilities can be accommodated on an instrument equipped with a motorized stage and microscope camera for image capture. The software incorporates particle analysis based on static imaging. Statistical analysis of particle counts, sizes, and shapes are available, based on which desirable particles can be selected for Raman analysis. The added information from the Raman analysis moves these analyses to a new level.
Acknowledgments
I would like to acknowledge the critical reading of this article by my colleague Simon FitzGerald.
Fran Adar is the Principal Raman Applications Scientist for Horiba Scientific in Edison, New Jersey. She can be reached by e-mail at fran.adar@horiba.com

Fran Adar

Tomas Hirschfeld: Prolific Research Chemist, Mentor, Inventor, and Futurist
March 19th 2025In this "Icons of Spectroscopy" column, executive editor Jerome Workman Jr. details how Tomas B. Hirschfeld has made many significant contributions to vibrational spectroscopy and has inspired and mentored many leading scientists of the past several decades.
Nanometer-Scale Studies Using Tip Enhanced Raman Spectroscopy
February 8th 2013Volker Deckert, the winner of the 2013 Charles Mann Award, is advancing the use of tip enhanced Raman spectroscopy (TERS) to push the lateral resolution of vibrational spectroscopy well below the Abbe limit, to achieve single-molecule sensitivity. Because the tip can be moved with sub-nanometer precision, structural information with unmatched spatial resolution can be achieved without the need of specific labels.
Raman Spectroscopy Aflatoxin Detection Enhances Peanut Safety
March 11th 2025A research team from Jiangsu University has developed a Raman spectroscopy-based method to detect aflatoxin B1 (AFB1) in peanuts with improved accuracy and efficiency. By employing a two-step hybrid strategy integrating backward interval partial least squares (BiPLS) and variable combination population analysis (VCPA), the new model significantly enhances the precision of AFB1 detection, providing a more reliable approach for food safety monitoring.
A New Radiation: C.V. Raman and the Dawn of Quantum Spectroscopy, Part II
March 10th 2025In this Icons of Spectroscopy column, Executive Editor Jerome Workman Jr. delves into Part II of the Raman Effect, discovered by C. V. Raman, a physicist whose major contributions to vibrational spectroscopy have helped shape the field and advance one of the most important quantum-based spectroscopy tools of recent generations.