Prediction of the Size-Dependent Raman Shift of Semiconductor Nanomaterials via Deep Learning
Raman spectroscopy can characterize size-related properties of semiconductor nanomaterials according to the change of Raman shift. When limited to physical mechanisms, it is often difficult to predict the size-dependent Raman shift of semiconductor nanomaterials. To predict the size-dependent Raman shift more accurately and efficiently, a simple and effective method was created, demonstrated, and achieved via the deep learning model. The deep learning model is implemented by multi-layer perceptron. For size-dependent Raman shifts of three common semiconductor nanomaterials (InP, Si, CeO2), the prediction error was 1.47%, 1.18%, and 0.58%, respectively. The research has practical value in material characterization and related engineering applications, where physical mechanisms are not the focus and building predictive models quickly is key.
Semiconductor nanomaterials play a major role in many research areas, including energy conversion (1), sensing (2), electronics (3), photonics (4), and biomedicine (5). Size effect is widely accepted as an inevitable consideration when controlling special properties of semiconductor nanomaterials for different applications of interest. Because Raman shifts show obvious changes with the decrease of the material size, Raman spectroscopy, as a powerful tool, can effectively characterize the size of semiconductor nanomaterials. Predicting the size-dependent Raman shift is in favor of the research on size-related properties of semiconductor nanomaterials. A great deal of theoretical research has attempted to determine the size dependence of the Raman shift in semiconductor nanomaterials, such as phonon modes (6–8), thermodynamic methods (9,10), and atomic coordination models (11). Because of the limitation of complex physical mechanisms, establishing a theoretical model is time-consuming work. It is easier and simpler to obtain bond number model (12,13), but coordination numbers of surface atoms in this model need to be revised frequently for different semiconductor nanomaterials, which is a trivial task. However, convenience and speed are the most urgent needs for engineering. As a result, from the application point of view, a simpler and more effective method is needed for predicting the size-dependent Raman shift of semiconductor nanomaterials.
Deep learning is one of the most focused research fields in recent years, aiming to learn features and directly build predictive models from large-scale raw data sets. Deep learning has been widely researched on qualitative and quantitative analysis of Raman spectroscopy (14–16). Deep learning is a data-driven method and thus can perform direct feature extraction of experimental data without considering complex physical mechanisms. Moreover, deep learning possesses the powerful ability of the non-linear feature extraction. As a result, deep learning is very suitable for the regression analysis of complex physical problems. Once a well-trained deep learning model is achieved, the size-dependent Raman shift of semiconductor nanomaterials can be easily predicted.
In this article, to predict the size-dependent Raman shift of semiconductor nanomaterials, a deep learning model was achieved by multi-layer perceptron. It is discussed that the influence of the training data set fluctuation and the type of activation function on the performance of the deep learning model. Finally, according to the test on three common semiconductor nanomaterials (InP, Si, and CeO2), the results show that the size-dependent Raman shift can be predicted via the well-trained deep learning model.
Experimental
Data set Generation for Training
Data sets of three common semiconductor nanomaterials (InP, Si, and CeO2) were generated by the bond number model that is used to simulate the experimental data (that is, the size-dependent Raman shift of semiconductor nanomaterials). To be in agreement with the experiment, the random noise was added into the bond number model to simulate the fluctuation of Raman shift in the experiment (this is called the training data set fluctuation in this article). The fluctuation amplitude indicates how far the measured value deviates from the true value because of noise. The random noise (Anoise) is generated by a random function (Frandom) that generates random values from 0 to 1 with uniform distribution. The random function is implemented by Python library function. The fluctuation amplitude (A) of the random noise varies from 0 cm-1 to 10 cm-1. The truth value refers to the situation where the fluctuation amplitude is 0 cm-1. The bond number model (13), random noise, and data set are as follows:
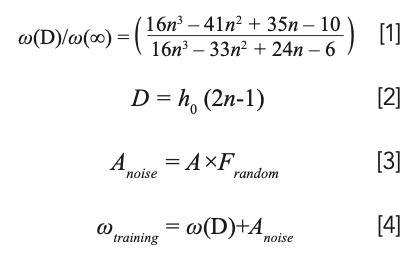
D is the size of semiconductor nanomaterials with the shape of cuboctahedron; ω(D)is the size-dependent Raman shift; ω(∞) is the Raman shift of bulk material; ωtraining is the size-dependent Raman shift of semiconductor nanomaterials with random noise that is training data; h0 is the atom radius; n is the atom number on one edge of the cuboctahedron; and n ≥ 2.
Finally, the training data set is generated by varying n from 2 to 100, and the size of the data set is 99. As a result, the size of the semiconductor nanomaterial is discrete. Material parameters of three semiconductor nanomaterials are given in Table I.

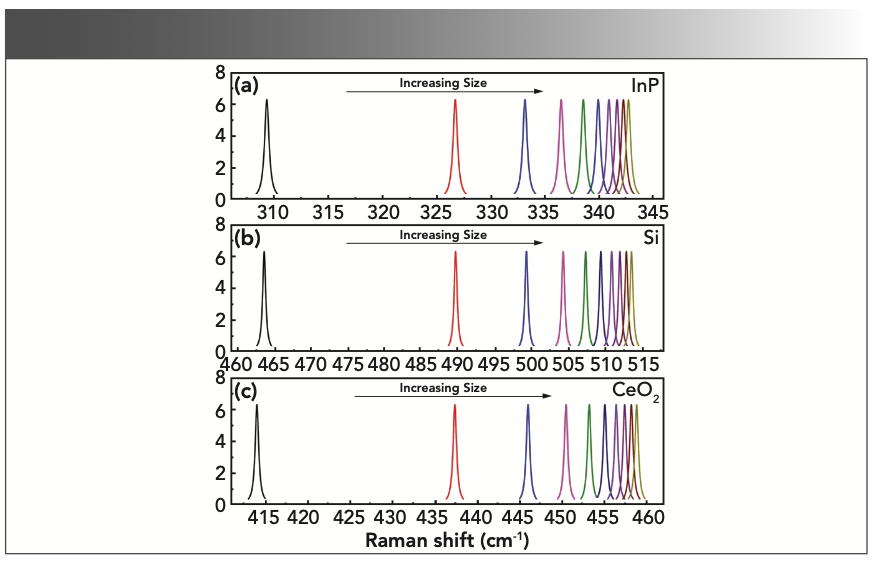
Size-dependent Raman spectra (InP, Si, and CeO2) have been reported in the literature (17–19). However, to visually observe the data set generated by the bond number model, Raman spectra simulated by the Lorentzian function are given in Figure 1. Because the relationship between the Raman shift and size is reflected by the Raman peak position of the longitudinal optical (LO) mode, the broadening of spectral bands and other spectral bands are not considered in the simulated spectrum. Figure 1 shows the change of Raman shift when n (equation 2) varies from 2 to 11. The definition of Lorentzian function and the relevant parameters are given in the “Supporting Information” section.
FIGURE 1: Raman shift as a function of semiconductor nanomaterial size (n in equation [2] varies from 2 to 11) according to the bond number model.
Multi-Layer Perceptron
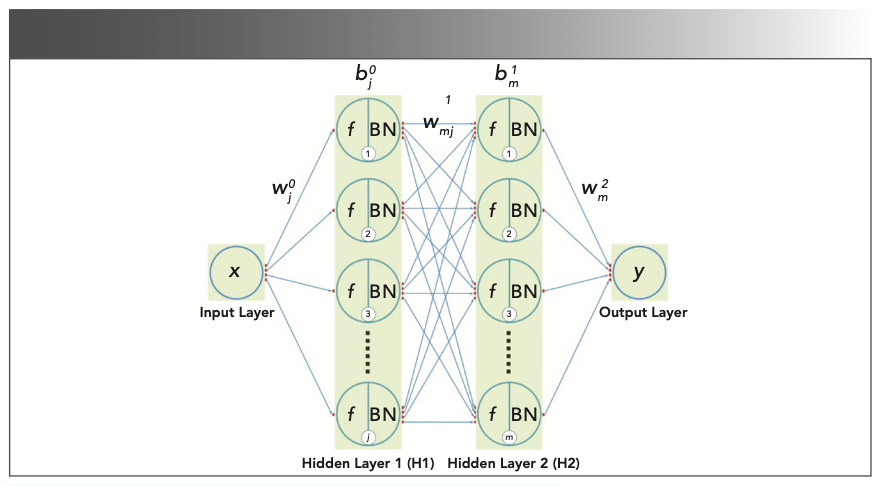
The deep learning model is achieved by multi-layer perceptron. The schematic of multi-layer perceptron is shown in Figure 2, including one input layer, two hidden layers (H1 and H2), and one output layer. Each hidden layer is followed by one batch normalization (BN) layer. The sizes of input layer and output layer are both one. The multi-layer perceptron can be written out as (20):
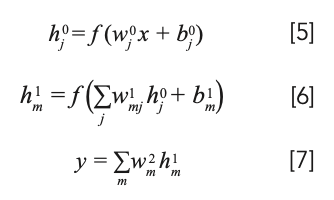
The tanh is selected as activation function (f) to extract nonlinear feature and conduct nonlinear regression analysis. The impact of different activation functions on the performance of the deep learning model is compared in the next section. The definition of tanh is as followed (20):

FIGURE 2: Schematic of a multi-layer perceptron.
Experimental Configuration and Hyper Parameters
The deep learning model is trained on dual CPUs (Intel Xeon 6226R) with a memory size of 128 Gb. The multi-layer perceptron is achieved via the PyTorch that is an open source framework. Stochastic gradient descent is selected as the loss function from the PyTorch library. Hyper parameters including the number of neurons in hidden layers (H1 or H2), the learning rate, the batch size and the epoch are determined by grid searching method. The final values are given in Table II.

Error Calculation
To evaluate the effect of training and the performance of the trained model, the training error and the prediction error are calculated correspondingly. The training error is the deviation of the predicted value from the truth value for the training data set, and the prediction error is the deviation of the predicted value from the truth value for the testing data set. The training error indicates the training effect of the model, and the prediction error indicates the generalization ability of the trained model.

Results and Discussion
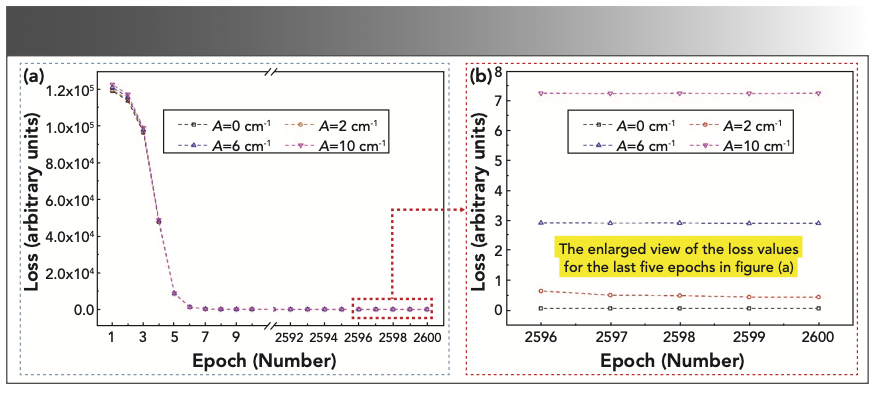
First, the influence of the training data set fluctuation is discussed. In the experiment, the experimental value of the Raman shift generally deviates from the truth value because of the resolution of the Raman spectrometer. Generally, the resolution of a high-precision Raman spectrometer can be less than 0.2 cm-1, such as Horiba T64000, whereas the resolution of a common portable Raman spectrometer can be less than 4 cm-1. Therefore, the fluctuation amplitude of Raman shift from 0 cm-1 to 10 cm-1 was chosen to study the influence of the training data set fluctuation on the training of deep learning model. Here, InP data sets with different fluctuation am- plitudes are used, and the training data set is generated by equation 4. According to Figure 3, in the training process, the loss value is markedly decreasing with the training epoch. To show it more clearly, loss values of the last five epochs are zoomed into view and shown in the inset of Figure 3. As shown in Figure 3, when the fluctuation amplitude of the training data set varies from 0 cm-1 to 10 cm-1, the loss value at the 2600th training epoch increases from 0.07 to 7.25 correspondingly. Although the fitting of the multi-layer perceptron to the training data is degraded under the larger fluctuation amplitude of the training data set, the loss value can converge steadily.
FIGURE 3: The loss value as a function of epoch at different fluctuation amplitudes (A) of the training data set (InP data set). The loss value reveals the influence of the training data set fluctuation on the training process. (a) The loss values for epoch from 1 to 2600; (b) the enlarged view of the loss values for the last five epochs in Figure 3a.
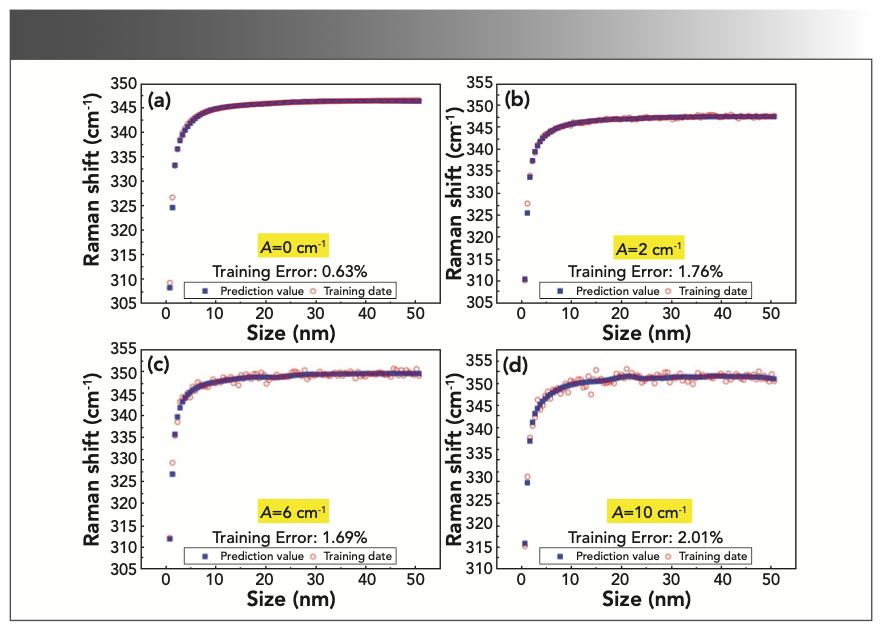
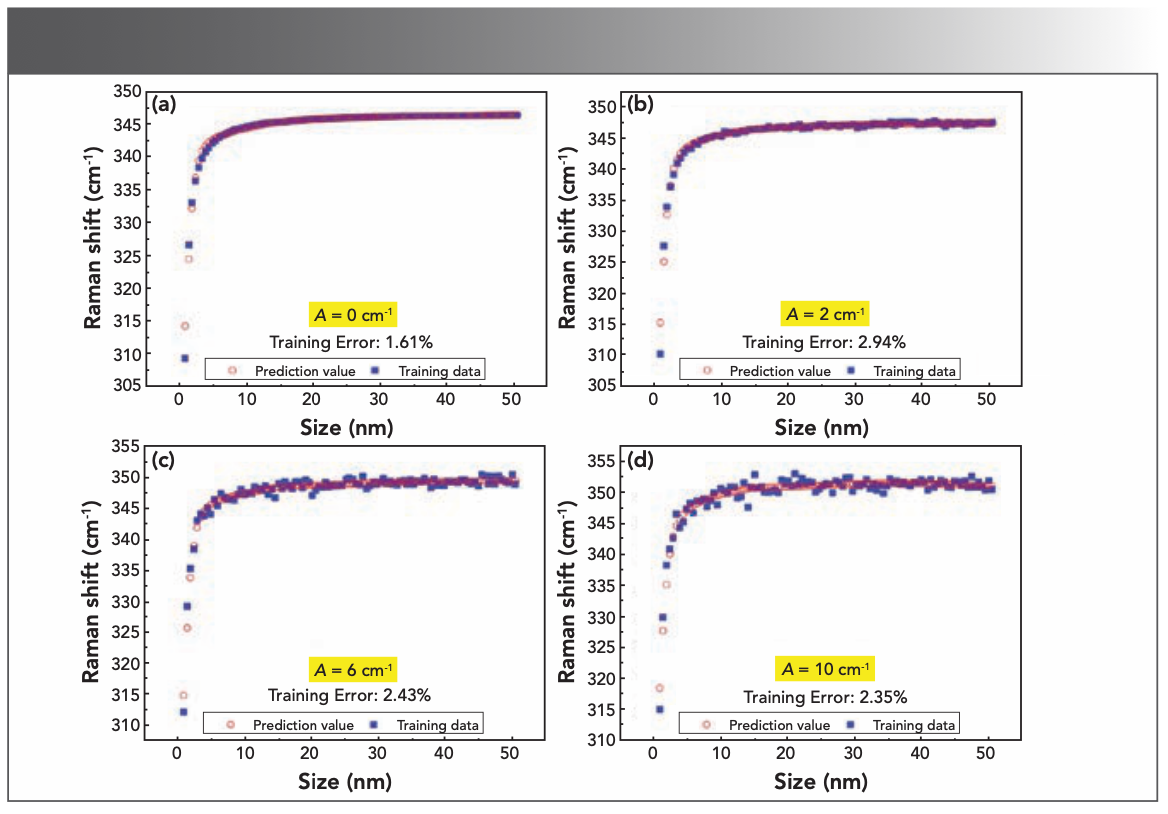
To observe the influence of the training data set fluctuation on the training result further, the training error given in equation 9 is calculated under different fluctuation amplitudes of training data sets. The training errors are shown in Figure 4. Compared with the fluctuation amplitude of 0 cm-1, the training error increases with the increase of the fluctuation amplitude of the training data set. When there is no the training data set fluctuation (that is, the training data is equal to the truth value), the training error is 0.63%. For the fluctuation amplitude of 10 cm-1, the training error is 2.01%. Although the training data set fluctuation will cause the degraded performance of the deep learning model, the training accuracy is still satisfying. To illustrate extreme case, all errors in the whole article are expressed with the maximum of error. In addition to the training error, the prediction error given in equation 10 is also calculated. For the ideal training data (the fluctuation amplitude of the training data set is 0 cm-1), the training error and the prediction error are actually the same, so the prediction error is also 0.63%. For the fluctuation amplitude of 10 cm-1, the prediction error is 3.46%, which further indicates that the precise training data is a key factor to determine the accuracy of the deep learning model. The relevant results are shown in Table III.
FIGURE 4: Fitting of the deep learning model to the training data sets (InP data sets) of different fluctuation amplitudes (A). The fitting error (or training error) reveals the influence of the training data set fluctuation on the training effect. The fluctuation amplitude: (a) A = 0 cm-1; (b) A = 2 cm-1; (c) A = 6 cm-1; and (d) A = 10 cm-1.

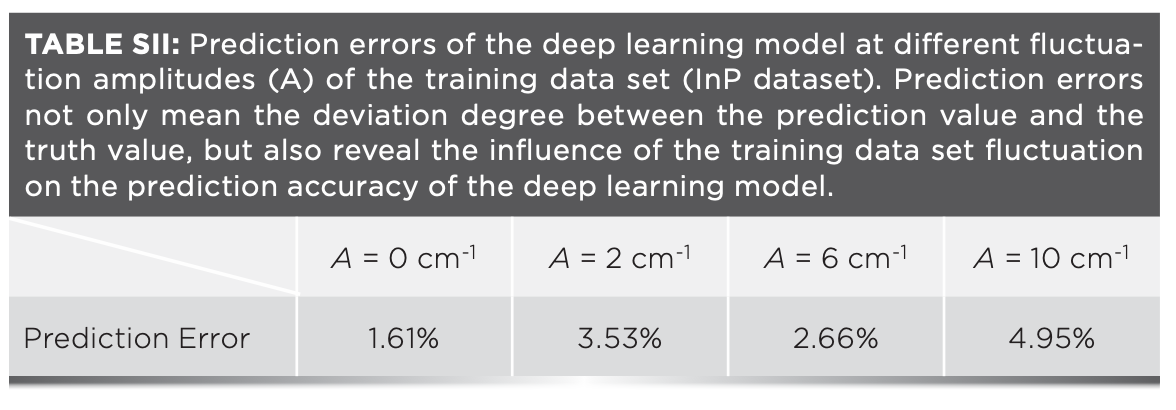
Next, the role of activation function in the model training is compared. In the above section, the activation function of tanh is used. For comparison, another non-linear activation function sigmoid is used in this article. Optimal hyper parameters for the sigmoid are re-optimized. Optimal hyper parameters for sigmoid and corresponding results are given in Table S1, Table S2, Figure S1, and Figure S2 ("Supporting Information" section). For the activation function of sigmoid, the loss value at convergence, the training error and the prediction error are worse than those of tanh. The loss value at convergence varies from 0.42 to 7.92 when the fluctuation amplitude of the training data set varies from 0 cm-1 to 10 cm-1. The training error and the prediction error are both 1.61% for the ideal training data. When the fluctuation amplitude of the training data set is 10 cm-1, the training error is 2.35% and the prediction error is 4.95%. Therefore, for the nonlinear regression analysis, the activation function is also important in determining the accuracy of the deep learning model. However, for semiconductor nanomaterials meeting the bond number model, the activation function of tanh is better.
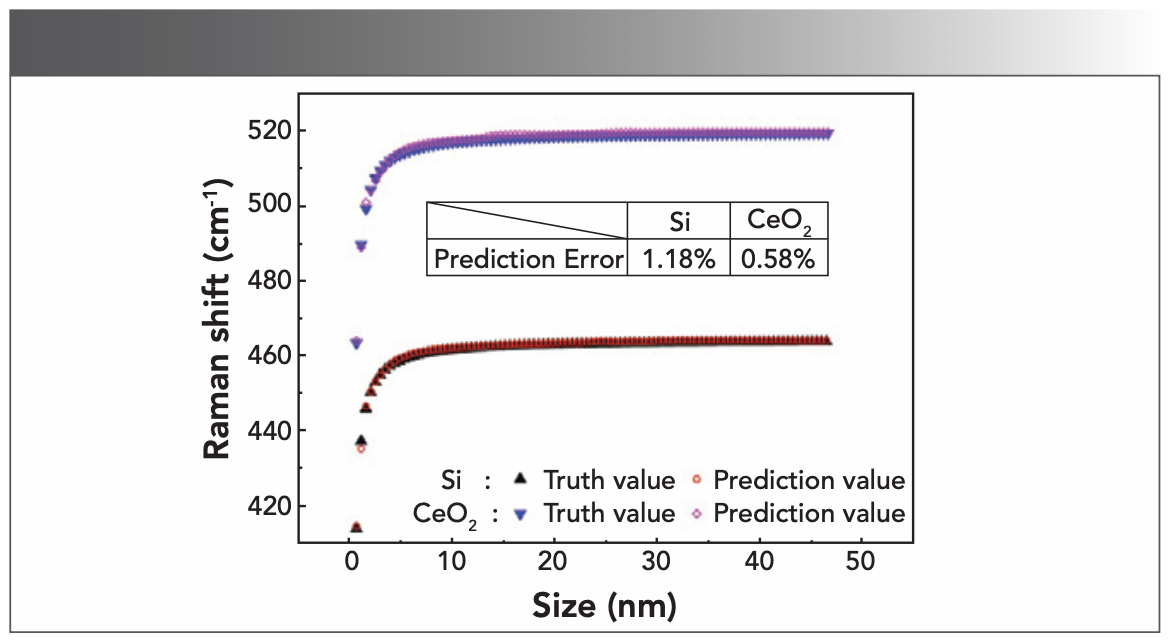
To further demonstrate the feasibility, the fitting to the size-dependent Raman shifts of Si and CeO2 is studied as well. All hyper parameters and network structure of the deep learning model are the same as those of InP. Nevertheless, the deep learning model is retrained by the training data set of Si and CeO2. Results in Figure 5 are obtained under the fluctuation amplitude of the training data set of 2 cm-1. Prediction errors of Si and CeO2 are 1.18% and 0.58%, respectively. Because the resolution of a high-precision Raman spectrometer can be less than 0.2 cm-1, the prediction error has the potential to be reduced further.
FIGURE 5: The deviation of the prediction (or fitting) curve from the truth value curve for the size-dependent Raman shift of Si and CeO2. The prediction error reveals the prediction accuracy of the deep learning model of Si and CeO2. The fitting curve is the fitting of the deep learning model to the training data set (Si or CeO2 data set) with the fluctuation amplitude A = 2 cm-1.
Conclusions
A deep learning model for predicting the size-dependent Raman shift of semiconductor nanomaterials was demonstrated and achieved via multi- layer perceptron. The prediction error of the size-dependent Raman shifts of three semiconductor nanomaterials (InP, Si, CeO2) was 1.47%, 1.18%, and 0.58%, respectively. Through the research of this article, predicting the size-dependent Raman shift of semiconductor nanomaterials can be greatly simplified, which is very conducive to engineering applications.
Acknowledgments
This study was supported by National Natural Science Foundation of China (61905047), and Fundamental Research Funds for the Central Universities of China (3072021CF2510).
References
(1) Nehra, M.; Dilbaghi, N.; Marrazza, G.; Kaushik, A.; Abolhassani, R.; Mishra, Y. K.; Kim, K. H.; Kumar, S. 1D Semiconductor Nanowires for Energy Conversion, Harvesting and Storage Applications. Nano Energy 2020, 76, 104991. DOI: 10.1016/j.nanoen.2020.104991
(2) Zang, Y.; Fan, J.; Ju, Y.; Xue, H.; Pang, H. Current Advances in Semiconductor Nanomaterial-Based Photoelectrochemical Biosensing. Chem. - Eur. J. 2018, 24 (53), 14010–14027. DOI: 10.1002/chem.201801358
(3) Yu, K. J.; Yan, Z.; Han, M.; Rogers, J. A. Inorganic Semiconducting Materials for Flexible and Stretchable Electronics. Flex. Electron. 2017, 1 (1), 4. DOI: 10.1038/s41528-017-000-z
(4) Shi, Y.-L.; Zhuo, M.-P.; Wang, X.-D.; Liao, L.-S. Two-Dimensional Organic Semiconductor Crystals for Photonics Applications. ACS Appl. Nano Mater. 2020, 3 (2), 1080–1097. DOI: 10.1021/acsanm.0c00131
(5) Zhang, L.; Zhu, C.; Huang, R.; Ding, Y.; Ruan, C.; Shen, X.-C. Mechanisms of Reactive Oxygen Species Generated by Inorganic Nanomaterials for Cancer Therapeutics. Front. Chem. 2021, 9, 630969–630969. DOI: 10.3389/fchem.2021.630969
(6) Ke, W.; Feng, X; Huang, Y. The Effect of Si-Nanocrystal Size Distribution on Raman Spectrum. J. Appl. Phys. 2011, 109 (8), 083526. DOI: 10.1063/1.3569888
(7) Doğan, İ.; van de Sanden, M. C. M. Direct Characterization of Nanocrystal Size Distribution Using Raman Spectroscopy. J. Appl. Phys. 2013, 114 (13), 134310. DOI: 10.1063/1.4824178
(8) Zhang, P.; Feng, Y.; Anthony, R.; Kortshagen, U.; Conibeer, G.; Huang, S. Size-Dependent Evolution of Phonon Confinement in Colloidal Si Nanoparticles. J. Raman Spectrosc. 2015, 46 (11), 1110–1116. DOI: 10.1002/jrs.4727
(9) Williams, R. S.; Medeiros-Ribeiro, G.; Kamins, T. I.; Ohlberg, D. A. A. Thermodynamics of the Size and Shape of Nanocrystals: Epitaxial Ge on Si(001). Annu. Rev. Phys. Chem. 2000, 51 (1), 527–551. DOI: 10.1146/annurev.physchem.51.1.527
(10) Yang, C. C.; Li, S. Size-Dependent Raman Red Shifts of Semiconductor Nanocrystals. J. Phys. Chem. B 2008, 112 (45), 14193–14197. DOI: 10.1021/jp804621v
(11) Gao, Y.; Yin, P. Origin of Asymmetric Broadening of Raman Peak Profiles in Si Nanocrystals. Sci. Rep. 2017, 7 (1), 43602. DOI: 10.1038/srep43602
(12) Li, H.; Xiao, H. J.; Zhu, T. S.; Xuan, H. C.; Li, M. The Effect of the Size and Shape on the Bond Number of Quantum Dots and Its Relationship with Thermodynamic Properties. Phys. Chem. Chem. Phys. 2015, 17 (27), 17973–17979. DOI: 10.1039/C5CP02086G
(13) Li, H.; He, X. W.; Xiao, H. J.; Du, H. N.; Wang, J.; Zhang, H. X. Size-Dependent Raman Shift of Semiconductor Nanomaterials Determined Using Bond Number and Strength. Phys. Chem. Chem. Phys. 2017, 19 (41), 28056–28062. DOI: 10.1039/C7CP05495E
(14) Fan, X.; Ming, W.; Zeng, H.; Zhang, Z.; Lu, H. Deep Learning-Based Component Identification for the Raman Spectra of Mixtures. Analyst 2019, 144 (5), 1789–1798. DOI: 10.1039/C8AN02212G
(15) Weng, S.; Yuan, H.; Zhang, X.; Li, P.; Zheng, L.; Zhao, J.; Huang, L. Deep Learning Networks for the Recognition and Quantitation of Surface-Enhanced Raman Spectroscopy. Analyst 2020, 145 (14), 4827–4835. DOI: 10.1039/D0AN00492H
(16) Fu, X.; Zhong, L.-m.; Cao, Y.-b.; Chen, H.; Lu, F. Quantitative Analysis of Excipient Dominated Drug Formulations by Raman Spectroscopy Combined with Deep Learning. Anal. Methods 2021, 13 (1), 64–68. DOI: 10.1039/D0AY01874K
(17) Seong, M. J.; Mićić, O. I.; Nozik, A. J.; Mascarenhas, A.; Cheong, H. M. Size-Dependent Raman Study of InP Quantum Dots. Appl. Phys. Lett. 2003, 82 (2), 185–187. DOI: 10.1063/1.1535272
(18) Iqbal, Z.; Veprek, S. Raman Scattering from Hydrogenated Microcrystalline and Amorphous Silicon. J. Phys. C: Solid State Phys. 1982, 15 (2), 377–392. DOI: 10.1088/0022–3719/15/2/019
(19) Spanier, J. E.; Robinson, R. D.; Zhang, F.; Chan, S.-W.; Herman, I. P. Size-Dependent Properties of CeO2−y Nanoparticles as Studied by Raman Scattering. Phys. Rev. B 2001, 64 (24), 245407. DOI: 10.1103/PhysRevB.64.245407
(20) Zhang, A.; Lipton, Z. C.; Li, M.; Smola, A. J. Dive into Deep Learning. arXiv, June 21, 2021, ver. 1. DOI: 10.48550/arXiv.2106.11342
Supporting Information
Prediction for Size-dependent Nanomaterials via Deep Learning
1. Definition of signmoid (S1)
2. Lorentzian function
3. Results for sigmoid
FIGURE S1: The loss value as a function of epoch at different fluctuation amplitudes (A) of the training data set (InP data set). The loss value reveals the influence of the training data set fluctuation on the training process. (a) The loss values for epoch from 1 to 2600; (b) The enlarged view of the loss values for the last five epochs in figure (a).
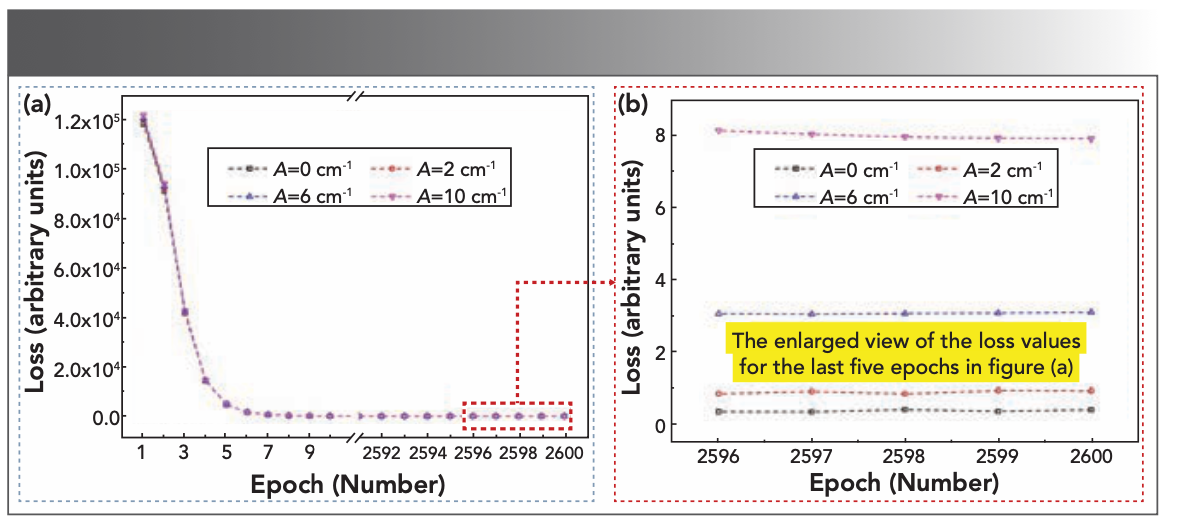
FIGURE S2: Fitting of the deep learning model to the training datasets (InP data sets) of different fluctuation amplitudes (A). The fitting error (or training error) reveals the influence of the training data set fluctuation on the training effect. The fluctuation amplitude: (a) A = 0 cm-1, (b) A = 2 cm-1, (c) A = 6 cm-1, (d) A = 10 cm-1.

Reference
S(1) Zhang, A; Lipton, Z. C.; Li, M.; Smola, A. J. arXiv e-prints. 2021, https://arxiv.org/abs/2106.11342 (accessed 2013-03-10).
Yuping Liu, Yuqing Wang, Sicen Dong, and Junchi Wu are with the Key Laboratory of In-Fiber Integrated Optics Ministry of Education and the College of Physics and Optoelectronic Engineering at Harbin Engineering University, in Harbin, China. Direct correspondence to Yuping Liu at libertyping@163.com.●

AI-Powered SERS Spectroscopy Breakthrough Boosts Safety of Medicinal Food Products
April 16th 2025A new deep learning-enhanced spectroscopic platform—SERSome—developed by researchers in China and Finland, identifies medicinal and edible homologs (MEHs) with 98% accuracy. This innovation could revolutionize safety and quality control in the growing MEH market.
New Raman Spectroscopy Method Enhances Real-Time Monitoring Across Fermentation Processes
April 15th 2025Researchers at Delft University of Technology have developed a novel method using single compound spectra to enhance the transferability and accuracy of Raman spectroscopy models for real-time fermentation monitoring.
Nanometer-Scale Studies Using Tip Enhanced Raman Spectroscopy
February 8th 2013Volker Deckert, the winner of the 2013 Charles Mann Award, is advancing the use of tip enhanced Raman spectroscopy (TERS) to push the lateral resolution of vibrational spectroscopy well below the Abbe limit, to achieve single-molecule sensitivity. Because the tip can be moved with sub-nanometer precision, structural information with unmatched spatial resolution can be achieved without the need of specific labels.