Raman Confocal Analysis of an Inclusion in Sapphire
Application Notebook
One of the most powerful aspects of Raman microscopy is the capability to do confocal analysis of features inside of a sample without having to prepare or damage the sample to get the important spectral information.
Tim Deschaines, Raman Product Specialist, Thermo Fisher Scientific
One of the most powerful aspects of Raman microscopy is the capability to do confocal analysis of features inside of a sample without having to prepare or damage the sample to get the important spectral information.
A very good example of the usefulness of confocal Raman analysis is when analyzing inclusions in geological and gemological samples. Inclusions can run the range from being other minerals to liquids or gasses trapped when the primary mineral formed.
In this note we present the analysis of an inclusion found in a sample that was believed to be sapphire. The sample was analyzed with a Thermo Scientific DXR Raman Microscope, by placing the sample on a motorized stage under the microscope objective. The inclusion was brought into focus and it was then analyzed with the Raman laser, 532 nm.
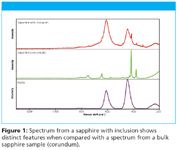
The sample was purported to be a sapphire, which was easily confirmed by collecting a Raman spectrum of the bulk sampleand comparing it against a mineral library database. The resulting spectrum of the sapphire is shown in Figure 1 (middle). It should be noted that the library match was for corundum; this occurs because the elements that distinguish a sapphire from a ruby are present in trace amounts, typically below the detection limit of Raman spectroscopy. Once the primary form is identified, the color of the stone can be used for final classification. A similar situation would arise when working with quartz varieties.

Figure 1
In this sample the inclusion analyzed had a thin needle-like structure. If it was identified as rutile, a form of titanium dioxide, then the sample could be classified as a star sapphire. The top spectrum in Figure 1 was captured for the inclusion. Comparing it to the spectrum of the bulk sample, Figure 1 (middle), a minor contribution from the surrounding sapphire matrix can be seen; otherwise the inclusion has very different, and much broader, spectral features. There are two approaches that can be taken to identifying the inclusion. Using the standard Thermo OMNIC software, a fast library search can be undertaken, using the aforementioned mineral library, or a spectral subtraction can be performed to remove the contribution from the sapphire matrix. Then the resulting spectrum can be analyzed using the mineral library. A third approach (much easier, faster, and more reliable than manually doing the subtraction), is to use OMNIC Specta software with its multicomponent search feature. The spectrum of the inclusion is simply opened; the multi-component search option selected; the proper libraries or spectra chosen; the number of components to be identified is selected; and then the search is run. All three methods give the same identification of the inclusion, as rutile, though both the spectral subtraction method and Specta lead to a much higher percentage correlation match.
In conclusion, Raman microscopy can be a very powerful, yet straightforward and easy tool, for the identification of minerals, and their inclusions. Coupling Raman with high performance software leads to consistent, reliable results.

Thermo Fisher Scientific
Madison, Wisconsin
Tel. (800) 532-4752
Website: www.thermo.com/Raman

Thermo Fisher Scientists Highlight the Latest Advances in Process Monitoring with Raman Spectroscopy
April 1st 2025In this exclusive Spectroscopy interview, John Richmond and Tom Dearing of Thermo Fisher Scientific discuss the company’s Raman technology and the latest trends for process monitoring across various applications.
A Seamless Trace Elemental Analysis Prescription for Quality Pharmaceuticals
March 31st 2025Quality assurance and quality control (QA/QC) are essential in pharmaceutical manufacturing to ensure compliance with standards like United States Pharmacopoeia <232> and ICH Q3D, as well as FDA regulations. Reliable and user-friendly testing solutions help QA/QC labs deliver precise trace elemental analyses while meeting throughput demands and data security requirements.