Raman Micro Imaging - What Was a Concept in 1975 Is Now a Reality
Raman microscopy was developed as a tool for microanalysis complementary to the electron microscope, which enabled identification of the elements in a microspot. The first realization for Raman imaging was implemented using a nonconfocal optical method. Subsequently, a confocal scheme was developed, which provided better contrast in the Raman image. A number of successful examples from pathology, pharmaceutical analysis, and geology will be shown.

The Nobel prize was awarded to C.V. Raman in 1928 for being the first person to report something that had been predicted about 10 years earlier — a scattering spectrum of a sample due to vibrational transitions. For the next 20 years, Raman scattering was used, in conjunction with infrared (IR), as a means to confirm the molecular configuration of a sample. For instance, the controversy about the structure of benzene was solved by Raman and IR spectroscopies. If the bonds between the carbon atoms in the ring alternated between single and double bonds, then the molecule would have D3h symmetry, but not a center of symmetry. Without a center of symmetry, a vibration could be both Raman and IR active. If the single and double bonds resonate, then the molecule has D6h, which does have a center of symmetry, and the "mutual exclusion selection rule" holds. Well, if you look at the IR and Raman spectra overlaid, you will find that there are no overlapping bands; so benzene has a center of symmetry, meaning that it has the D6h configuration.

Fran Adar
Curiously, during this early period, it was easier to do Raman spectroscopy than IR because the IR sources and detectors could not provide high sensitivity. That all changed in the 1960s when commercial Fourier transform–infrared (FT-IR) systems were developed with better detectors. The FT-IR systems were quite sensitive and easy to use. The laser, also introduced during this period, was believed to provide a better source for Raman, which would improve its sensitivity to study "real world" samples, but that did not happen because of the fluorescence interference from the samples. Curiously, during the early years, when spectroscopy was used to determine structure, samples had been purified extensively, which meant that fluorescence from impurities was not seen as an interference. When studying real-world samples, one usually does not have the option to purify the samples. The laser that was used during this period was an argon laser, with lines between 514 and 457 nm. Somehow these lines were ideal to excite impurity fluorescence, so Raman was a disappointment for many industrial applications.
In spite of this, Prof. Michel Delhaye at the Technical University of Lille in northern France recognized the scientific potential of a Raman microscope (1). There apparently had been some communication with Prof. Castaing, who had developed the electron microscope for analysis of elemental composition with 1-μm spatial resolution. It was recognized that the Raman microscope would complement the elemental information from the electron microprobe by providing information on molecular bonding between atoms. So, for example, if there were an organic impurity on an integrated circuit, the electron microprobe would tell you that there was carbon in the impurity. Whether that carbon was in the form of carbon black, graphite, polymer, photoresist, or any other of the possible organic molecules that might be in the circuit's environment, the electron microscope could not tell you. But a Raman spectrum could provide this critical information.
So there was good reason to develop the tool, and it was felt that Raman imaging was the most important feature (1). The method that was developed to produce an image on the MOLE, introduced in 1974, involved bathing the sample in laser light over a large area and then transferring an image of the sample onto a camera after a Raman wavelength was selected with the spectrograph. Curiously, products introduced by Renishaw, Hoffman Estates, Illinois (circa 1990) and ChemImage, Pittsburgh, Pennsylvania (circa 1995) also were designed around this concept. Unfortunately, in our experience, good Raman images of real world samples were few. This was not due to any optical problem, as the image in the first of our columns demonstrates. There were three problems — low sensitivity, the inability to deal with fluorescing samples, and the lack of confocality. There was little camera control and software at the time (at least on Raman products) to optimize images from samples with low Raman signals. But more importantly, this method of producing images had no means to minimize fluorescence. The laser flux at any spot was not very high, so the "laser quenching" was not active. Raman light was collected nonconfocally, so there was no means to separate the fluorescence (that was known to migrate away from the point of illumination because of its finite lifetime) from the Raman signal.
Now we fast forward to 2007. Instruments have been made smaller, faster, and easier to use for more than 15 years. During this period, people have been using them to characterize all kinds of materials, and to solve problems. The measurements are now more practical for real-world samples because fluorescence is less of an issue. This follows from several facts. The first is the capability of the microscope to avoid or minimize fluorescence. This is a result of the high laser intensity "quenching" the fluorescence impurities, the confocal optics rejecting the "out-of-focus" fluorescence (due to fluorescence migration during the excited state lifetime), and the selection of low fluorescing regions. In addition, air-cooled lasers, including HeNe (633 nm) and diodes (785–830 nm) are useful sources, and the long wavelengths often avoid exciting the fluorescence background.
So now analysts want to record chemical images of their interesting samples. There are several schemes for recording Raman images. The differences originate in the methods of illumination and detection. The "global imaging" scheme was described earlier and is shown in Figure 1a; this method is totally nonconfocal. At the other end of the spectrum of methods is the point illumination with detection of full spectra at each point (Figure 1b). There are also methods intermediate between these two methods with either line-focus or line-scanning illumination; the line-scanning method is shown in Figure 1c. In these cases, the line is imaged onto the slit of the spectrograph and the data collection is "multiplexed" by acquiring spectra along a line of points, which are conjugated to the long dimension of the slit and to the short dimension of the charge-coupled device (CCD).

Figure 1
The global illumination concept works best when the Raman signals of the various species to be imaged have well-separated lines, and when the baselines are minimal. Unfortunately, the reality is that this often is not the case. Raman signals almost always are accompanied by significant backgrounds. But even more importantly, the Raman signatures of complex molecules have so many lines that differentiating between them by selecting unique frequency shifts is often impossible. The irony is that the very property that makes Raman spectra so useful — the high information content of the spectra — makes implementation of Raman imaging a challenge requiring multivariate techniques.
In the following sections, I will show some examples of successful Raman imaging in which the information derived could not have been derived by other means.

Figure 2
Pathology
In collaboration with Jose Centeno at the Armed Forces Institute of Pathology (AFIP), an institute at the Walter Reed Army Medical Center (Washington, DC), we produced several maps of foreign material in histological sections derived from biopsies. These examples (Figures 2 and 3) show the presence of a cotton fiber, and silicone with urethane.
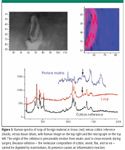
Figure 3
Pharmaceuticals
The pharmaceutical industry has shown interest in Raman for documenting material composition and distribution. In particular, a Raman image has the potential to document the distribution of the various species — the active pharmaceutical ingredient (API), the carriers (for example, polymers), and the other excipients. On the down side, it has been said that the spatial resolution of the Raman microscope is overkill. Particles in pharmaceutical tablets typically are at least 20 μm in size, so a map of a complete tablet with a 1-μm interval between pixels would be extremely large and would take so long to record that it would not be practical. In spite of this, some studies have been found to be useful. The images in Figure 4 show the results of a map of a pharmaceutical tablet taken rapidly with 100-μm steps, at intermediate speed with 50-μm steps, and slowly with high spatial clarity with 10-μm steps. Even the lowest resolution map provides a reasonable estimate of the components in the sample. As the spatial information increased, the ability to extract morphological and statistical information increases. Even more important is the ability to detect minor components in the interstitial spaces between particles.
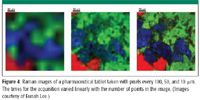
Figure 4
Figure 5 shows an example in which an unexpected minor component, magnesium stearate, was detected. This example came from a collaboration with Mark Witkowski at the FDA Forensics Center in Cincinnati, Ohio. A series of seized suspect counterfeit tablets were mapped to confirm that the tablets did not come from the manufacturer of label. Preliminary FT-IR measurements indicated the overall composition of the tablet. In all cases examined, the presence of the correct API was confirmed but the excipients were clearly different. The Raman image shown in Figure 5 was constructed using "factors" generated by multivariate analysis. Factors are spectra reconstructed from the multifile using ISys (Malvern, UK), a statistical software package designed for this type of manipulation. In the manipulations performed, the factors of the minor components (that coincidentally were weak Raman scatterers) appeared and are mapped in the image. The starch, in fact, was observed while surfing the file, but it was the magnesium stearate that really only emerged after factor rotation. Magnesium stearate is added as an aid to mixing and as a mold-release agent. If it for some reason coats the API, the bioavailability of the API will be reduced significantly.
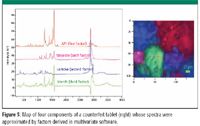
Figure 5
So we started out this section by saying that the spatial resolution of Raman microscopy is too high to be useful when studying pharmaceutical tablets because the typical particle size is more than 20 times greater than the probe volume. But then we saw that the high spatial resolution provided information that is not available from near-IR or FT-IR just because of the spatial resolution.
The challenge to usefully implement Raman imaging in studying tablets is to be able to map a complete tablet. As described earlier, a map of a complete tablet with 1-μm spatial resolution would be impractical. However, a new scanning mechanism provides the ability to excite a complete tablet with pixels from 1 μm to sizes as large as 100 μm while still collecting Raman light efficiently with the high numerical aperture of the high magnification objectives. Figure 6a shows a three-color image of an entire tablet constructed by selecting the bands indicated in the spectrum in Figure 6b.

Figure 6
Geology
A Raman microscope can be used to study minerals as well as fluid inclusions in rock samples. The example shown in Figure 7 is a Raman image of a fluid inclusion in a quartz specimen — the fluid is shown to contain water, gas (carbon dioxide and methane), and calcite (CaCO3) precipitated from calcium ions in the water and carbonic acid (H2CO3), produced by the dissolution of carbon dioxide in water.
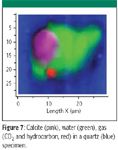
Figure 7
The Raman microscope has come to be an almost routine tool in the hands of geologists who are looking to know the composition of retrieved rocks in order to obtain information about the history of the formation, or to derive information about valuable resources. The composition of fluid inclusions has been especially useful for petroleum discovery. The composition of the minerals themselves (mixed oxides and their crystalline phases) has been useful for metal prospecting.
Conclusion
These examples have established the amazing information provided by Raman chemical maps. So one of the next questions might be, what is the smallest feature that can be imaged? This is, in fact, of primary interest to the integrated circuit industry, where feature sizes are now approaching 45 nm! My next column installment will address the spatial resolution of Raman microscopy, as well as techniques to improve the speed of mapping. What is to be expected, theoretically, what kinds of instrument developments are pushing the limits, and how do we measure what we are actually achieving?
Thanks for your interest! Send me your reactions.
Reference
(1) M. Delhaye and P. Dhamelincourt, J. Raman Spectrosc. 3, 33–43 (1975).
Fran Adar, the new editor of "Molecular Spectroscopy Workbench," is the Worldwide Raman Applications manager for Horiba Jobin Yvon (Edison, NJ). She can be reached by email at: fran.adar@jobinyvon.com

AI-Powered SERS Spectroscopy Breakthrough Boosts Safety of Medicinal Food Products
April 16th 2025A new deep learning-enhanced spectroscopic platform—SERSome—developed by researchers in China and Finland, identifies medicinal and edible homologs (MEHs) with 98% accuracy. This innovation could revolutionize safety and quality control in the growing MEH market.
New Raman Spectroscopy Method Enhances Real-Time Monitoring Across Fermentation Processes
April 15th 2025Researchers at Delft University of Technology have developed a novel method using single compound spectra to enhance the transferability and accuracy of Raman spectroscopy models for real-time fermentation monitoring.
Nanometer-Scale Studies Using Tip Enhanced Raman Spectroscopy
February 8th 2013Volker Deckert, the winner of the 2013 Charles Mann Award, is advancing the use of tip enhanced Raman spectroscopy (TERS) to push the lateral resolution of vibrational spectroscopy well below the Abbe limit, to achieve single-molecule sensitivity. Because the tip can be moved with sub-nanometer precision, structural information with unmatched spatial resolution can be achieved without the need of specific labels.