Raman Polarization Measurements: Keeping Track of the Instrumental Components’ Behavior
Controlling the orientation of the laser and Raman polarization relative to the sample orientation can provide a wealth of information in the Raman spectrum that would be difficult to achieve by other methods. Presentation of the spectra makes these effects appear straightforward, but because of multiple instrumental factors, and experimental design, it is easy to produce erroneous results. This column is going to explain what instrumental components affect the polarization effects that are observed, and how the sample setup itself affects the Raman signal.
Controlling the orientation of the laser and Raman polarization relative to the sample orientation can provide a wealth of information in the Raman spectrum that would be difficult to achieve by other methods. Presentation of the spectra makes these effects appear straightforward, but because of multiple instrumental factors, and experimental design, it is easy to produce erroneous results. This column is going to explain what instrumental components affect the polarization effects that are observed, and how the sample setup itself affects the Raman signal.
Both David Tuschel and I have written columns that have discussed the role that polarization measurements can have in characterizing a material when measuring its Raman signal. The origin of the dependence of the Raman signal on polarization can be explained by noting that there are two photons in the Raman process-the exciting (laser) photon and the scattered (Raman) photon. How the two will be related in a given experiment depends on the “Raman tensor.” For those of you who did not study group theory or matrix algebra, this concept is probably a mystery. What the group theory does is to determine the symmetry of the molecule or crystal that one is studying; then within that symmetry class the Raman tensor will describe how the polarization of the incoming photon will be transformed to the Raman photon during the scattering process. Because the scattering is mediated by a vibration, the symmetry of a vibration determines the polarization transformation and there is a different Raman tensor for each normal mode of atomic motion. If you are new to these concepts, you will probably find this column difficult and tedious to follow. However, it is useful to have all these concepts in one place so that anyone who wants to make this type of measurement has a resource for the methodology.
Why Is Polarization Analysis Important?
This concept will probably make more sense if we consider concrete examples. Carbon tetrachloride (CCl4) is one molecule that is often cited. (At one time it was a material that was used for checking an instrument’s performance, but because of its toxicity it is no longer used for this purpose.) It is a “tetrahedral” molecule, which means that if one visualizes it in space all three axes are equivalent. If you imagine how the atoms move during a vibration, you will see that there is a vibrational mode in which all four chlorine atoms will move simultaneously (in phase) toward and away from the carbon atom in the center. The “symmetry” (that is, the molecule’s shape) does not change during this vibration. The laser photon interacts with the electronic distribution and sets up an oscillating polarization whose axis is determined by the photon’s electric field. If a photon is reradiated from this molecule that is vibrating in this “totally symmetric” mode, the photon will exit with the same polarization in which it originally interacted with the molecule. The scattering is termed “polarized.” But the atoms can move in other ways, in which case the molecule does change shape during the vibration. In this case, the reradiated photon can come out with polarization along a different direction. Then the scattering is termed “depolarized.” Group theory, or matrix algebra, is a type of math that can describe this behavior. After the symmetry properties of the molecule are determined, a finite number of vibrations defined by the motion of the atoms are characterized within the symmetry type of the molecule. Then the matrix algebra predicts how the two photons will be related for the different vibrations; these predictions are encoded in the character table of the symmetry group. The symmetry of each vibration determines the form of the Raman tensor that relates the polarization of the two photons.
Figure 1 illustrates these ideas for CCl4 (or methane [CH4] or other molecules of the same form). The way to understand this figure is to realize that there are nine independent ways that the atoms can move. These motions can be grouped into the A1-type motion, the symmetric stretch that we described above, the E-type motion, which is doubly degenerate (which means that there are two vibrations with the same energy) and Raman inactive, and two vibrations of F2 symmetry that are each triply degenerate. [You may see these vibrations referred to as T type. T and F are used interchangeably for triply degenerate vibrational modes.]
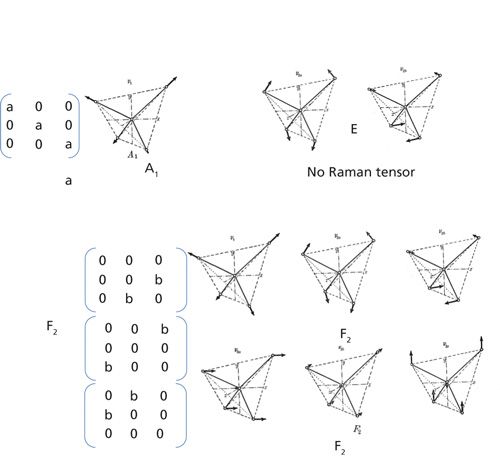
Figure 1: Atomic motion of the atoms in CCl4 and CH4 during different “normal modes” of vibration. There are two modes with F2 symmetry that have the same pattern in the Raman tensor (but with different values for the coefficient). The E-type motion has no Raman tensor, which means that it is not Raman active. The figures depicting the atomic motion were adapted from Figure 41 in reference 1.
Remember that CCl4 will be either liquid or gaseous; the molecules will be randomly oriented, and in doing polarized Raman spectroscopy, you will be measuring the scattering averaged over all the orientations. No matter how the polarization of the laser is oriented relative to a molecule, the Raman light will have the same polarization as the laser if the scattering is produced by the symmetric vibration. The ratio of the light polarized perpendicular to the laser polarization divided by the light polarized parallel to the laser polarization is close to 0. But for the asymmetric F2 vibrations, the light collected with polarization perpendicular to the laser polarization ratioed to the light collected with parallel polarization will be related by a factor less than 0.75. This ratio is called the polarization ratio.
In the early days of vibrational spectroscopy, Raman and IR were used together to determine the way atoms are bonded in a particular molecule. For instance, vibrational spectroscopy solved the enigma of whether benzene exhibited sixfold symmetry (resonance stabilization of the π electrons) or threefold symmetry (alternating single and double bonds in the ring). The form with sixfold symmetry would have a center of symmetry in the middle of the ring, and the other with threefold symmetry would not. That difference made the differentiation by vibrational spectroscopy unequivocal. If there is a center of symmetry no vibration will appear in both the Raman and the IR spectra. Therefore it was determined that benzene is a flat molecule with a center of symmetry and a sixfold axis normal to the plane.
When using the microscope we are usually studying solid materials where the focus is different-rather than determining molecular symmetry, we are interested in determining crystalline phase or orientation of crystals or extruded polymers. Not only must we be concerned about the polarizations of the two light beams, but we must be concerned with the orientation of the sample in the instrument. And there are issues of grating sensitivity for the two polarizations. This column is going to be an attempt to describe all of the relevant instrumental parameters that determine the polarization behavior and how to keep everything under control so that the final measurements are meaningful.
To illustrate the points that I will be trying to make, I will use data from oriented fibers of polyethylene terephthalate (PET). I originally showed that polarized Raman microscopy can provide information on the orientation and crystallinity of these fibers (2). While I was making these measurements I discovered the possible artifacts that can confound the measurements. When we examine a fiber of a highly oriented PET fiber, the spectra should appear as shown in Figure 2. Because of the axial symmetry of a fiber, I define polarization in a cylindrical system: Z is the fiber direction, and R is one of the radial directions. When the laser and Raman polarization are along the fiber axis, the intensities are (sometimes much) stronger and the band at 1000 cm-1 appears only in that spectrum. However, if you make a measurement with the fiber mounted in the NS (north–south) versus EW (east–west) direction on the stage, using Z polarization for both the laser polarization and the Raman polarization, you may get very different spectra. Figure 3 shows the ZZ spectrum taken with the two orientations of the fiber, first with an 1800-g/mm grating (top), and then a 300-g/mm grating (bottom). For a given grating configuration, which provides fixed dispersion, the intensities should be the same in the two orientations, but they are not because the grating reflectivity varies with polarization. That difference is greater for the higher groove density grating than for a lower groove density grating, being a factor of about 3 for the 1800-g/mm grating, and about 1.2 for the 300-g/mm grating.
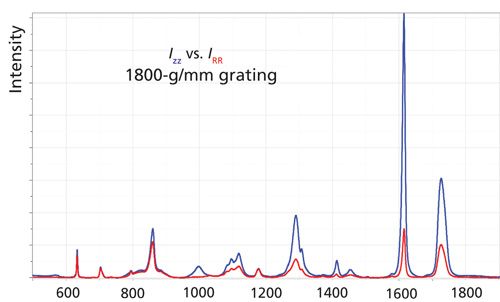
Figure 2:ZZ and RR Raman spectra of a fiber of polyethylene terephthalate that had been spun at 2500 m/min from the melt and then drawn at room temperature.
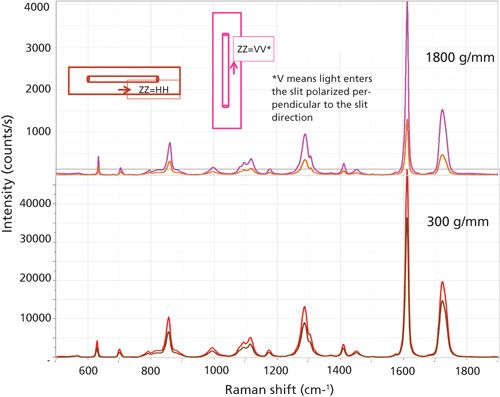
Figure 3: Polarized Raman spectra of single 7-mm fiber of PET recorded on an Evolution spectrometer (800 mm focal length) with a 633-nm laser and the sample mounted EW on the microscope stage (orange/brown traces) vs. NS on the microscope stage (red/pink traces). The top traces were measured with an 1800-g/mm grating, the bottom with a 300-g/mm grating.
The following section will describe the instrumental factors that make these spectra different.
Instrumental Effects
There are several important instrument parameters that influence these measurements. The biggest effect can be the grating as can be seen in Figure 3, but the beam splitter (injection–rejection filter) may also have a significant influence. In addition, even though the laser is polarized, its polarization direction can be rotated, and high numerical aperture (NA) objectives may scramble the polarization (although this effect has been measured to be small).
Figure 4 illustrates the major components in a Raman microscope. Significant polarization characteristics are present for the laser, the injection–rejection filter (that is, the beam splitter), and grating reflectivity. To control the laser and Raman polarization, there will be components to control or select the polarization and other components that will compensate for detectivity differences. A half-wave (or quarter-wave) plate can be mounted between the laser and the entrance to the microscope. In the Raman analysis path one can use a polarization analyzer and either a scrambler or an achromatic half-wave plate. Each of these possibilities will be described so that you will be able to understand and design your experiment.
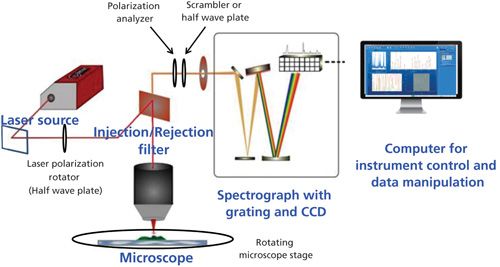
Figure 4: Components of a Raman microscope. Components necessary for polarization measurements include the laser polarization rotator, the Raman polarization analyzer, the scrambler or half-wave plate in the Raman beam, and a rotating microscope stage.
Grating Polarization Characteristics
I will start with the grating characteristics that can produce major effects on the instrumentation output. The issue is that the reflectivity of all gratings depends on the polarization, the detecting wavelength, the groove density, and the groove profile. These characteristics depend on the fundamental physics of the reflection process itself. The manufacturer of your monochromator has selected a grating groove density to provide the desired dispersion (which determines the spectral resolution). Then from a grating manufacturer’s inventory, a grating is selected to provide good reflectivity over the region of use. The top of Figure 5 shows the reflectivity curves for an 1800-g/mm grating, which is often used in a Raman instrument when exciting the spectrum with a green laser. You can see that the reflectivity is quite high for one polarization at 600 nm. On the other hand, at near-infrared (NIR) wavelengths the reflectivity of the second polarization is about a factor of 5 lower. In contrast the reflectivity curves for a 300-g/mm grating, also optimized for 500 nm, shows reflectivity values that vary at most by 20%. It is not unusual for lower groove density gratings to have more-uniform behavior than that of the high grove density gratings.
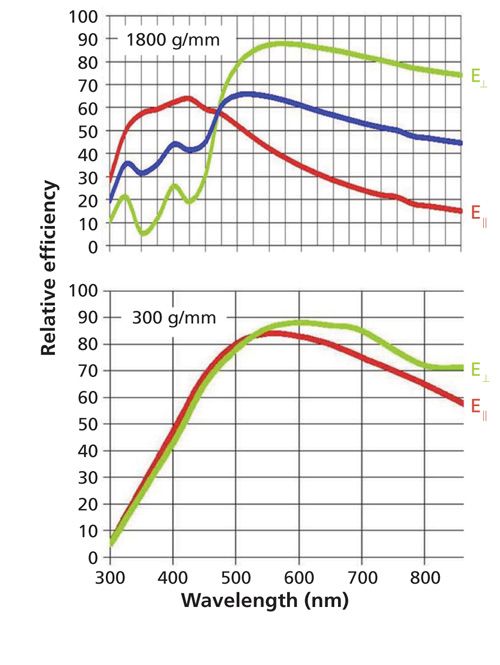
Figure 5: Grating reflectivity curves for 1800-g/mm (top) and 300-g/mm (bottom) gratings optimized for wavelengths near 500 nm. The polarization of the light on the long wavelength side of these curves for higher reflectivity is termed E⊥ which means perpendicular to the grooves of the grating.
Figure 6 shows grating curves for three 1200-g/mm gratings optimized (from top to bottom) at 750, 630, and 500 nm. (This optimization is achieved by tailoring the groove profile of the grating, which is done by ion-etching holographic gratings or selecting the facet shape in a diamond ruling machine for classically ruled gratings.) As the wavelength of optimization is shifted, the crossover point shifts. In addition, all three gratings exhibit similar Wood’s anomalies; the shape of the grooves controls the characteristics of these anomalies. In fact, the reflectivity curve for the holographic 1200-g/mm grating that has not been optimized (not shown) exhibits a very deep and sharp dip in the reflectivity near 650 nm. Anyone who is interested in more details regarding these phenomena, can refer to information on gratings on the Horiba website (3). One other point of note is that the relative intensities of the two curves can vary by a factor of 2 in the range of use, or by more than a factor of 10 farther out. Because Raman polarization studies involve measuring the signals at both polarizations, it is necessary to take these differences into account in the experimental design.
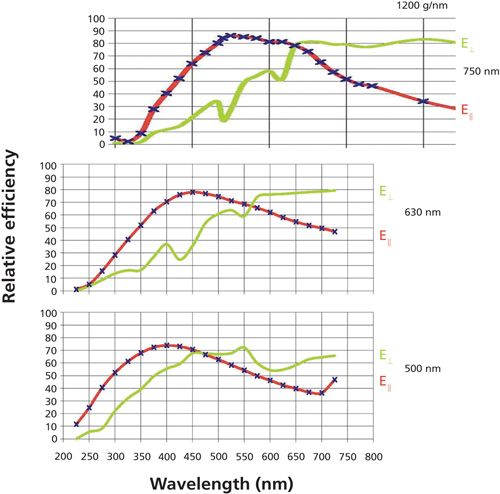
Figure 6: Grating reflectivity curves for 1200-g/mm gratings optimized at 750 (top), 630 (middle), and 500 (bottom) nm. Note that all gratings exhibit similar Wood’s anomalies.
If one chooses to measure the Raman signals for the two polarization orientations of the analyzer with respect to the grating grooves, there are several methods to compensate for the differences. A scrambler can be mounted and used for all measurements. A scrambler will “scramble” the polarization of the light as selected by the polarization analyzer after the microscope. It has the effect of producing an “averaged” polarization. Note that for the better polarization there will be a loss of intensity. To take advantage of the higher reflectivity of the perpendicular component, there is another solution. When selecting the perpendicular component no extra component is necessary. But when selecting the parallel component, an achromatic half-wave plate is added to rotate the selected polarization back to the favored orientation. While this approach will achieve higher signals, it requires more vigilance on the part of the experimentalist. If the selection of these components is automated, it is possible that the software will have a record of what was used. But in many cases, all of this information will not be recorded electronically.
We still have to define perpendicular and parallel for a given instrument. If you consider how a grating diffracts light, you will see that the entrance slit to the spectrograph has to be parallel to the grooves of the grating. So while you may not be able to visualize the grooves of the grating, you should be able to determine what is the orientation of the slit. The direction that is perpendicular to the slit will be the “perpendicular” direction for the grating. And now you can determine if this is horizontal (H) or vertical (V).
Beamsplitter
Working backward I now want to consider the beamsplitter (the injection-rejection filter). In this case it is important to recognize that the reflectivity of the beam splitter will be different for the two polarizations, again for reasons of the physics of the optics. It is important that the laser polarization be maintained strictly vertical or horizontal in which case the polarization will be maintained (nearly) linear during the reflection. But it is even more important to recognize that if it is desired to measure the polarization dependence as a function of angle between the laser polarization and the sample axis, trying to do this experiment by rotating the laser polarization in increments other than 90° is guaranteed to produce artifacts. That is, the beamsplitter will pass elliptically polarized light if polarization other than vertical or horizontal is presented.
The best solution that I have found to avoid this dilemma is to rotate the sample. That way, all instrument parameters are kept fixed. If it is necessary to make the various polarization measurements on the same microscopic spots, then a sample rotating stage has to be used.
Laser Polarization
The last component in the instrument to be considered is the laser beam itself. Almost all lasers come with vertically polarized light. But depending on how the laser beam is folded into the optical bench, it may end up with horizontal polarization. You will need to confirm that you know what the polarization is at the sample stage. This can be determined fairly easily. With no sample on the microscope stage, place a polarization analyzer on or under the stage, but not in a focal plane (you would burn the polarizer). Allow the laser to pass through the polarizer and place a card underneath so that you can monitor how much laser light is passing. As you rotate the polarizer, look for an orientation of the polarizer that will minimize the laser intensity passing through. In this case you will have “crossed” the polarizer relative to the laser polarization. If your polarizer is well-labeled you will know its polarization direction, and then the laser will be polarized perpendicular to this direction. If it is not clearly labeled, there is a trick to figure it out. Remove the polarizer and look through it at a reflection off the floor or other shiny surface. It turns out that the light that is specularly reflected is polarized perpendicular to the plane of reflection (the plane of reflection is vertical and the polarization of the reflected light is horizontal). Rotate the polarizer until the reflection is minimized. In that position, the E vector being transmitted by the polarizer is as shown in Figure 7. Now carefully label your analyzer.

Figure 7: Simple experiment to confirm the orientation of the polarization axis of a polarizer.
At this point you can accurately determine the orientation of the laser polarization in the plane of the microscope stage. Note that at the sample position, all polarizations are horizontal. For my purposes I have chosen to label the orientations at the microscope stage as either NS (north–south) or EW (east–west). On the systems that I have used, NS does usually correspond to vertical on the optical bench, but depending on how the beam is reflected down and up, this may not be true for all instruments. You will need to confirm this setting, as well as the slit orientation of your system. If you want to excite with the orthogonal laser polarization, you will need to determine what orientation of the polarization rotator that you mount in the laser beam will produce a clean 90° rotation of the laser polarization. To confirm that your laser polarization rotator is correctly rotating the laser polarization, place the polarizer under the microscope stage as you did earlier, but now rotate it by 90°. There should be plenty of laser light passing through. Now rotate the laser polarization rotator and look for a minimum.
Experimental Design-Textile Fiber as an Example
To summarize this discussion I will present the concrete example of polarization measurements on a textile fiber. Textile fibers are almost always oriented to some extent. Melt extrusion of man-made fibers (such as, polyester, polyethylene, nylon, Kevlar, and so on) and growth of natural fibers (cellulose, wool and silk, and so on.) result in molecular orientation. Figure 8 shows how these measurements need to be made for the case where there is no rotating stage, and for the case where there is such a stage. The assumptions in setting up these conditions is that the spectrograph has a horizontal slit (and therefore horizontal grooves on the grating) and that I am working on the long wavelength side of the crossover wavelength on the grating reflectivity curve. Under these conditions the instrument will be more sensitive to V polarization. On my instrument V corresponds to NS and H to EW at the sample stage.
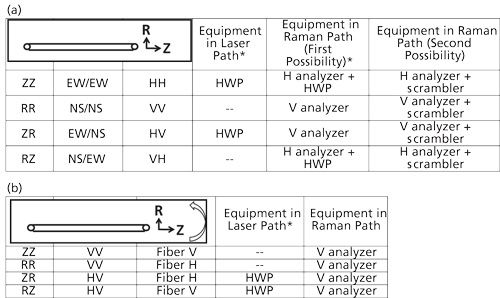
Figure 8: Experimental configuration for Raman polarization measurements of a fiber, with (a) the fiber orientation fixed in the horizontal direction and (b) the fiber mounted on a rotating stage. *The half-wave plate (HWP) can be left in the laser and Raman paths, but oriented in its mount to either rotate the polarization of the light passing through, or not rotate the polarization of the light. This would eliminate the differences in optical transmission due to reflectivity losses at the surfaces of the HWP.
In addition, you can follow the same protocol for measuring a crystal. If you know the crystal axes, you will measure the various components of the Raman tensor of the crystal’s symmetry group. If you cannot recognize the crystal axes from the crystal habit, you can use the behavior of the polarized Raman signal to determine the crystal orientation. In fact, this is what David discussed in his column entitled “Raman Crystallography, in Theory and in Practice” (4).
Summary
What you have seen is that while there is a lot of potential for extracting information from polarized Raman measurements, and making these measurements is straightforward with a few extra components, it is not difficult to overlook something in the setup of the measurement. My hope is that this discussion can aid you in making flawless measurements.
Acknowledgments
My thanks to my colleagues David Tuschel and Sergey Mamedov for a critical reading of this manuscript and for their suggestions that helped to clarify the concepts that I am trying to explain.
References
- G. Herzberg, Molecular Spectra and Molecular Structure II. Infrared and Raman Spectra of Polyatomic Molecules (D. Van Nostrand Co., Inc. Princeton, New Jersey, 1945).
- F. Adar and H. Noether, Polymer26, 1935–1943 (1985).
- http://www.horiba.com/us/en/scientific/products/diffraction-gratings/
- D. Tuschel, Spectroscopy27(3), 22–27 (2012).

Fran Adar is the Principal Raman Applications Scientist for Horiba Scientific in Edison, New Jersey. Direct correspondence to: SpectroscopyEdit@UBM.com.

AI-Powered SERS Spectroscopy Breakthrough Boosts Safety of Medicinal Food Products
April 16th 2025A new deep learning-enhanced spectroscopic platform—SERSome—developed by researchers in China and Finland, identifies medicinal and edible homologs (MEHs) with 98% accuracy. This innovation could revolutionize safety and quality control in the growing MEH market.
New Raman Spectroscopy Method Enhances Real-Time Monitoring Across Fermentation Processes
April 15th 2025Researchers at Delft University of Technology have developed a novel method using single compound spectra to enhance the transferability and accuracy of Raman spectroscopy models for real-time fermentation monitoring.
Nanometer-Scale Studies Using Tip Enhanced Raman Spectroscopy
February 8th 2013Volker Deckert, the winner of the 2013 Charles Mann Award, is advancing the use of tip enhanced Raman spectroscopy (TERS) to push the lateral resolution of vibrational spectroscopy well below the Abbe limit, to achieve single-molecule sensitivity. Because the tip can be moved with sub-nanometer precision, structural information with unmatched spatial resolution can be achieved without the need of specific labels.