Rapid Quality Discrimination of Grape Seed Oil Using an Extreme Machine Learning Approach with Near-Infrared (NIR) Spectroscopy
In this paper, an effective identification method of wavelength variable selection to rapidly discriminate the grape seed oil adulteration by near-infrared (NIR) spectroscopy is investigated. The extreme learning machine (ELM) is employed to build a stable and accurate model, and a firefly algorithm combined with a successive projections algorithm (FA–SPA) is developed to eliminate redundant wavelengths (The model used throughout is called FA–SPA–ELM). The comparison among different models—the partial least squares discriminant analysis (PLS–DA) model, the support vector machine (SVM) model, the least squares support vector machine (LS–SVM), and the FA–SPA–ELM model—demonstrates that the wavelength number of the FA–SPA model can be effectively reduced with a wavelength variable of 17, and the model of FA–SPA–ELM presents the excellent predictive capability. The experimental results show that the proposed novel method could be used to identify adulterated grape seed oil quickly, effectively, and nondestructively.
Grape seed oil contains high content of lipids and bioactive compounds, such as vitamin E, linoleic acid, and proanthocyanidins, among other components (1,2). The total proanthocyanidins of grape seed oil have been demonstrated to offer benefits for antioxidant, anti-inflammatory, antihypertensive, and hypocholesterolemic activities (3,4). Additionally, grape seed oil has effect on anti-aging, radical-scavenging properties, and the protection against DNA damage (5). The results indicate that grape seed oil is a kind of senior health edible oil that has high nutrition health value and pharmacotherapy efficacy. However, adulterated grape seed oil is sometimes sold with other cheap edible oils by some producers so as to earn larger profits, thus disturbing the market and causing damage to the health of consumers. Therefore, it is of great value to employ rapid detecting techniques to discriminate the quality of grape seed oil.
Conventional methods detecting the quality of edible oils are mainly based on high performance liquid chromatography (HPLC), gas chromatography (LC), and thin-layer chromatography; however, these approaches are expensive, time-consuming, and require a plentiful supply of samples (6). Near-infrared (NIR) spectroscopy primarily measures the molecular vibrations of C-H, O-H, and N-H. Among existing techniques, the NIR spectroscopy technique has been widely applied to the nondestructive and rapid qualitative and quantitative detection of edible oils (7,8). Therefore, this research is intended to provide a potential reference method for detecting adulterated grape seed oil.
However, the full spectrum data measured by NIR contains too much redundant information between adjacent wavelength bands, causing some challenging problems regarding the identification of relevant and effective information, as well as the accuracy of the model. Wavelength selection techniques aim at eliminating the uninformative and interferential wavelength signals, while simultaneously obtaining an optimal subset of informative characteristic wavelength variables from the NIR spectrum (9). Among all different types of wavelength selection techniques, the swarm intelligence optimization algorithms are more interesting, because they simulate the social behavior of animals and insects to acquire the shortest path between a food source and their nests. Compared with the conventional optimization techniques, these techniques employ a stochastic, probabilistic, and crowd search process rather than a single solution. However, the number of the wavelength selected is still large, and it is easy to fall into a local optimal point through the swarm intelligence optimization algorithms. Hence, a genetic algorithm with a successive projections algorithm (GA–SPA) (10), a uninformative variable elimination with successive projections algorithm (UVE–SPA) (11), and a successive projections algorithm with particle swarm optimization (SPA–PSO) (12) are proposed to assist in rectifying these shortages, and to build a stable model using fewer wavelengths.
A high-quality, high-accuracy, and stable model is required for the qualitative analysis of adulteration by NIR spectroscopy. For the spectroscopy-based classification, chemometricians have developed many valuable algorithms, such as the partial least squares discriminant analysis (PLS-DA) (13), the support vector machine (SVM) (14), and the least squares support vector machines (LS–SVM) (15). Specifically, an algorithm for single-hidden layer feed-forward neural networks called an extreme learning machine (ELM) was proposed (16). Differing from the conventional learning algorithms that require adjusting input weights and hidden layer biases, the ELM arbitrarily assigns input weights and hidden layer biases, and calculates the output weights by a generalized inverse method (17). It is reported that ELM brings a higher learning rate, predictive accuracy, and generalization performance (18). As a rapidly developed technology, a large number of applications of the ELM have emerged in recent years (19,20). On the other hand, the ELM combined with NIR to analyze the adulterated grape seed oils has not been reported.
In this paper, an ELM approach is proposed to demonstrate the feasibility of the combination of NIR spectroscopy and the firefly algorithm combined with a successive projections algorithm ELM (FA–SPA–ELM) model in the quality of grape seed oil. NIR spectra is collected from grape seed oil blended with four kinds of different edible oils. FA–SPA is applied to optimize the characteristic wavelength, and then the ELM is built to determine the adulteration of grape seed oil. Moreover, the predictive performance of ELM is evaluated by a comparison with the conventional modeling methods, including the PLS–DA model, the SVM model, and the LS–SVM model.
This paper also formulates the oil samples, the spectral data collection, and the methods used throughout, as well as provides the experimental comparison and results to verify the effectiveness of the FA–SPA–ELM model.
Materials and Methods
In this section, the mixing of oil samples, the collection of NIR spectra, and the partition of the samples are described in detail. The flow chart of wavelength selection, and the structure and application of the ELM neural network in the research, are illustrated as well.
Oil Samples
The grape seed oil, soybean oil, peanut oil, corn oil, and sunflower oil employed in this study were purchased at the local market. The grape seed oil was mixed with different amounts of soybean oil, peanut oil, corn oil, and sunflower oil to obtain the calibration and prediction set of 31 adulteration samples, respectively. These samples were prepared in volumetric flasks of 200 mL. In the samples of the adulterated grape seed oil, the volume content of the other four oils ranged from 0 mL to 200 mL, with increments of 5 mL, respectively.
Spectral Collection
The spectra data were acquired by the measurement system consisting of oil samples, the Fourier transform near-infrared (FT-NIR) Antaris II spectrometer, and a laptop. The oil samples were put into the spectrometer to measure spectral information. The spectral data were obtained by the spectrum information acquisition software, and saved as a .csv file (including wavelength values and corresponding absorbance data). Spectral measurement were executed at 25 °C and 60% relative air humidity. The experimental samples were packaged in 10 mm quartz cuvettes. The spectra were scanned in the range of 10,000–4000 cm-1, with the resolution of 16 cm-1 and with 32 replicate scans every time. The spectrum of each sample were analyzed in triplicate, and the average value was taken as the NIR absorption spectrum of the sample.
In this study, 31 samples for each category were divided into a calibration set and a prediction set through the Kennard-Stone (21) algorithm. The calibration set of 21 samples for each category was employed to build the classification model, and the remaining 11 samples were used as a prediction set to evaluate the prediction capability of the model. In the following sections, A1, A2, A3, A4, and A5 represent NIR data of pure grape seed oil, grape seed oil blended with different levels of soybean oil, peanut oil, corn oil, and sunflower oil, respectively.
Selection of Characteristic Wavelength Variables
The full spectral data was weak, owing to the redundant wavelength information. The redundant wavelength information reduced computation speed and accuracy of prediction modeling. Therefore, a firefly algorithm (FA) was applied to screen out characteristic wavelength variables from the NIR spectrum in this work. FA is a swarm intelligence algorithm originally proposed by Yang (22) simulating the social behavior of fireflies that use light to attract mates (23). Yang (24) formulates the following three idealized rules:
(i) All fireflies are unisex, and attract each other;
(ii) Attractiveness is related to their brightness; for any two flashing fireflies, the less brighter one will move towards the brighter one. However, the brightness can decrease as their distance increases. If no one is brighter than a particular firefly, it moves randomly; and
(iii) The brightness of a firefly is determined by the objective function.
The fitness function is defined as:

where RMSEC is root mean square error of calibration based on partial least squares (PLS) regression, N is the number of calibration set samples, yj, 1 ≤ j ≤ N is category labels of the oil samples in calibration set, and yj, 1 ≤ j ≤ N is predictive category labels through the PLS model.
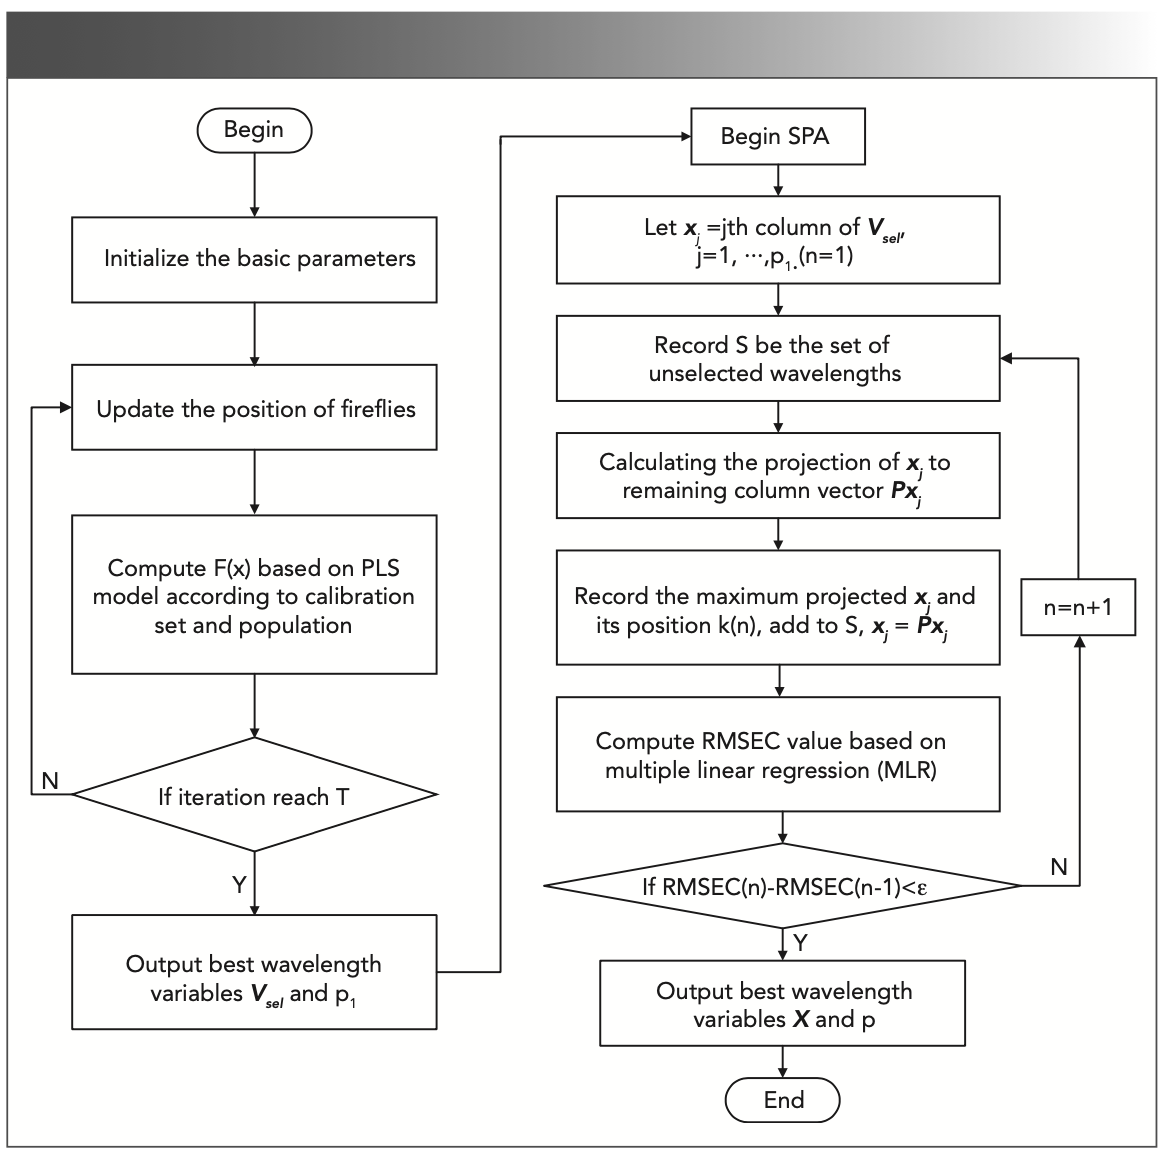
However, the optimized characteristic wavelengths by FA are still vast, and contain collinear interference. These wavelengths are time-consuming to obtain, and unstable when used to establish classification models. The successive projections algorithm (SPA) is a forward selection method that uses vector projection analysis in the spectral matrix to minimize variable collinearity. SPA is used to extract efficient wavelengths further. The basic principle of SPA starts with one wavelength incorporates another wavelength at each iteration, until a specified number of wavelengths is reached. For each iteration, the combination of wavelength information is selected for constructing multiple linear regression models and calculating the RMSEC. When the value of RMSEC reaches a minimum and tends to be stable, the corresponding preferred wavelength number is the optimal wavelength combination.
Figure 1 shows the flow of the characteristic wavelength selection by FA combined with SPA, where p0 is the dimension of the spectral, Vsel is the wavelength variable matrix for the N calibration set and p1 wavelengths selected by FA, and X is the wavelength variable matrix for N calibration set and p wavelengths selected by SPA.
FIGURE 1: The flow chart of FA combined with SPA.
The ELM Classification Model
The ELM classification model is a simple and practical single-hidden layer feedforward neural network proposed by Guangbin in 2006 (25). ELM can effectively overcome the issue of traditional neural networks, such as the complexity of training parameters, and the problem of local optimum. Here, there is N training spectra samples {X,Y} = {xj, yj}Nj=1 to be employed to establish the classification model between the spectra and category labels, where xj is the measured spectra absorbance of the jth sample, and xj = [xj1, xj2,...,xjp}T, xjk, and k = 1,...p are the selected optimal wavelength by the firefly algorithm combined with successive projections algorithm FA–SPA; yj = [yj1, yj2,...,yjq}T is the category labels of the jth sample, where q is the dimension of the category labels, yjk ε {0,1}, yjk = 1 means the spectral data is labeled as Class k.
For the jth sample, the ELM classification model can be mathematically modeled as follows:

where m is the number of the hidden nodes and g(x) is the activation function determined with sigmoid function, i = 1, 2,..., m, wj is the input weight vector connecting input nodes with the hide node, bi is the hidden layer vector bias corresponding to its hidden node, and βik is the output weight vector connecting the output nodes with the hide node; w and b are assigned arbitrarily.
For N samples, the equation [2] can be abbreviated as:

where

and

For given number of the hidden m, input weight w1, and the hidden layer biases bi is to estimate β such that the output least-squares error of the model is minimized. It is directly equivalent to solve the following optimization problem:

where

is the estimated value of β and its solution is:

H† is the Moore-Penrose generalized inverse of the hidden layer output matrix H.
Given a calibration set, the sigmoid function g(x), and the hidden node number m (details see results and discussion), the ELM algorithm can be realized according to the following procedure:
Step 1: Generate input weight wi and the hidden layer biases bi randomly, i=1, 2, ... , m.
Step 2: Calculate the hidden layer output matrix H according to equation [4].
Step 3: Calculate the output weight according to equation [6].
Results and Discussion
Spectral Analysis
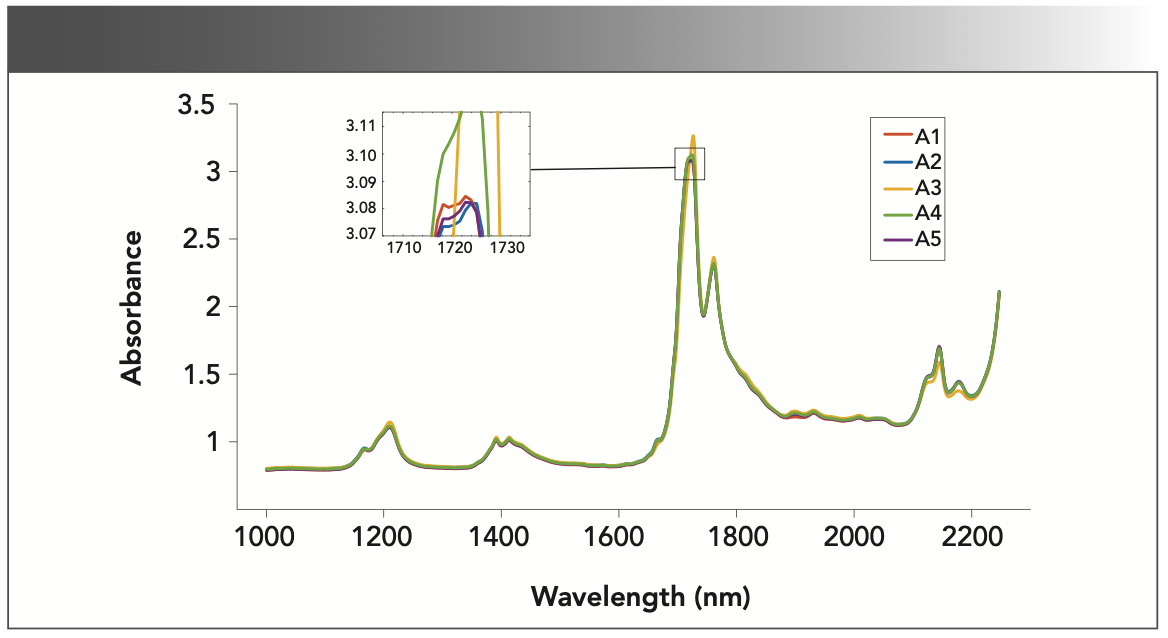
Spectral data in the wavelength range from 1000 to 2300 nm are taken as the analytic spectral data. The spectrum of grape seed oil mixed with different vegetable oils and pure grape seed oil are shown in Figure 2. It can be observed that the differences between the spectra are extremely small, and it is hard to make distinctions directly. However, when enlarged at a local position, for example, and the major spectral bands presented in 1660–1820 nm and 2100–2200 nm, there is a difference in the spectrum of all samples. The reason is that vegetable oils contain some unsaturated fatty acids, such as oleic acid, linoleic acid, and some saturated fatty acids. The spectral absorption peak in the 1660–1820 nm region is mainly assigned to the bending vibrations of the -CH2 and -CH3 groups, and the functional groups of CH-CH. The intensity of the absorption peak near 2100–2200 nm corresponds to the cis-double bond stretching vibration of the -CH groups.
FIGURE 2: The NIR spectrum of the adulterated grape seed oil samples; insert is a close-up of 1710 to 1730 nm peak.
The spectral data are collected under the background of the same instrument parameters. The multivariate scatter correction is employed to preprocess the spectrum to eliminate background noise and physical interference, and then the subsequent experiments are carried out.
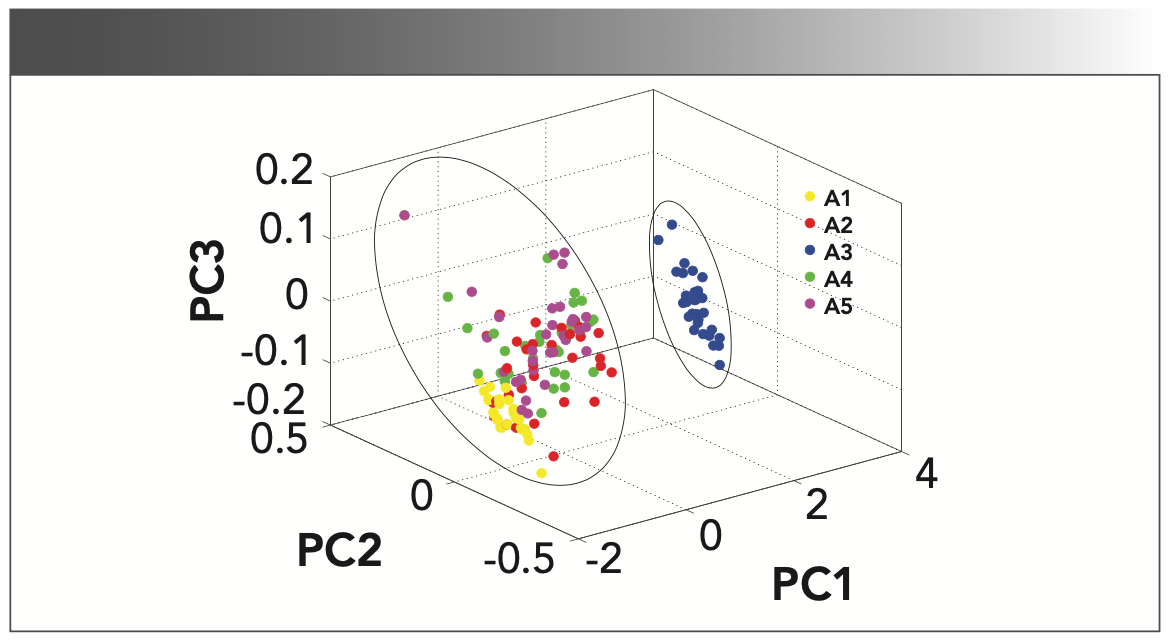
Principal component analysis (PCA) (26) is the most commonly used unsupervised pattern recognition method. This method provides a visual representation of the relationship between samples and variables. In this work, PCA is employed to reduce the dimension to achieve the visualization of the raw features. Figure 3 displays the distribution of the five-class oil samples in PC1-PC2-PC3 space. The results show that the first three PCs explain 99.56% of the variability in spectral data (PC1 = 97.46%, PC2 = 1.39%, and PC3 = 0.72%). It can be seen that the samples in A3—and in A1, A2, A4, A5—are respectively classified into two distinct clusters. However, A1, A2, A4, and A5 are superposed in the PC space, and are not clearly discriminated or classified in the PC space, as shown. Therefore, a new method is needed to extract useful information and overcome the disadvantage of the redundant wavelength information.
FIGURE 3: PCA score plots (PC1, PC2, and PC3) for adulterated grape seed oil. Groups A1 through A5 are shown in different colored dots.
Optimal the Characteristic Wavelength by FA–SPA
The FA–SPA is developed to overcome the disadvantage of the redundant wavelengths, and to optimize it. Moreover, the ELM model is applied to discriminate the adulterated grape seed oil in this work.
To further illustrate the efficiency of the proposed method, FA, SPA, and FA–SPA are respectively employed to make a comparison. The whole spectra contain 1441 spectrum wavelengths.
In FA, the relevant parameters are set as follows: The maximum fluorescence intensity of firefly is 1, the number of step size factor is 0.7, the number of initial firefly population is 50, and the maximum number of iterations is 100. The calibration set of 100 samples are set as input matrix (100 × 1441) to begin the wavelength search through FA.
The iterative process about extracting the characteristic wavelength with FA algorithm is shown in Figure 4. It can be seen that the fitness value increases with the number of iterations increasing, and finally tends to be stable. It means that FA converges to the optimal value successfully. Although the fitness value is increasing, the number of the optimal wavelength does not decrease accordingly. Correspondingly, the number of selected wavelengths constantly rises and falls during the iteration, and finally stabilizes at around 710. As the fitness function value converges to a steady state, the best wavelength combination is extracted, and shown in Figure 5, where the vertical lines represent the selected wavelength. Clearly, the dimension of the selected wavelength is still high, because the superposed spectral absorption peak does not extract well. SPA is then applied to reduce the dimensionality further.
FIGURE 4: Illustration of iteration process plots of FA algorithm.
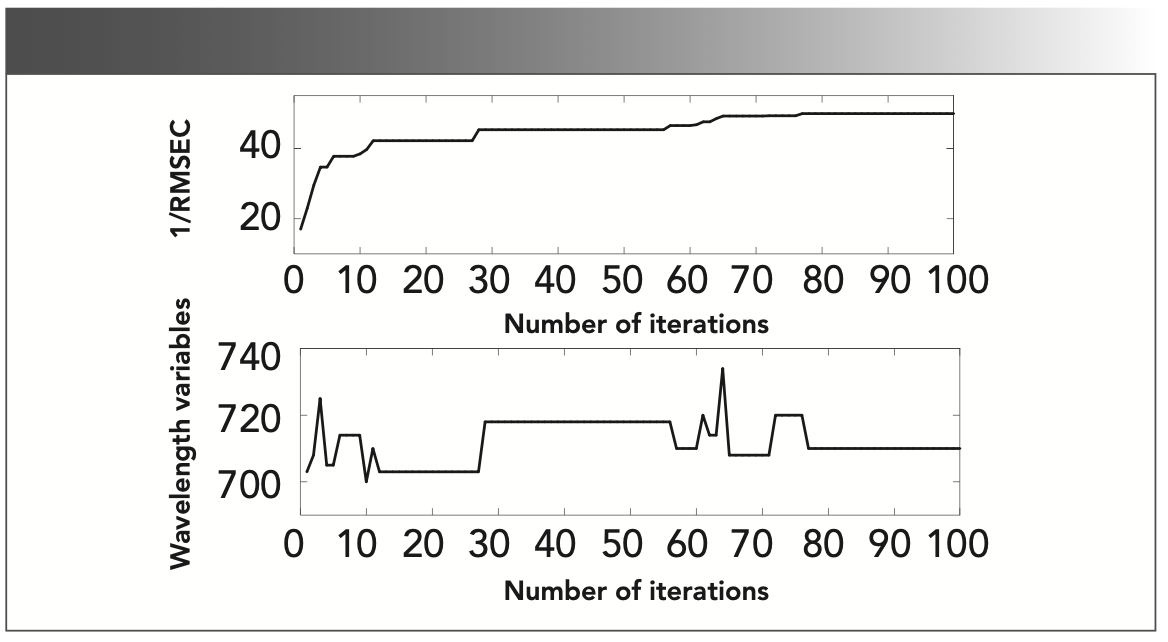
FIGURE 5: A plot of the 710 wavelengths selected by the FA algorithm.
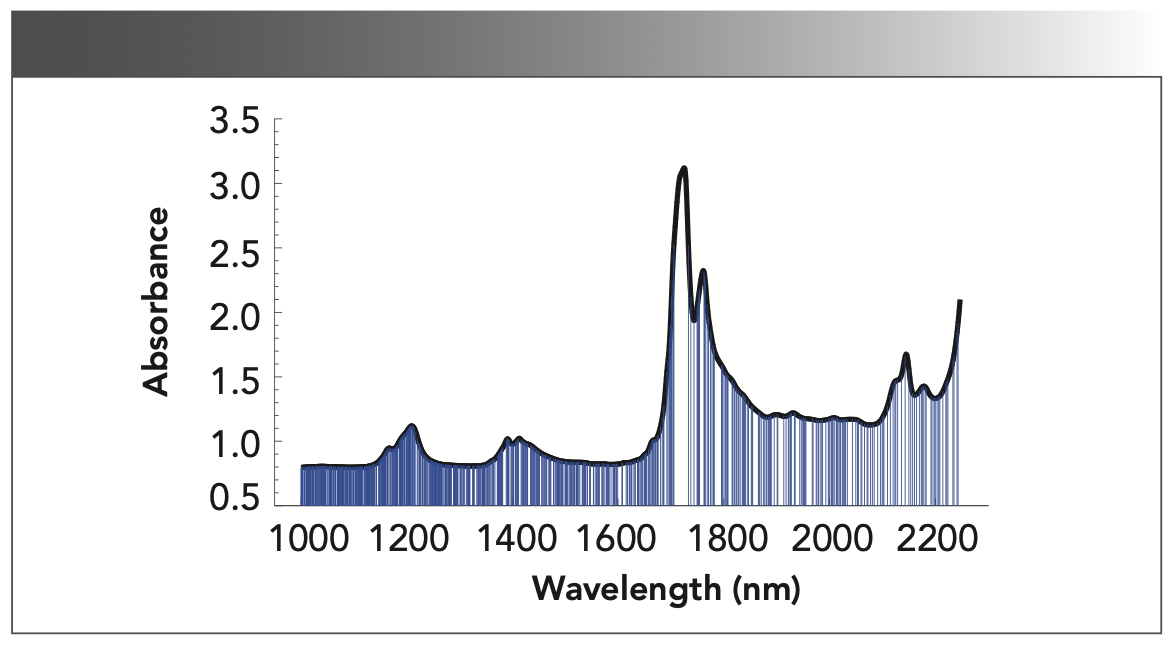
With respect to the SPA, the number of the selected wavelengths is 120, while the optimum value of RMSEC falls to 0.112. Figure 6 shows this optimal wavelength distribution, where the vertical lines represent the selected wavelengths.
FIGURE 6: A plot of the 120 wavelengths selected by SPA algorithm.
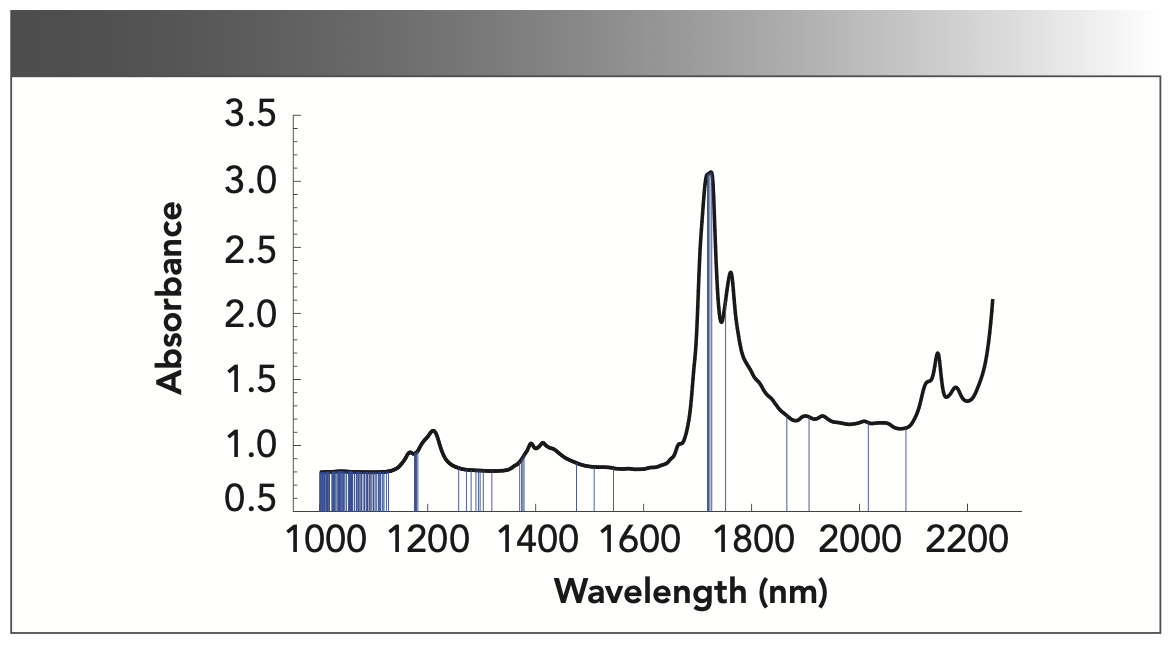
Although the wavelengths are reduced from 1441 to 710 by the FA algorithm, there are still some collinear interferences in the preferred wavelengths. Moreover, FA easily converges into the local optimum. Therefore, to improve the wavelength selection, the FA–SPA for wavelength selection is proposed. Firstly, FA is used to select 710 informative wavelengths, and then SPA is followed to select 17 wavelengths with minimum redundant information from the 710 informative wavelengths. The selected 17 characteristic wavelength variables are 1002, 1004, 1012, 1013, 1016, 1036, 1076, 1124, 1165, 1261, 1378, 1381, 1471, 1546, 1901, 2084, and 2103 nm, respectively.
The results of three wavelength selection methods are summarized in Table I, where RMSEC is the root mean square error of calibration set and RMSEP is the root mean square error of prediction set. The wavelength variables are greatly reduced by FA– SPA. The RMSEC and RMSEP of FA–SPA are 0.382 and 0.264, respectively. Compared with the results of FA and SPA, although the precision of FA–SPA algorithm is a little bit larger, the redundant wavelengths decrease significantly, and the model is greatly simplified. In conclusion, the wavelength selected by FA–SPA is effective.

To summarize, the ELM classification model based on the 17 optimal wavelengths selected by FA–SPA can achieve accurate prediction results. Therefore, although the RMSEC value rises to 0.382, the 17 optimal wavelengths selected by FA–SPA are still efficient and effective.
The Contrast of ELM Model Based on the Three Wavelength Selection Methods
The classification model of ELM is adopted to classify the adulterated grape seed oils. The model shows high discrimination accuracy and stability when using a sigmoid function as the activation function of the single hidden layer. It is critical to select the single hidden layer neurons in ELM modeling analysis. In order to obtain the optimal number of hidden layer neurons, the initial number of neurons in the hidden layer starts from 5, and gradually iterates up to 150 with 5 steps.
In this paper, the ELM model with the full spectrum of 1441 wavelengths (denoted as ELM–FULL), the ELM model with 710 characteristic wavelengths selected by FA (denoted as FA–ELM), and the ELM model with 17 characteristic wavelengths selected by FA–SPA (denoted as FA–SPA–ELM) are constructed from the 100 samples of the calibration set, respectively, and then the models are used to predict the 55 samples from the prediction sets. After several experiments, the performance of the models are optimized when the number of hidden layer neurons in ELM–FULL, FA–ELM, and FA–SPA–ELM model are set to be 100, 70, and 30, respectively. The distinguishing results on the samples of the calibration set and the prediction set by the three models are summarized in Table II.
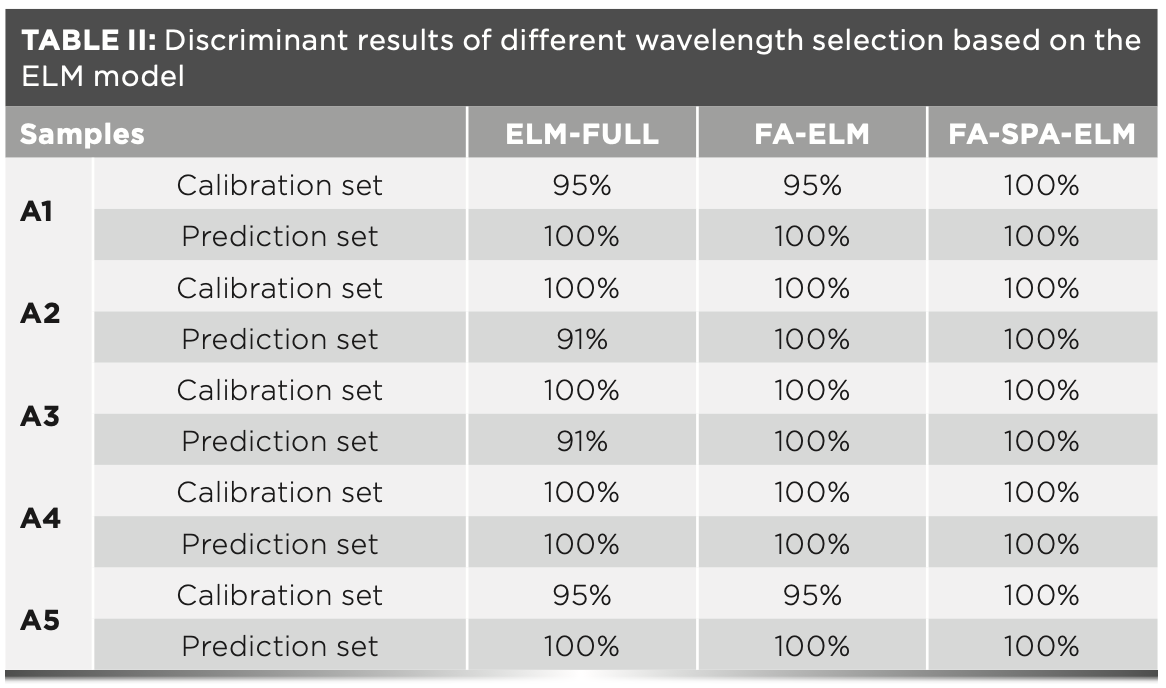
According to Table II, the FA–SPA–ELM model achieves the best predictive performance with the identification rates of 100% for both the calibration set and prediction set. In fact, FA can eliminate the redundant information between wavelengths but there is strong collinearity between the extracting adjacent wavelengths, and SPA can effectively eliminate collinear information. The comparative results demonstrate that although the RMSEC value of FA–SPA in the preceding paragraph rises to 0.382, the selected 17 optimal wavelengths are still effective with the predictive performance of the ELM model. Therefore, it is noteworthy to combine these two algorithms to improve the prediction accuracy of the classification model.
Comparison of the ELM Model and Other Discriminant Models Based on FA–SPA
To compare with the performance of the ELM model, the PLS–DA model, the SVM model, and the LS–SVM model are further built. We set 17 wavelengths optimized by FA–SPA as input variables to establish the four models. The optimal number of PLS– DA variables is set as 15, and the penalty parameters and kernel function parameters of SVM are 90 and 150, respectively; these were obtained by a grid search. The samples of the calibration set and the prediction set are tested by the above four classification models, and the different results can be observed in Table III.
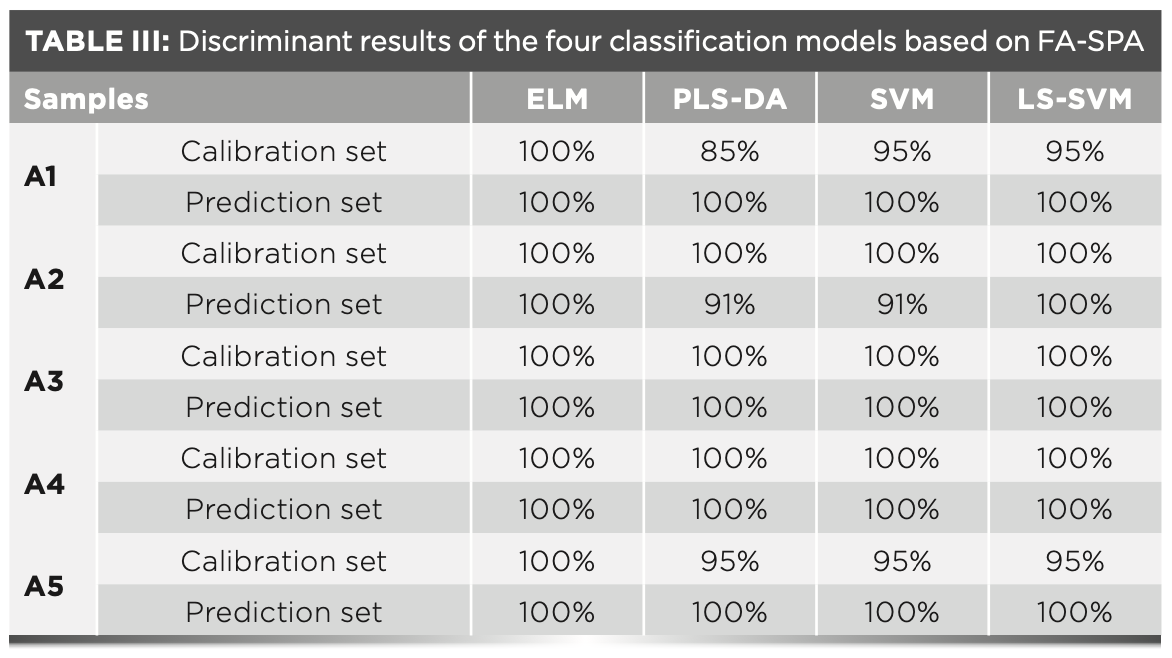
Table III reveals the prediction performance of the four classification models. Compared to the LS–SVM, SVM, and PLS–DA model, the ELM model presents excellent predictive ability. Actually, classification with ELM can be implemented via parallel computations because of its network structure, so it has more potential for real-time applications with a comparable accuracy. The established four models are based on the selected characteristic wavelengths, indicating that the optimization of characteristic wavelength is beneficial to simplifying the model. Overall, the analyzing and comparison of all models indicated the greater ability of the FA-SPA-ELM model to discriminate the adulterated grape seed oil.
Conclusions
In this work, to rapidly and efficiently discriminate the adulterated grape seed oils, the optimized characteristic wavelengths by FA–SPA are developed to establish the ELM discriminant model based on the NIR spectroscopy data at 1000–2300 nm. The results show that FA-SPA can greatly reduce the wavelength variables, with the number of wavelength variables decreased from 1441 to 17. The accuracy, stability, and generalization of the ELM model are further improved based on the selected wavelength variables. This developed FA–SPA–ELM algorithm is effective and promising in identifying the adulterated grape seed oils based on NIR spectroscopy.
References
(1) M.M. Ozcan and F.Y. Al Juhaimi, Chem. Nat. Compd. 53(1), 132–134 (2017).
(2) F.B. Shinagawa, F.C. Santana, E. Araujo et al., Food Sci. Technol. 38(1), 164–171 (2018).
(3) M.D.L.L. Cádiz-Gurrea, I. Borrás-J. Lozano-Sánchez et al., Int. J. Mol. Sci. 18(2), 376 (2017).
(4) D. Praud, M. Parpinel, V. Guercio, et al., Cancer, Causes Control Pap. Symp. 29(2), 261-268 (2018).
(5) Y. Kim, Y. Choi, H. Ham et al., Food Chem. 137(1–4), 136–141 (2013).
(6) J.J. Yuan, C.Z. Wang, H.X. Chen, et al., Int. J. Food Prop. 19(2), 300–313 (2016).
(7) H. Azizian, M.M. Mossoba, A.R. Fardin-Kia, et al., Lipids 50(7), 705–718 (2015).
(8) Z. Li, J. Wang, Y. Xiong, et al., Vib. Spectrosc. 84, 24–29 (2016).
(9) A.M. Rady and D.E. Guyer, Postharvest Biol. Technol. 103, 17–26 (2015).
(10) J.H. Cheng, D.W. Sun, and H. Pu, Food Chem. 197, 855–863 (2016).
(11) S. Ye, D. Wang, and S. Min, Chemom. Intell. Lab. Syst. 91(2), 194–199 (2008).
(12) X. Li, S. Wang, W. Shi, et al., Food Analytical Methods 9(6), 1713–1718 (2016).
(13) P. Bai, J.Wang, H. Yin, et al. Anal. Lett. 50(2), 379–388 (2016).
(14) C.J.C. Burges, Data Mining and Knowledge Discovery 2, 121–167 (1998).
(15) Y. Liu et al., J. Near Infrared Spectrosc. 26(1), 34–43 (2018).
(16) G.B. Huang, Int. J. Mach. Learn. Cybern. 2(2), 107–122 (2011).
(17) Q.Y. Zhu, A.K. Qin, P.N. Suganthan, et al., Pattern Recognit. 38(10), 1759–1763 (2005).
(18) G.B. Huang, Q.Y. Zhu, and C.K.Siew, Neurocomputing 70, 489–501 (2006).
(19) X. Bian, S. Li, M. Fan, et al., Anal. Meth. 8(23), 4674–4679 (2016).
(20) R. Moreno, F. Corona, A. Lendasse et al., Neurocomputing 128, 207–216 (2014).
(21) L. Zhang, G. Li, M. Sun, et al., Infrared Phys. Technol. 86, 116–119 (2017).
(22) X.S. Yang, “Firefly Algorithms for Multimodal Optimization,” in Stochastic Algorithms: Foundations and Applications. SAGA 2009. Lecture Notes in Computer Science, O. Watanabe and T. Zeugmann, Eds.(Springer, Berlin, Germany, vol. 5792).
(23) M. Goodarzi and L. dos Santos Coelho, Anal. Chim. Acta 852, 20–27 (2014).
(24) S.X. Yang, Int. J. of Bio Inspired Computation 2(2), 78–84 (2010).
(25) G.B. Huang, Q.Y. Zhu, and C.K. Siew, Neurocomputing 70(1–3), 489-501 (2006).
(26) L. Gál, M. Oravec, P. Gemeiner, et al. Forensic Sci. Int. 257, 285–292 (2015).
Yang Li is with Concord University College-Fujian Normal University, in Fuzhou, Fujian, China. Direct correspondence to: 61580907@qq.com●

NIR Spectroscopy Explored as Sustainable Approach to Detecting Bovine Mastitis
April 23rd 2025A new study published in Applied Food Research demonstrates that near-infrared spectroscopy (NIRS) can effectively detect subclinical bovine mastitis in milk, offering a fast, non-invasive method to guide targeted antibiotic treatment and support sustainable dairy practices.
Smarter Sensors, Cleaner Earth Using AI and IoT for Pollution Monitoring
April 22nd 2025A global research team has detailed how smart sensors, artificial intelligence (AI), machine learning, and Internet of Things (IoT) technologies are transforming the detection and management of environmental pollutants. Their comprehensive review highlights how spectroscopy and sensor networks are now key tools in real-time pollution tracking.