Simple Method for Monitoring Protein Secondary Structure During Thermal Unfolding and Aggregation
Spectroscopy
Protein secondary structure during thermal unfolding and aggregation is readily acquired using IR spectroscopy and a temperature-controlled mid-IR transmission accessory. Myoglobin was used as a model system to illustrate the method.
Protein secondary structure during thermal unfolding and aggregation is readily acquired using IR spectroscopy and a temperature-controlled mid-IR transmission accessory. Myoglobin was used as a model system to illustrate the method.
FT-IR spectroscopy is a powerful tool for measuring protein secondary structure. Using a temperature-controlled transmission accessory, the evolution of protein secondary structure through thermal transitions is readily accessible. In fact, the experiment and analysis are relatively quick; therefore, a set of proteins can be rapidly screened for stability and temperature-dependent conformational changes. This information is particularly important when evaluating multiple protein mutants.
Experimental
To demonstrate the simplicity of secondary structure evaluation using FT-IR spectroscopy, the well-characterized protein, myoglobin (1), was unfolded in D2O (3.5 µM, 50 µm pathlength) from 25 °C to 90 °C in 5 °C increments using the Falcon Mid-IR Transmission Accessory from PIKE Technologies, Inc. The accessory’s Peltier elements allow for quick ramp rates and temperatures ranging from 5 °C to 130 °C. Temperature profile and spectral data collection was executed by PIKE TempPROTM software. The amide I band was deconvolved by Fourier deconvolution (bandwidth 50 cm-1, enhancement 2) and frequencies were obtained from second derivative spectra.
Results
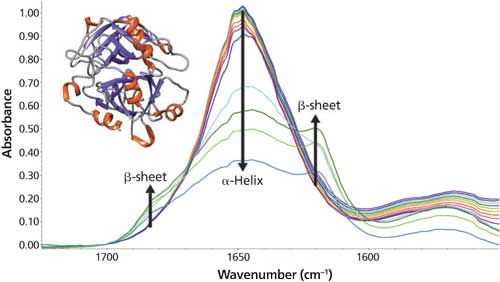
Four peaks dominate the 25 °C spectrum. The largest peak at 1649 cm-1 is assigned to α-helix and random coil structure. From the structure obtained by X-ray diffraction (Figure 1 inset), myoglobin is comprised of several α-helix and random coil regions (2). Two other peaks are observed at 1630 and 1679 cm-1 and correspond to extended chain and turn regions, respectively (1). The last peak at 1612 cm-1 is not amide I vibration but instead tyrosine side chain absorption (3). Thus, from quick spectral manipulation and inspection, the secondary structure at 25 °C is readily determined.

Figure 1: FT-IR spectra of myoglobin between 25 °C and 90 °C. Myoglobin is rendered with UCSF Chimera (4).
As the temperature increases, significant changes in the myoglobin secondary structure are observed. Between 25 °C and 70 °C, the 1649 cm-1 peak height decreases and linewidth increases. These changes in the amide I band reflect increased protein structural disorder. A temperature increase from 70 °C to 75 °C causes a drop in the 1649 cm-1 band intensity. Simultaneously, two peaks grow in at 1683 and 1637 cm-1. These changes indicate conversion of random coil/α-helix to intermolecular β-sheet. Further conversion to β-sheet is observed as the temperature rises to 90 °C. The final β-sheet structure is an insoluble aggregate. This aggregation process is not reversed when the temperature is driven back to 25 °C.
Conclusion
Using the PIKE Falcon accessory makes monitoring the thermal conversion of myoglobin from α-helix to random coil to β-sheet simple.
References
- F. Meersman, L. Smeller, and K. Heremans, Biophys. J.82, 2635 (2002).
- S.V. Evans and G.D. Brayer, J. Mol. Biol.213, 885 (1990).
- A. Barth, Biochim. Biophys. Acta, Bioenerg. 1767, 1073 (2007).
- E.F. Pettersen et al., J. Comput. Chem.25, 1605 (2004).

PIKE Technologies, Inc.
6125 Cottonwood Drive, Madison, WI 53719
tel. (608) 274-2721
Website: www.piketech.com
