Spectral Studies on the Interaction of [Ru(bpy)2(BTIP)]+2 with DNA and Determination of Nucleic Acids at Nanogram Levels
The interaction of [Ru(2, 2'-bipyridine)2(2-benzo[b] thien-2-yl-1H-imidazo[4,5-f][1,10] phenanthroline)]2+ ([Ru(bpy)2(BTIP)]2+) with nucleic acids in weak acidic medium is studied based upon the measurements of resonance light scattering (RLS) and UV–vis absorbance.

The interaction of [Ru(2, 2'-bipyridine)2(2-benzo[b] thien-2-yl-1H-imidazo[4,5-f][1,10] phenanthroline)]2+ ([Ru(bpy)2(BTIP)]2+) with nucleic acids in weak acidic medium is studied based upon the measurements of resonance light scattering (RLS) and UV ;vis absorbance. Intercalation, electrostatic interaction, and long-range assembly are observed between [Ru(bpy)2(BTIP)]2+ and calf-thymus DNA (ctDNA). The enhanced RLS intensity is proportional to the concentration of ctDNA in an appropriate range. Three synthetic samples are analyzed satisfactorily.
The investigation of ruthenium compounds that can bind coordinatively to DNA is one of the most attractive research fields for the development of novel nonplatinum anticancer agents (1–3). Ruthenium complexes generally show fewer toxic side effects than platinum-based drugs and exhibit activity in cisplatin-resistant cells or in cells where cisplatin is totally inactive (4). Moreover, ruthenium has a rich redox chemistry whose complexes in oxidation states two and three are sufficiently stable and under current development as metallopharmaceuticals. Studies on the interaction of ruthenium compounds with DNA are not only able to determine the mechanism of some diseases, but also enable researchers to design new medications with high effective rates and low toxicity, filter new drugs, treat cancer, and alter anticancer medicine.
Since it was found that the RLS technique based upon a conventional fluorescence spectrophotometer could be used for macromolecular analysis (5,6), RLS has turned into one of the important methods for DNA and protein assay. Many negatively charged compounds can aggregate on the surface of protein, which results in the enhancement of the RLS signals and can be applied to protein assays (7–10). Furthermore, a method for the determination of protein based upon the decrease of RLS was proposed (11). Many types of compounds characterized by positive charge that are contrary to DNA can be used to determine DNA. They include porphyrin and its derivatives (12–16), alkaline dyes (17–21), metal cation complexes (22–27), and cation surfactant (28,29), and some anionic dyes can also be applied to DNA detection in the presence of cation surfactant (30). Furthermore, RLS methods for the determination of DNA using zwitterionics (31) and polymers (32) were proposed.
Polypyridyl ruthenium(II) complexes are important complexes in DNA research. They not only show many interesting phenomena while binding to DNA (33,34), but some of them also distinguish B-DNA from Z-DNA (35). Fluorescence methods for the determination of DNA using some polypyridyl ruthenium(II) complexes (36–39) were proposed. Ru(2, 2'-bipyridine)2 (2-benzo[b] thien-2-yl-1H-imidazo[4,5-f][1,10] phenanthroline)2+ ([Ru(bpy)2 (BTIP)]2+)is a new polypyridyl ruthenium(II) complex that was investigated by various spectrophotometric methods and viscosity measurements (40). At the same time, we first found that there are distinct enhanced RLS signals in the system. This implies that the new polypyridyl ruthenium(II) complex can be used as probe reagents just as other probe reagents have been used. We propose a novel method to study the interaction of the ruthenium(II) complex with DNA using RLS. This method will also widen probe reagents for the determination of DNA.
In this study, a good linear relationship is obtained over a wide concentration range. A satisfactory result is obtained for the determination of synthetic samples of DNA. Compared with previous RLS methods (12–32), the proposed method features a relatively low detection limit, a wide linear range, and good precision. At the same time, the reaction mechanism and the influential factors on the variation of RLS between [Ru(bpy)2 (BTIP)]2+ and DNA have been investigated.
Experimental
Apparatus
A model LS-55 spectrometer (PerkinElmer, Shelton, Connecticut) was used to record the RLS intensity. The absorption spectra were recorded with a PerkinElmer model Lambda 25 spectrophotometer. The pH was measured with a model pHS-3C meter (Shanghai Leici Equipment Factory, China).
Reagents
All chemicals are analytical reagents of the best grade commercially available. All stock solutions were prepared in doubly distilled water.
The ctDNA was purchased from Sigma Co. (China). Stock solution of nucleic acid was prepared by dissolving ctDNA in doubly distilled water. This stock needed to be stored at 0–4 °C with only an occasional gentle shake if needed. The solution of ctDNA gave a ratio of UV absorbance of 1.8–1.9 at 260 and 280 nm, indicating that the ctDNA was sufficiently free of protein. The concentration of ctDNA is calculated based upon the absorption at 260 nm (50.0 mg/Lper OD). In this experiment, all working solution of DNA is 27.0 mg/L
[Ru(bpy)2 (BTIP)](ClO4)2 •H2O was synthesized according to reference 40. A 2.5-mg mass of [Ru(bpy)2 (BTIP)](ClO4)2 •H2O was first dissolved in 1 mL DMSO, and then double distilled water was added in a 250-mL volumetric flask and 1 × 10⁻⁵ mol/L [Ru(bpy)2 (BTIP)]2+ stock solution was obtained.
M/25 mixed acid solution was prepared by dissolving 2.47 g H3BO3, 2.71 mL 85% H3PO4, and 2.36 mL acetic acid in a 1000-mL volumetric flask in doubly distilled water, and then adjusting the pH with 0.2 M NaOH solution, so different pH Brittion-Robinson (BR) buffer was obtained.
Experimental Procedure
Into a 5-mL volumetric test tube were successively added 1 mL 1 × 10⁻⁵ mol/L [Ru(bpy)2 (BTIP)]2+ solution, 1 mL pH 6 BR buffer, and an appropriate volume of nucleic acid. The mixture was diluted to the mark with water and mixed thoroughly before RLS measurements. All measurements were made at an ambient temperature. All RLS spectra were obtained by simultaneously scanning the excitation and emission monochromators (namely, Δλ = 0 nm) from 250 to 800 nm. The intensity of RLS was measured at λ = 374 nm in a quartz fluorescence cell with slit width at 3.0 nm for the excitation and emission.
Results and Discussion
Features of RLS Spectra
The RLS spectra of [Ru(bpy)2 (BTIP)]2+ are shown in Figure 1. Both [Ru(bpy)2 (BTIP)]2+ and DNA have low RLS intensities at pH 6.0. However, the mixture of them has high RLS signals, which are due to [Ru(bpy)2 (BTIP)]2+ aggregating on the surface of DNA. The highest RLS peak at 374 nm is selected for the determination of DNA.
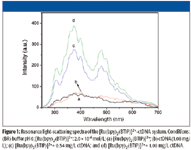
Figure 1
In Figure 2, the absorption spectra of [Ru(bpy)2 (BTIP)]2+ in region 220–700 nm are shown in the absence and presence of DNA. As expected, the absorption intensity of [Ru(bpy)2 (BTIP)]2+ decreases and it is a red shift after adding appropriate DNA. This clearly suggests that [Ru(bpy)2 (BTIP)]2+ interacts with DNA most likely through a stacking interaction between the aromatic chromophore and the DNA base pairs. Hence, [Ru(bpy)2 (BTIP)]2+ clearly binds to DNA by intercalation.
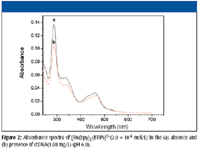
Figure 2
The corresponding relationships of the RLS spectra and the absorption spectra show clearly. The RLS peaks of 315 and 374 nm correspond to the absorbance valley, and the RLS valley at about 452 nm corresponds to the peak of absorbance. Furthermore, the RLS intensity increases in the presence of DNA while the absorbance decreases. This could be elucidated with the theory of resonance light scattering (5,6).
Optimization of Conditions
pH effect
Figure 3 shows the relationship between the RLS intensity and solution pH of the system. The effect of pH on the RLS is investigated from pH 2.0 to 10.0. Figure 4 exhibits that the enhancement of light-scattering changes a great deal and reaches a maximum with pH 6.0. [Ru(bpy)2 (BTIP)]2+ has low RLS signals in this range, whereas DNA has a high RLS intensity and the pH is lower than 3.5, which might be due to DNA aggregate forming large particles whose dimensions are comparable to the wavelength of UV–vis light and result in strong light scattering (41). But DNA has low RLS signals when the pH is higher than 3.5, so pH 6.0 is chosen for further research.
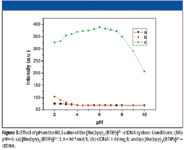
Figure 3
Effect of the [Ru(bpy)2 (BTIP)]2+ concentration
The effect of [Ru(bpy)2 (BTIP)]2+ concentration on IRLS of the [Ru(bpy)2 (BTIP)]2+ -ctDNA system is investigated and shown in Figure 4. The [Ru(bpy)2(BTIP)]2+ concentration has an obvious effect on IRLS of the [Ru(bpy)2 (BTIP)]2+ -ctDNA system. The IRLS increases with the increasing concentration of [Ru(bpy)2 (BTIP)]2+. Yet when the concentration of [Ru(bpy)2 (BTIP)]2+ is higher than 2.0 × 10⁻⁶ mol/L, the IRLS of the [Ru(bpy)2 (BTIP)]2+ -ctDNA system starts to decrease, which could be caused by the high absorbance of large concentrations of [Ru(bpy)2 (BTIP)]2+. So 2.0 × 10⁻⁶ mol/L, which caused the maximum IRLS, is selected for the following procedure.
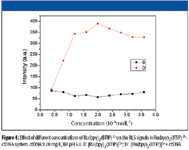
Figure 4
Influence of the addition order of the reagent and the stability
Three kinds of reagent addition orders are investigated, and all the measurements are done after the solutions have been mixed for 10 min. As shown in Table I, the addition order of the reagent affects the RLS intensity of the system. The best order is the first mixed order.

Table I: The effect of adding orders
The effect of the reaction time is evaluated by determining the RLS intensity every 2 min with 1 h and shown in Figure 5. From Figure 5, we know that the binding reaction of [Ru(bpy)2 (BTIP)]2+ and DNA is completed after 10 min and can be stable over 1 h when they are mixed together at room temperature. So all measurements are made after they are mixed together at an ambient temperature of 25 °C for 10 min.
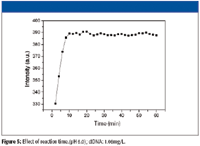
Figure 5
Effect of the ionic strength
NaCl was used to control the ionic strength of the solution. As shown in Figure 6, the RLS signals of the system remain constant at low ionic strength, while the reaction between [Ru(bpy)2 (BTIP)]2+ and DNA is restrained with the increasing of NaCl. The anion of phosphate on the backbone is increasingly shielded by the cationic ion with increasing ionic strength of the ionic strength controller (Na+), which is unfavorable for the assembly of [Ru(bpy)2 (BTIP)]2+ on the molecular surface of nucleic acids. So when the ionic strength is larger than 0.02 mol/L, the RLS signals decrease with the increasing ionic strength. This result indicates that the interaction mode with [Ru(bpy)2 (BTIP)]2+ and DNA also includes electrostatic interaction.
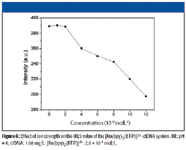
Figure 6
Influence of coexisting substances
Table II summarizes the effect of substances including metal ions, amino acids, galactose, and adenine. Most of the metal ions in biological systems, such as K+, Na+, and Ca+, can be tolerated at high concentrations. This result shows that this method is very useful.

Table II: Interference of foreign substances
Influence of denatured DNA
When double-strand nucleic acids were converted into single-strand nucleic acids with the opening up of its double helix by incubation at 100 °C for 30 min and immediate cooling in ice-water for 10 min, the profile of the RLS spectra of the system displayed obvious change using single-strand nucleic acid compared with that using double-strand nucleic acid (Figure 7). This fact suggests that the [Ru(bpy)2 (BTIP)]2+ can also bind single-strand nucleic acids and form bigger aggregations than double-strand nucleic acids. Because single-strand nucleic acids have more phosphate framework exposed in water than double-strand nucleic acids, this result also indicates that [Ru(bpy)2 (BTIP)]2+ can bind to DNA by static electric interaction mode.
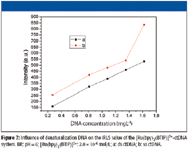
Figure 7
Analytical Application
Calibration
Under the optimum conditions, the dependence of IRLS upon the concentration of ct-DNA is determined. The analytical parameters of this method are listed in Table III. Table III also shows that there is a good linear relationship between IRLS and ct-DNA in a wide range of 0.00–1890 ng/L. The correlation between IRLS and the concentration of ct-DNA is IRLS = 278.75C +80.59 (mg/L), with a correlation coefficient (r) of 0.9988. The detection limit of ct-DNA is 9.46 ng/mL. The relative standard deviation for the determination of ct-DNA at 1.08 mg/L is 1.5 % (n = 10).

Table III: Analytic parameters
Determination of DNA in Synthetic Samples
With the calibration curves, the three synthetic samples constructed on the basis of the interference of foreign coexisting substances are simultaneously determined under the same conditions (n = 5, parallel determination of five times). Their determination results are listed in Table IV. Table IV reveals that the values found in synthetic samples are identical to the expected ones; the recoveries are satisfactory within 95.0–104.2%.

Table IV: Determination of ctDNA in synthetic sample
Conclusions
Through spectral studies on the interaction of Ru(bpy)2 (BTIP)2+ with DNA, we know that the primary binding mode is intercalation. In addition, electrostatic interaction and long-range assembly are the same important binding modes. The enhanced RLS intensity is proportional to the concentration of ctDNA in the range of 0–1890 ng/mL, and then the sensitivity, selectivity, and linear range for the determination of nucleic acid by RLS is reported. All of this will help to establish a foundation for the further investigation of the nucleic acids with polypyridyl ruthenium(II) complexes at the molecular level, design new high resultful and low toxic medication, filter new drugs, treat cancer, and alter anticancer medicine.
Chao Weng, Xiaoming Chen, and Changqun Cai are with the College of Chemistry, and Key Lab of Environment Friendly Chemistry and Application, Ministry of Education, Xiangtan University, Xiangan, 411105, P.R. China.
References
(1) C.X. Zhang, S.J. Lippard, Curr. Opin. Chem. Biol. 7, 481–489 (2003).
(2) B.K. Keppler, New J. Chem. 14, 389–403 (1990).
(3) G. Sava, A. Pergamo, G. Mestroni, in: M.J. Clarke, P.J. Sadler (Eds.), Topics in Biological Inorganic Chemistry, Metalopharmaceuticals: DNA Interactions, vol. 1 (Springer, Berlin, 1999).
(4) E. Reisner, V.B. Arion, B.K. Keppler, Armando J.L. Pombeiro. Inorganica. Chimica. Acta 361, 1569–1583 (2008).
(5) R.F. Pasternack, P.J. Collings, Science 269, 935 (1995).
(6) R.F. Pasternak, C. Bustamante, P.J. Collings, A. Giannetto, J. Am. Chem. Soc. 115, 5393–5399 (1993).
(7) Q.E. Cao, Z.T. Ding, R.B. Fang, and X. Zhao, Analyst 126, 1444 (2001).
(8) Q. Wei, D. Wu, Y. Li, B. Du, and J.H. Wang, Anal. Sci. 22, 275 (2006).
(9) X. Wu, S. Sun, C.Y. Guo, J.H. Yang, C.X. Sun, C.R. Zhou, and T. Wu, Luminescence 21, 56 (2006).
(10) H. Zhong, J.J. Xu, and H.Y. Chen, Talanta 67, 749 (2005).
(11) Z.G. Chen, T.Y. Zhang, F.L. Ren, and W.F. Ding, Mikrochim. Acta 153, 65 (2006).
(12) C.Z. Huang, K.A. Li, and S.Y. Tong, Anal. Chem. 68, 2259–2263 (1996).
(13) G. Sergio, A. Alessandro, B. Emanuele, L. Rosaria, and P. Roberto, Inorg. Chim. Acta 286, 121 (1999).
(14) Z.G. Chen, W.F. Ding, Y.Z. Liang, F.L. Ren, Y.L. Han, and J.B. Liu, Mikrochim. Acta 150, 35 (2005).
(15) Z.G. Chen, W.F. Ding, F.L. Ren, Y.L. Han, and J.B. Liu, Anal. Lett. 38, 2301 (2005).
(16) C.Q. Zhu, S.J. Zhuo, Y.X. Li, L. Wang, D.H. Zhao, J.L. Chen, and Y.Q. Wu, Spectrochim. Acta. A 60, 959 (2004).
(17) C.Z. Huang, F. Li, X.L. Hu, and N.B. Li, Anal. Chim. Acta 395, 187 (1999).
(18) Q. Wei, H. Zhang, B. Du, Y. Li, and X.X. Zhang, Mikrochim. Acta 151, 59 (2005).
(19) Y. Li, C.Q. Ma, K.A. Li, and S.Y. Tong, Anal. Chim. Acta 379, 39 (1999).
(20) Y.F. Li, C.Z. Huang, and M. Li, Anal. Chim. Acta 452, 285 (2002).
(21) X. Wu, Y.B. Wang, M.Q. Wang, S. Sun, J.H. Yang, and Y.X. Luan, Spectrochim. Acta A 61, 361 (2005).
(22) C.Z. Huang, K.A. Li, and S.Y. Tong, Anal. Chem. 69, 514 (1997).
(23) X. Wu, S.N. Sun, J.H. Yang, M.Q. Wang, L.Y. Liu, and C.Y. Guo, Spectrochim. Acta A 62, 896 (2005).
(24) F. Chen, J.P. Huang, X.P. Ai, and Z.K. He, Analyst 128, 1462 (2003).
(25) Z.G. Chen, W.F. Ding, F.L. Ren, Y.L. Han, and J.B. Liu, Anal. Lett. 38, 2301 (2005).
(26) Z.P. Li, Y.K. Li, and Y.C. Wang, Luminescence 20, 282 (2005).
(27) G.W. Song, Z.X. Cai, and L. Li, Mikrochim. Acta 144, 23 (2004).
(28) R.T. Liu, J.H. Yang, X. Wu, and C.X Sun, Anal. Chim. Acta 441, 303 (2001).
(29) S.P. Liu, X.L. Hu, H.Q. Luo, and L. Fan, Sci. China, Ser. B 45, 173 (2002).
(30) X.M. Chen, C.Q. Cai, H.A. Luo, and G.H. Zhang, Spectrochim. Acta A 61, 2215 (2005).
(31) Z.G. Chen, W.F. Ding, F.L. Ren, J.B. Liu, and Y.Z. Liang, Anal. Chim. Acta 550, 204 (2005).
(32) Y.L. Zhou, W.B. Chang, and Y.Z Li, Chin, J. Anal. Chem. 32, 169 (2004).
(33) A.E. Friedman, J.C. Chambron, J.P. Sauvage, N.J. Turro, and J.K. Barton, J. Am. Chem. Soc. 112, 4960 (1990).
(34) R.M. Hartshorn and J.K. Barton, J. Am. Chem. Soc. 114, 5919 (1992).
(35) A.E. Friedman, C.V. Kumar, N.J. Turro, and J.K. Barton, Nucl. Acid. Res. 19, 2595 (1991).
(36) L.S. Ling, Z.K. He, G.W. Song, H.Y. Han, H.S. Zhang, and Y.E. Zeng, Mikrochim. Acta 134, 57 (2000).
(37) L.S. Ling, Z.K. He, G.W. Song, Y.E. Zeng, C.Wang, C.L Bai, X.D. Che, and P. Shen, Anal. Chim. Acta 436, 207 (2001).
(38) L.S. Ling, G.W. Song, Z.K. He, D. Yuan, and Y.E. Zeng, Anal. Chim. Acta 403, 209 (2000).
(39) F. Chen, X.P. Ai, Z.K. He, M.J. Li, and X.D. Chen, Spectrosc. Lett. 38, 99 (2005).
(40) L.F. Tan, F. Wang, and H. Chao, Helv. Chim. Acta 90, 205 (2007).
(41) Z.P. Li, K.A. Li, and S.Y. Tong, Talanta 51, 63 (2000).

Best of the Week: Multidimensional Mass Spectrometry, Exoplanet Discovery, LIBS Plasma Behavior
March 28th 2025Top articles published this week include a long-form video interview from the American Academy of Forensic Sciences (AAFS) Conference, as well as several news articles highlighting studies where spectroscopy is being used to advance space exploration.
Exoplanet Discovery Using Spectroscopy
March 26th 2025Recent advancements in exoplanet detection, including high-resolution spectroscopy, adaptive optics, and artificial intelligence (AI)-driven data analysis, are significantly improving our ability to identify and study distant planets. These developments mark a turning point in the search for habitable worlds beyond our solar system.