Techniques for Raman Analysis of Lithium-Ion Batteries
Special Issues
The needs of the lithium-ion battery customers can be segmented into in situ and ex situ modes of analysis. In situ analysis allows researchers to follow changes in a battery cell during its charge and discharge cycles.
The needs of the lithium-ion battery customers can be segmented into in situ and ex situ modes of analysis. In situ analysis allows researchers to follow changes in a battery cell during its charge and discharge cycles. Recent improvements in Raman sensitivity enable these changes to be imaged on a dynamic time scale. The same techniques offer significant improvements for ex situ analysis of battery components by providing more thorough sampling than traditional single-point measurements. Examples are presented showing the advantages of both modes of analysis for lithium-ion electrodes.
The use of Raman spectroscopy for the analysis of battery materials has been around for years. During the 1960s, researchers used Raman to elucidate many of the fundamental spectral features of the minerals and inorganic materials widely used in battery research today (1,2). Raman is a good fit for these materials because many of the characteristic vibrational and rotational modes occur in the low-wavenumber region of the spectrum typically accessible only by far-infrared (IR) measurements. In that day and age, both Raman and far-IR measurements were time consuming and difficult experiments.
Advances in instrumentation have greatly increased the ease-of-use of Raman making it a much more approachable technique. New areas of application ensued such as the exploding interest in rechargeable lithium (Li)-ion batteries. Many researchers are involved and have published careful studies of materials specifically related to Li-ion batteries as well as next generation batteries. A review article by Baddour-Hadjean (3) published in 2010 is an excellent resource for those wishing to get up to speed in this field. The focus of this article is on the in situ and ex situ applications of Raman spectroscopy as it pertains to battery research.
Analysis Techniques: In Situ Versus Ex Situ
The term in situ is used to describe experiments where the battery components are studied in an assembled cell under operating conditions. Think of in situ as a window on the case of a battery that lets you see the chemistry of what goes on when you charge and discharge a battery. There are very few commercially available cell designs compatible with spectroscopic measurements. Researchers have resorted to building their own cells to meet the needs of their experimental apparatus. Examples of such designs have been published along with experimental results (4–10).
While in situ cells provide valuable information, their use is generally targeted at research and development of batteries. After a formulation is designed, a candidate battery is scaled up through pilot production to actual product samples. At this stage of development, researchers are most interested in characterizing failure modes and gaining a better understanding of performance differences. For example, they want to learn what makes one production run work better than another, and why one battery fails yet its siblings from the same batch work fine.
To answer these questions, researchers carefully disassemble a battery cell so the individual components can be examined. This type of analysis is termed ex situ because the battery components are removed from the operating battery cell. The goal is to prepare the samples for analysis in as close to a native state as possible.
Battery disassembly for ex situ analysis is carried out in an inert environment such as an argon-filled glove box to protect the battery components from moisture and oxidation. For example, the anode, separator, and cathode sandwich must be carefully separated and rinsed to remove excess electrolytes.
After the samples are prepared, they must be kept in an inert environment to protect against changes during analysis. When space is available, instruments are installed inside the glove box so the samples can be analyzed. In most cases, the sample must be removed from the glove box and transferred to an external instrument for analysis. This is where an ex situ transfer cell becomes a key component of the workflow. It preserves the inert environment around the sample so it can be studied.
From Single Point Measurements to Raman Imaging
The majority of published research on Li-ion battery in situ Raman work is based on single-point measurements acquired over time during charge–discharge cycles. An example is the excellent work done by Kostecki's group at Lawrence Berkeley National Lab (11).
Single-point measurements can be misleading because there is no way of knowing if the sampled point is representative of the entire electrode. It is important to make multiple measurements to be sure. Because the Raman signals are weak, it takes many minutes to generate enough signal-to-noise ratio at each measurement point. A complete, multipoint experiment can be quite time consuming to complete.
Today, Raman imaging is a viable alternative that lets you quickly make thousands of measurements over an area of the electrode rather than just single-point measurements. Each pixel in a Raman image is a complete Raman spectrum. This technique provides confidence in understanding if changes are heterogeneous or hot spots.
The following experimental results demonstrate the flexibility of using Raman spectroscopy for both in situ and ex situ analysis of Li-ion batteries and their components.
In Situ Example: Lithiation of Graphite
Graphite is widely used as an anode material for rechargeable Li-ion batteries.
During the Li-ion battery charging cycle, positively charged Li+ ions move from the cathode through the electrolyte, across a separator into the anode to balance the flow of electrons in the external circuit (Figure 1). This process of Li+ ions entering the graphitic structure of the anode is called intercalation. Intercalation causes changes in the anode structure-primarily a swelling of the graphite structure.
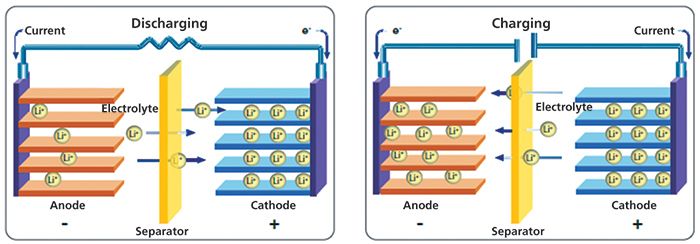
Figure 1: Movement of Li+ ions balance electrons during the charge and discharge cycles of a Li-ion battery.
Experimental
The experimental setup for this example consists of a DXRxi Raman imaging microscope (Thermo Scientific) and an ECC-Opto-Std optical electrochemical cell (EL-CELL). This cell enables the investigation of batteries in a so-called sandwich configuration where the working electrode material is placed under a sapphire (Al2O3) window. Electrode material (graphite powder in this example) is spread onto a copper grid serving as the current collector. This working electrode is sandwiched from below, with a glass fiber separator soaked with the electrolyte solution and lithium metal as the counter electrode.
The Raman beam from the microscope objective impinges onto the backside of the working electrode material through the sapphire window (Figure 2). The advantage of investigating the backside of the electrode is that the pathway for the Raman beam is minimized, allowing the use of high magnification objectives and optimizing the spectra quality. The drawback is the gradient of lithiation concentration along the depth of the electrode. Accordingly, the electrode must be charged very slowly to minimize this unwanted gradient.
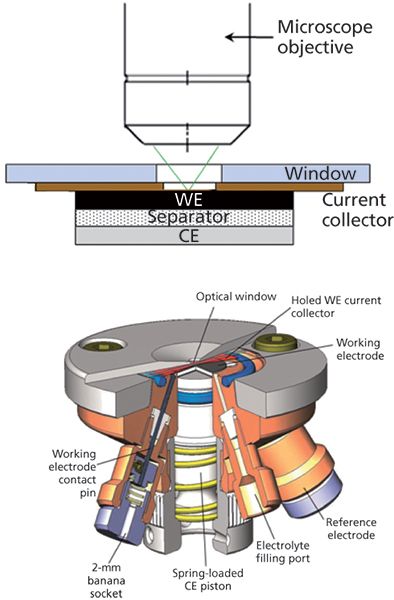
Figure 2: Experimental setup for the in situ example showing the electrochemical cell mounted on the stage of a Raman imaging microscope.
The graphite electrode was cycled at a constant rate of approximately 0.06C. The C-rate is measure of how rapidly a battery is charged-discharged. This rate of 0.06C corresponds to 33 h for a full charge-discharge cycle between 1.5 and 0.005 V against Li/Li+. Raman imaging was carried out during the initial 480 min of the charging (lithiation) process only.
Raman spectra were collected over a 30 µm × 30 µm area at 1 µm pixel spacing using 2 mW of 532-nm laser excitation, a 0.01-s exposure time for each pixel, and 50 scans per image. Higher laser powers or longer exposure times resulted in burning of the graphite and boiling of the electrolyte.
Results
A Raman image is a hyperspectral data set with each pixel in the image being a complete Raman spectrum. Using a variety of spectral processing techniques, this hyperspectral Raman data generates image contrast pertaining to specific chemical features. It is this capability that visualizes minute differences within a sampled area. By collecting a sequence of Raman images, we now have the ability to monitor changes in both space and time. As mentioned earlier, a variety of chemical images can be created from each data set showing changes within the sampled area. Alternatively, the Raman spectral data within each data set can be averaged to produce a single spectrum for each time slice. In this mode, the Raman imaging data set is used as a means of homogenizing any differences in the electrode area. This average spectrum represents a single-point measurement yet each point represents a 30-µm square compared with the typical 1-µm sample area from a standard Raman microscope.
In Figure 3, the three-dimensional (3D) view (bottom left) shows changes in the Raman spectrum as a function of time over 8.3 h (1–500 min). During this time, the battery cell is in the charging (lithiation) process only. This portion of the electrochemical cycle is shown in the lower right of Figure 3.
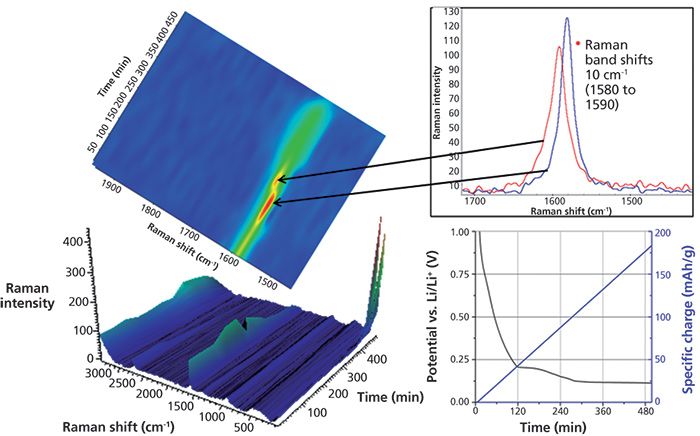
Figure 3: Different views rendered from the time lapse hyperspectral Raman data provide a wealth of experimental information.
The spectrum of graphite exhibits a prominent peak at 1580 cm-1 attributed to the E2g2 mode (G band). At potentials between 0.42 and 0.31 V (specific charge 33 and 45 mAh/g), the band gradually disappears along with the simultaneous emergence of a peak centered at 1590 cm-1. This peak shift is attributed to the Li+ ions intercalated into the graphite structure. This is more easily seen in the center, two dimensional (2D) Raman image. The inset shows Raman spectra before and after the change.
Toward the end of the charge cycle at 8.3 h (496 min), where the voltage is less than 0.15 V (specific charge greater than 146 mAh/g), a strong Raman band centered at 154 cm-1 begins to appear. This Raman band has not been previously reported so its assignment is not conclusive. Strong Raman bands in this region have been attributed to TiO2, Sb, and metal chlorides.
The type of views shown in Figure 3 are "spectrum-centric" because they show changes in the Raman spectra captured at different times during a time-based analysis. Figure 4 shows another way of exploring the same Raman imaging data set from an alternative "image-centric" point-of-view. Here, we are not as interested in the Raman spectrum itself, but rather its use as a tool to enhance differences within the image (image contrast).
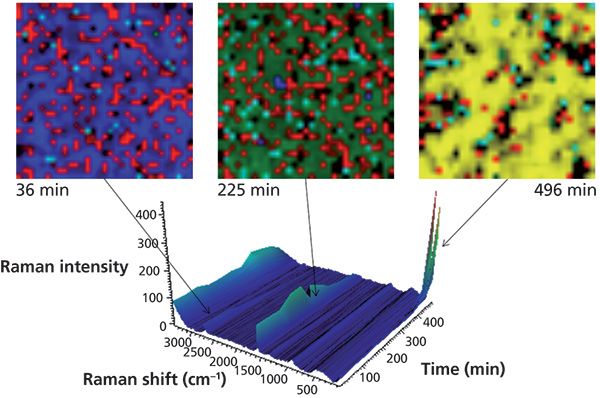
Figure 4: Raman images from different time slices in the graphite lithiation experiment.
In Figure 4, Raman images are presented in which the image contrast is generated by multivariate curve resolution (MCR) analysis. In this case, MCR finds the differences not only within each image but also across the entire time sequence. A different color is assigned to each resolved component. This is analogous to the use of dyes in biological fluorescence imaging, which tag different parts of a cell. Each image is from the same 30-µm-square portion of the anode. The blue MCR component is indicative of the 1580 cm-1 band; green is the 1590 cm-1 band; yellow is the 154 cm-1 band; and red represents carbon black, a conductivity enhancer.
It can be challenging to visualize the information content with such a massive wealth of data. Figure 4 shows just three frames to demonstrate this type of analysis. The changes are easier to grasp using a time lapse viewer of the complete time sequence (video clips are available at youtu.be/geq6mbYVARE and youtu.be/Ic0MFAB5U4M).
Ex Situ Example: Characterization of Li-Ion Anodes
After safety concerns, a leading area of interest in Li-ion battery research is understanding the cause of performance degradation over time. Research indicates the solid electrolyte interphase (SEI) layer formed on the surface of the electrode is key to performance. The SEI layer is formed by deposition of organic and inorganic compounds during the first several charge-discharge cycles (12). It stabilizes the electrode from further decomposition and promotes reversible capacity. Because of the complexity of the SEI layer, results from any and all analytical techniques contribute to an incremental understanding of its behavior.
As you might expect, it is a messy business to extract electrodes from a used battery so the SEI can be studied. It takes great care to prepare the sample and preserve its integrity for ex situ analysis. This is usually achieved by working in an argon-filled glove box to prevent sample degradation because of atmospheric exposure. A transfer cell with a window is used to seal the sample in the inert argon environment, and remove it from the glove box for analysis using a Raman microscope.
For this example, anode samples from a disassembled Li-ion battery were cut and mounted in a transfer cell (Thermo Scientific) so that a cross-section of the anode could be imaged. Raman spectra were collected over a 76 µm × 160 µm area at spatial resolution of 1.0 µm per pixel using a DXRxi Raman imaging system (Thermo Scientific). Laser power at the sample was 2.0 mW at 532 nm with a 0.2-s exposure time and four image scans. A 50× long working distance, 0.5 NA microscope objective (Olympus) was used to focus through the transfer cell window.
Figure 5 is a micrograph of the anode cross section. The copper current collector is in the center with anode material coated on both surfaces. The Raman image created from the spectral differences shown by the inset Raman spectra is superimposed. The Raman image clearly shows that the coating on one side of the copper current collector is dominated by carbon black (red) whereas the other side has a much greater density of the active graphite phase (blue).
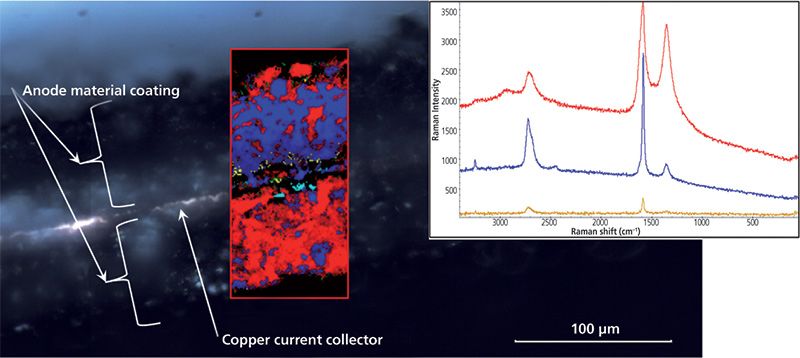
Figure 5: Cross-section view of a Li-ion battery anode. The Raman image indicates a difference in the anode coating on each side. Inset Raman spectra are color coded to the areas in the Raman image.
This example demonstrated the advantage of Raman imaging over traditional single-point measurements. The major differences in the two coatings could easily have been missed by single-point measurements depending on where the points were measured.
Conclusions
The high sensitivity of Raman imaging is a benefit for Li-ion battery analysis. In situ Raman imaging techniques show the spatial distribution of phase changes in electrodes over time. This is a capability that was not possible with single-point measurements using traditional Raman microscopy. Ex situ Raman imaging measurements give results with a higher degree of confidence compared to single points.
Dick Wieboldt is a senior scientist in the Research and Advanced Development group at Thermo Fisher Scientific in Madison, Wisconsin. Ines Ruff is an application specialist for Central Europe in the Molecular Spectroscopy division of Thermo Fisher Scientific GmbH in Dreieich, Germany. Matthias Hahn is with EL-CELL GmbH in Hamburg, Germany. Direct correspondence to: dick.wieboldt@thermofisher.com
References
(1) P. Tarte, J. Inorg. Nucl. Chem. 29(4), 915–923 (1967).
(2) W.B. White and B.A. De Angelis, Spectrochim. Acta, Part A 23(4), 985–995 (1967).
(3) R. Baddour-Hadjean and J.P. Pereira-Ramos, Chem. Rev. (Washington, DC, U. S.) 110(3), 1278–1319 (2010).
(4) T. Gross and C. Hess, J. Power Sources 256, 220–225 (2014).
(5) P. Novák, D. Goers, L. Hardwick, M. Holzapfel, W. Scheifele, J. Ufheil, and A. Wursig, J. Power Sources 146, 15–20 (2005).
(6) C.M. Burba and R. Frech, Appl. Spectrosc. 60(5), 490–493 (2006).
(7) E. Markevich, V. Baranchugov, G. Salitra, D. Aurbach, and M. Schmidt, J. Electrochem. Soc. 155(2), A132–A137 (2008).
(8) Y. Luo, W.B. Cai, X.K. Xing, and D.A. Scherson, Electrochem. Solid-State Lett. 7(1), E1–E5 (2004).
(9) T. Gross, L. Giebeler, and C. Hess, Rev. Sci. Instrum. 84(7), 073109-1–073109-6 (2013).
(10) K. Hongyou, T. Hattori, Y. Nagai, T. Tanaka, H. Nii, and K. Shoda, Power Sources 243, 72–77 (2013).
(11) J. Lei, F. McLarnon, and R. Kostecki, J. Phys. Chem. B 109(2), 952–957 (2005).
(12) A. Chagnes and J. Swiatowska in Lithium Ion Batteries - New Developments, I. Belharouak, Ed. (ISBN: 978-953-51-0077-5, InTech, 2012). Available at: http://www.intechopen.com/books/lithium-ion-batteries-new-developments/electrolyte-and-solid-electrolyte-interphase-layer-in-lithium-ion-batteries.

LIBS Illuminates the Hidden Health Risks of Indoor Welding and Soldering
April 23rd 2025A new dual-spectroscopy approach reveals real-time pollution threats in indoor workspaces. Chinese researchers have pioneered the use of laser-induced breakdown spectroscopy (LIBS) and aerosol mass spectrometry to uncover and monitor harmful heavy metal and dust emissions from soldering and welding in real-time. These complementary tools offer a fast, accurate means to evaluate air quality threats in industrial and indoor environments—where people spend most of their time.
NIR Spectroscopy Explored as Sustainable Approach to Detecting Bovine Mastitis
April 23rd 2025A new study published in Applied Food Research demonstrates that near-infrared spectroscopy (NIRS) can effectively detect subclinical bovine mastitis in milk, offering a fast, non-invasive method to guide targeted antibiotic treatment and support sustainable dairy practices.
Smarter Sensors, Cleaner Earth Using AI and IoT for Pollution Monitoring
April 22nd 2025A global research team has detailed how smart sensors, artificial intelligence (AI), machine learning, and Internet of Things (IoT) technologies are transforming the detection and management of environmental pollutants. Their comprehensive review highlights how spectroscopy and sensor networks are now key tools in real-time pollution tracking.