The Big Review III: Molecular Vibration Theory
It has occurred to me that, in the 10+ years I have been writing about molecular vibrations, I have never introduced my readers to its basic theory! I will rectify that now. Some of this is new material, and some will be review. Either way, it is important that all this material be covered in one place.
All physical objects, including guitar strings, buildings, and molecules, have vibrations they undergo at frequencies determined by their structures. These vibrations, which are inherent to all objects, are called their normal modes. My favorite example of a normal mode is a guitar string vibrating. If you walk up to a guitar and pluck a string, it will vibrate at its normal mode frequency, which is determined by the length of the string, how thick it is, and how tightly it is strung. You will hear the normal mode frequency as a pitch; let’s say it's an A. If you press your finger on the fretboard of the guitar to shorten the string and pluck the string a second time, the normal mode frequency will increase, and you will hear this as an increase in pitch. Let’s say now you hear a C. In fact, all music and all sounds are based on normal modes. If I were talking to you, my vocal chords would vibrate at their normal mode frequencies, exciting vibrations in a column of air that leaves my mouth, which travels through the air and then impinges on your eardrum, causing it to vibrate. Your brain interprets this as sound. Those of us who have had the privilege (?) of living near the San Andreas fault are all too familiar with the fact that buildings have normal modes and vibrate during earthquakes. So, normal modes are all around us, although we might not realize it.
Like all the physical objects listed above, molecules have normal modes. The number of atoms a molecule contains and its structure determine how many vibrations (normal modes) it will have. The formulae to calculate the number of normal modes in molecules are given in Table I.

For linear molecules like carbon dioxide, the formula for the number of normal modes it possesses is 3N–5, where N is the number of atoms in the molecule. Thus, for a 3-atom linear molecule like CO2, its number of normal modes is (3x3)–5 = 4. The four normal modes of CO2 are seen in Figure 1. Note the dashed line through the molecule in the upper left-hand corner of Figure 1. This is an axis of symmetry, which shows that CO2 is a symmetric molecule; in this case, the sides of the molecule to the left and right sides of this line are identical. For the symmetric stretch of CO2, also seen to the upper right in Figure 1, two oxygen atoms move away and towards the carbon atom at the same time and in phase with each other, meaning the left and right hand sides are identical during the vibration, preserving the symmetry of the molecule, hence the term symmetric stretch.
FIGURE 1: The normal modes of the carbon dioxide molecule. The dotted line shows an axis of symmetry around which the molecule is symmetric.
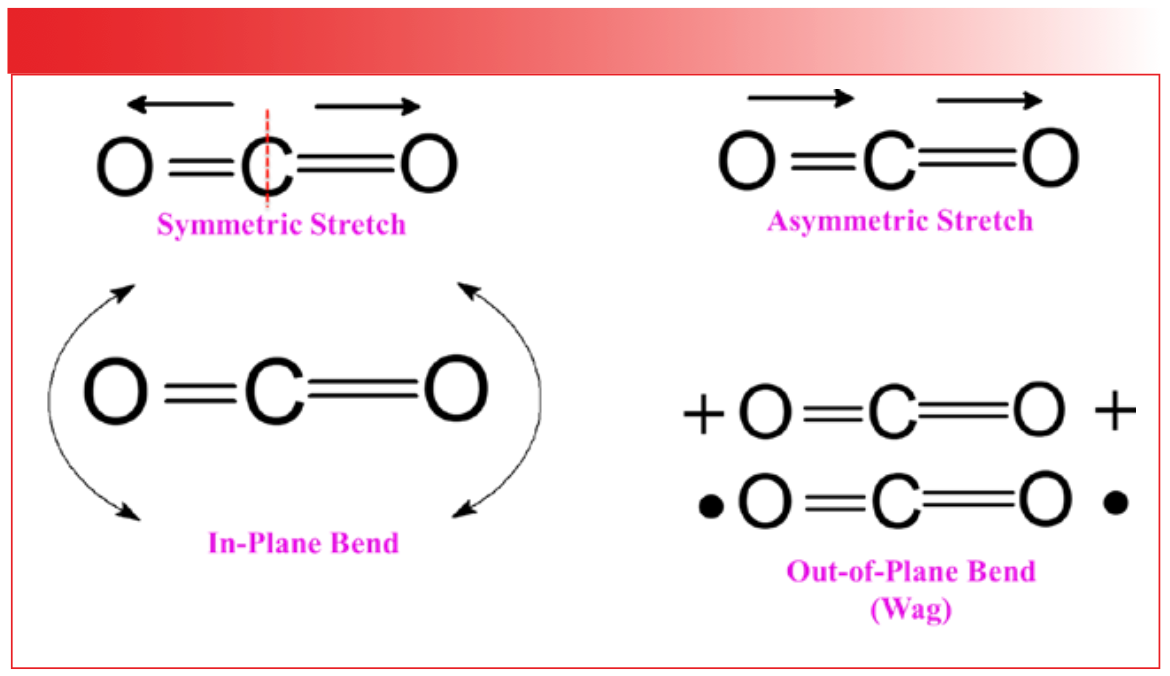
The asymmetric stretch of CO2 is shown in the upper right-hand corner of Figure 1. Note that during this stretch, the two oxygen atoms move in different ways: one towards the carbon atom and the other away from the carbon atom. As a result, during the vibration the left- and right-hand sides of the molecule are different lengths, which means the molecule is not symmetric during this vibration. Thus, we say its asymmetric stretch breaks the symmetry of the molecule.
In addition to stretching vibrations, molecules can exhibit bending vibrations. The two bending vibrations of CO2 are illustrated at the bottom of Figure 1. The lower left-hand corner shows the in-plane bend of the molecule, so called because the C=O bonds bend up and down, staying in the plane of the page, as indicated by the arrows. The lower right-hand side of the figure shows the out-of-plane bend of CO2. In this case, the C=O bonds bend above and below the plane of the page. The + signs in the diagram are arrow tails, indicating that the oxygen atoms are moving into the page away from you, and the black dots are arrow heads, indicating the oxygen atoms are moving towards you from out of the page. You probably never thought of it this way, but the wagging of a dog’s tail is an out-of-plane bend. Going forward, I will use the term wag to refer to out-of-plane bends. The terms symmetric stretch, asymmetric stretch, in-plane bend, and out-of-plane bend, or wag, are widely used in infrared spectroscopy because so many different functional groups have vibrations whose motions are similar to those seen in Figure 1.
For non-linear molecules, the formula for the number of normal modes is 3N–6. For a 3-atom non-linear molecule like H2O, the number of normal modes is (3x3)–6 = 3. The three normal modes of water are seen in Figure 2.
FIGURE 2: The three normal modes of the water molecule. The dashed line indicates an axis of symmetry around which the molecule is symmetric.
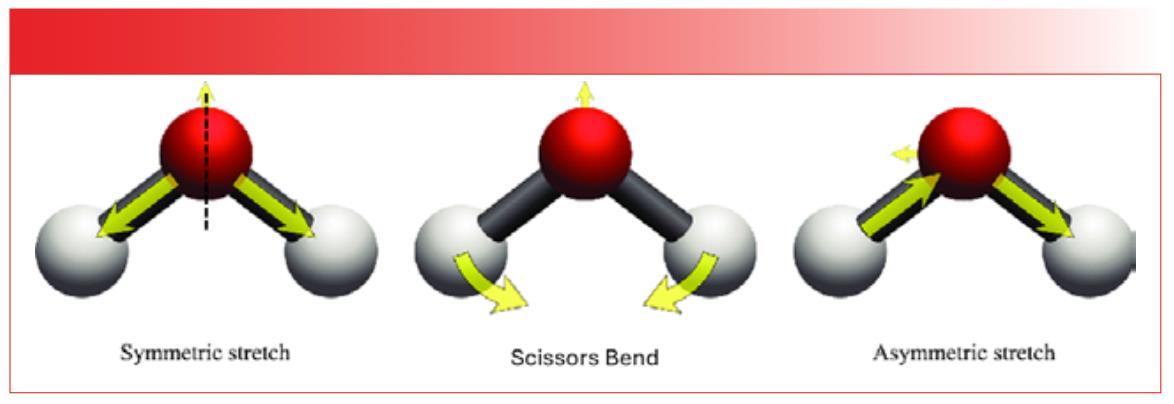
Like CO2, water contains an axis of symmetry, as denoted by the dashed line in the figure. Again, the left- and right-hand sides of the molecule are the same. Like CO2, water has a symmetric stretch, as shown in the left side of Figure 2, where the two hydrogen atoms move away from the oxygen atom in the same direction and in phase with each other, preserving the symmetry of the molecule. The asymmetric stretch of water is illustrated to the right side of Figure 2. Note that the hydrogen atoms move in different directions, one away and one towards the oxygen, breaking the symmetry of the molecule. The single bending vibration of water is technically an in-plane bend, but since this motion looks like the opening and closing of a pair of scissors, it is called a scissors bend, or scissors vibration. I will use this term going forward.
Connecting Vibrations to Peaks in Spectra
An important concept in infrared spectral interpretation is the ability to connect the idea of molecular vibrations to the actual peaks we see in the spectrum of a molecule. Recall from an earlier column (1) that peak positions in infrared spectra are given by equation 1:
W = (1/2πc)(K/MR)1/2 [1]
where W = peak wavenumber position in cm-1; c = the speed of light; K = force constant; and MR = reduced mass.
The molecular structural elements in equation 1 that determine peak position are the force constant of the bond vibrating and the masses of the atoms involved in the vibration. I have said many times before that equation 1 is the most important equation in infrared spectroscopy because it means that if two molecules have different structures, they will have different spectra. This is because if two molecules have different structures, their K and MR values will be different; hence, their spectra will be different. Since infrared spectra are unique to a molecule, we can use infrared spectra like a fingerprint, using spectra to identify the presence of specific molecules in unknown samples. Equation 1 was derived assuming a simple diatomic molecule was used, but the fact that peak position depends upon K and MR carries over to more complex molecules. Equation 1 is the connection between the vibrations of a molecule and its resultant spectrum.
Functional Group Spectroscopy
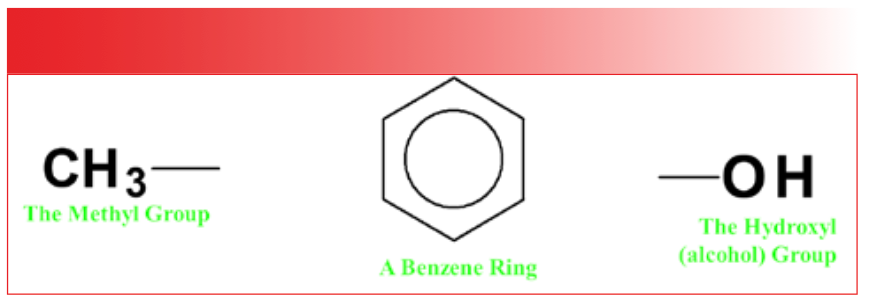
The vibrations of CO2 and water, as seen in Figures 1 and 2, involve the whole molecule. For bigger molecules, such as benzonitrile, whose structure is seen in Figure 3, the vibrations tend to be isolated to portions of the molecule called a functional group, a term that us spectroscopists have stolen from organic chemistry. In organic chemistry, a functional group is a chemically distinct group of atoms in a molecule that exhibits unique chemistry and participates in reactions (2). Figure 4 shows examples of three functional groups: the methyl group, CH3, a benzene ring, C6H6, and the hydroxyl group, -OH.
FIGURE 3: The chemical structure of benzonitrile (C7H5N).
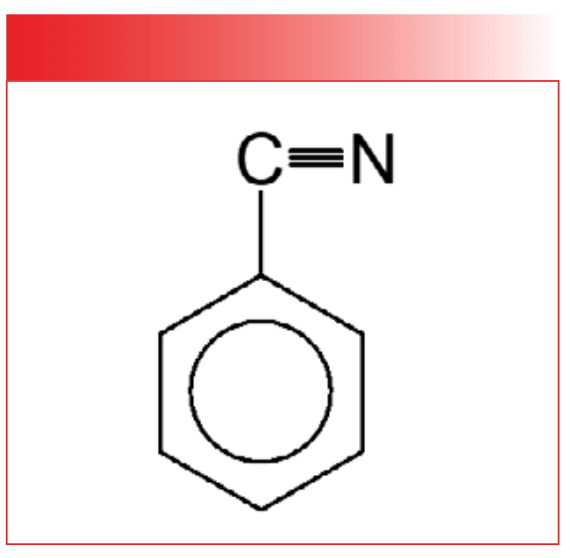
FIGURE 4: Examples of three functional groups; the methyl group (CH3), a benzene ring (C6H6), and the hydroxyl group (-OH).
For us infrared spectroscopists, a functional group is a vibrationally distinct group of atoms in a molecule that tend to vibrate together. Among the functional groups in our benzonitrile molecule are the benzene ring and the nitrile, CN. Hence, this molecule has vibrations such as the C-H stretch of the benzene ring and the CN stretch of the nitrile group. When we assign a peak in an infrared spectrum, we determine what vibration from what functional group gave rise to that peak. Thus, it is correct to say that infrared spectroscopy is used to detect functional groups, and that it is a form of functional group spectroscopy. Other types of functional group spectroscopy include Raman spectroscopy and mass spectroscopy.
How Many Infrared Peaks Will a Molecule Have?
Note from the formulae in Table I that as the number of atoms in a molecule goes up, the number of vibrations goes up. We also said that vibrations give rise to infrared peaks; this means that as the number of vibrations in a molecule goes up, more peaks will appear in its spectrum. In general, big molecules will have spectra with more peaks and more complex spectra than small molecules, which will have fewer peaks and simpler spectra.
However, for a given molecule, the number of vibrations does not always equal the number of peaks seen in its spectrum. Recall (3) that there are vibrations, including the symmetric stretch of CO2, that do not give peaks in infrared spectra because they meet the criterion stated in equation 2:
dµ/dx = 0 [2]
where dµ = change in dipole moment during a vibration; and dx = change in bond length during a vibration.
Molecular vibrations for which dµ/dx = 0 are said to be infrared inactive.
Another factor that impacts the number of peaks in a molecule’s infrared spectrum is the symmetry of the molecule. If different parts of a molecule are chemically the same, they will have the same spectrum, and the molecule’s spectrum will have fewer peaks. Whereas, if a molecule is asymmetric with many chemically distinct parts, its spectrum will exhibit more peaks. An extreme example of symmetry affecting a molecule’s spectrum is polyethylene, whose structure is seen in Figure 5.
FIGURE 5: The chemical structure of polyethylene.
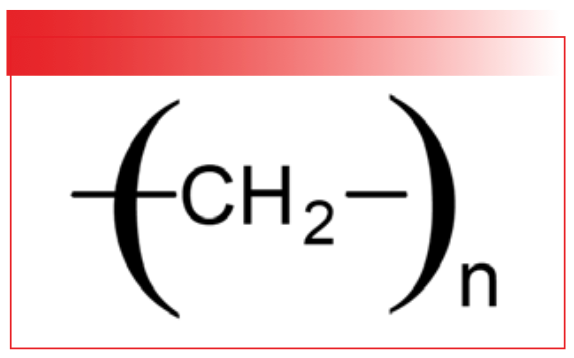
There exist polyethylene molecules with molecular weights in the millions (4). These molecules contain hundreds of thousands of atoms. Polyethylene is non-linear, and when we apply the 3N–6 formula seen in Table 1, it means polyethylene has hundreds of thousands of vibrations. Does this mean that polyethylene has hundreds of thousands of peaks? The spectrum of polyethylene in Figure 6 provides the answer.
FIGURE 6: The infrared spectrum of polyethylene. Note that there are only four peaks, and peak positions are shown in wavenumbers (cm-1).
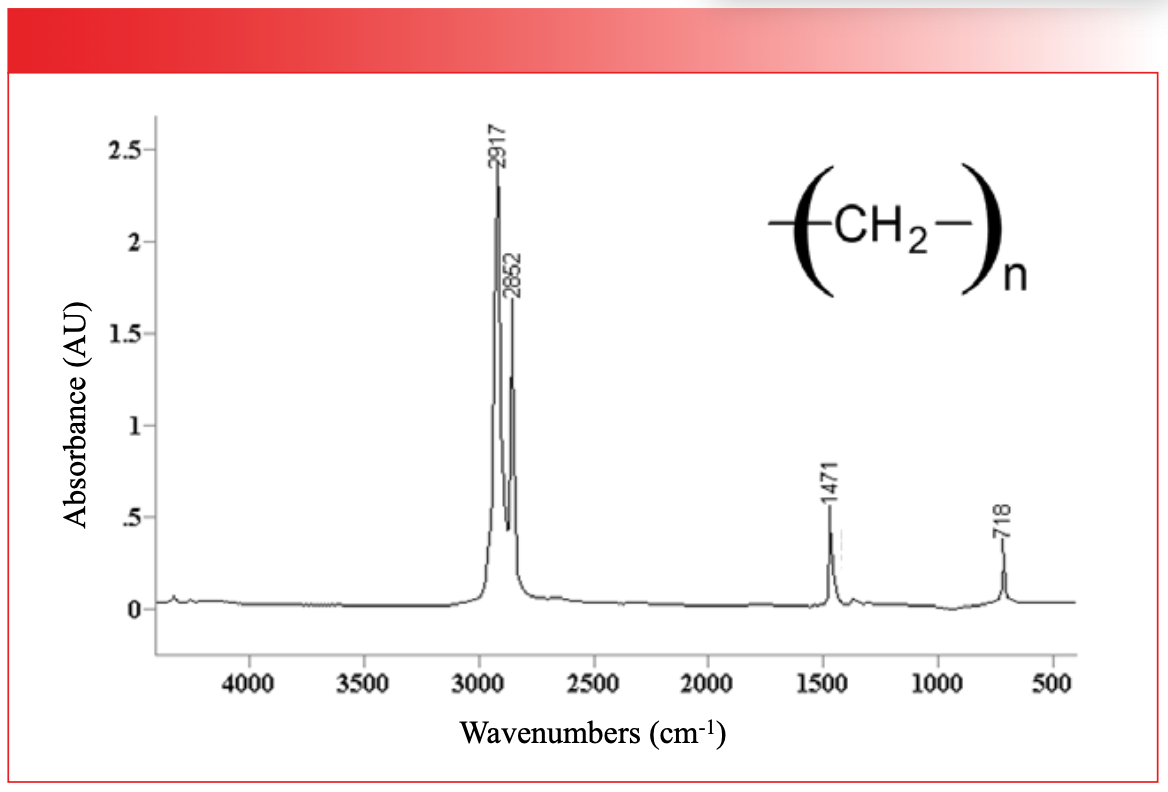
There are only four peaks! How is this possible? Symmetry, that’s how. Remember, polymers are made up of chemically identical repeat units, which means they are highly symmetric, and the spectrum of each repeat unit is identical. The spectrum of a polymer, then, is that of the repeat unit. If the repeat unit contains many atoms, its spectrum will be complex; if the repeat unit contains few atoms, its spectrum will be simple. This is why the spectrum of polyethylene only contains four peaks; the repeat unit is simple, and because of the high symmetry of the molecule, the spectrum of each repeat unit is the same.
Conclusions
The fundamental vibrations of molecules are called their normal modes. The number of normal modes a molecule has is determined by its structure and the number of atoms in the molecule. Molecular vibrations are generally isolated to chemically and vibrationally distinct portions of molecules called functional groups. The main purpose of infrared spectroscopy is to detect functional groups in samples. The symmetry of a molecule plays a role in determining how many peaks it will exhibit in its spectrum, as was illustrated by polyethylene.
References
(1) Smith, B. C. Infrared Spectral Interpretation, In The Beginning I: The Meaning of Peak Positions, Heights, and Widths. Spectroscopy 2024, 39 (4), 18–24. DOI: 10.56530/spectroscopy.fi6379n1
(2) Functional group. Wikipedia 2024.https://en.wikipedia.org/wiki/Functional_group (accessed 2024-11-06)
(3) Smith, B. C. Inorganics III: Even More Spectra, and the Grand Finale Spectroscopy 2024, 39 (3), 11–15. DOI: 10.56530/spectroscopy.hp2485x8
(4) Ultra-high-molecular-weight polyethylene. Wikipedia 2024.https://en.wikipedia.org/wiki/Ultra-high-molecular-weight_polyethylene (accessed 2024-11-06)
Brian C. Smith, PhD, is the founder and CEO of Big Sur Scientific, a maker of portable mid-infrared cannabis analyzers. He has over 30 years experience as an industrial infrared spectroscopist, has published numerous peer-reviewed papers, and has written three books on spectroscopy. As a trainer, he has helped thousands of people around the world improve their infrared analyses. In addition to writing for Spectroscopy, Dr. Smith writes a regular column for its sister publication Cannabis Science and Technology and sits on its editorial board. He earned his PhD in physical chemistry from Dartmouth College. He can be reached at: SpectroscopyEdit@MMHGroup.com ●


AI Shakes Up Spectroscopy as New Tools Reveal the Secret Life of Molecules
April 14th 2025A leading-edge review led by researchers at Oak Ridge National Laboratory and MIT explores how artificial intelligence is revolutionizing the study of molecular vibrations and phonon dynamics. From infrared and Raman spectroscopy to neutron and X-ray scattering, AI is transforming how scientists interpret vibrational spectra and predict material behaviors.
Real-Time Battery Health Tracking Using Fiber-Optic Sensors
April 9th 2025A new study by researchers from Palo Alto Research Center (PARC, a Xerox Company) and LG Chem Power presents a novel method for real-time battery monitoring using embedded fiber-optic sensors. This approach enhances state-of-charge (SOC) and state-of-health (SOH) estimations, potentially improving the efficiency and lifespan of lithium-ion batteries in electric vehicles (xEVs).
New Study Provides Insights into Chiral Smectic Phases
March 31st 2025Researchers from the Institute of Nuclear Physics Polish Academy of Sciences have unveiled new insights into the molecular arrangement of the 7HH6 compound’s smectic phases using X-ray diffraction (XRD) and infrared (IR) spectroscopy.