The Grand Review I: Why Do Different Functional Groups Have Different Peak Positions?
Articles in this column have addressed five main areas: theory, functional groups containing the C-H bond, those containing the C-O bond, those with the C=O bond, and those with organic nitrogen compounds. Here, we review the concepts.
Over the last five years and 30+ columns, we have covered a lot of territory. It is now appropriate to step back and take a look at where we have been. “IR Spectral Interpretation Workshop” columns can be divided into five broad categories: theory, functional groups containing the C-H bond, those containing the C-O bond, those with the C=O bond, and those with organic nitrogen compounds. In the first installment of “The Grand Review,” we discuss why different functional groups have peaks with different positions.
What a long, strange, and hopefully interesting and useful trip it has been for you, my column readers. Since January 2015, Spectroscopy has published over 30 installments of my “Infrared Spectral Interpretation Workshop”columns. Over these years, we have discussed the theory behind IR spectral interpretation, a process to follow which maximizes the probability of obtaining the right answer, interpretation aids such as spectral subtraction and library searching, and how to interpret the spectra of functional groups containing C-H, C-O, C=O, and N-H bonds.
There is still plenty of new material to be covered, but given the time that has elapsed and the amount of ground we have covered, it is time to step back and take a look at where we’ve been. The next several columns will contain a “Grand Review” of the major concepts you need to understand to interpret infrared spectra properly.
When I first started writing this column, one of the challenges was trying to get the theory discussion out of the way as quickly as possible so we could get to interpreting spectra. This meant that interpretation theory and practice were mixed in the same article. While this made sense at the time, it meant discussion of crucial theoretical concepts was spread over multiple installments, which, from a pedagogic point of view, is not optimal. This “Grand Review” gives me the chance to rectify this situation by introducing infrared spectral interpretation theory as a whole. In this first installment, we will review the theory behind peak positions.
Why Different Functional Groups Have Different Peak Positions
There is a lot of information to be gleaned from infrared spectra, but perhaps the most important is the molecular structural information given to us by peak positions (1). A large part of what I have taught you are the diagnostic group wavenumber peak positions for common functional groups, where we assign peaks in a spectrum to a specific vibration of a given functional group. How do we know what functional groups absorb where? Part of this is from measuring infrared spectra of molecules with known chemical structures and looking for correlations (1–5); the other is from theory (6–9).
The Harmonic Oscillator
Because the absorption of infrared light excites molecular vibrations, we need to understand these vibrations to make sense of infrared spectra. The constituent vibrations of a molecule (or any physical object, for that matter) are referred to as its normal modes (1). An illustration of the symmetric and asymmetric stretching normal modes of carbon dioxide is shown in Figure 1.
Figure 1: Left: the symmetric stretch normal mode of the carbon dioxide molecule. Right: the asymmetric stretch normal mode of the CO2 molecule. The arrows note the displacement of the oxygen atoms during the vibrations.

At equilibrium, the CO2 molecule is symmetric because both C=O bonds are the same length. During the symmetric stretching vibration, the two oxygen atoms move in opposite directions, as illustrated in Figure 1, and the two C=O bonds have the same length at all points during the vibration, preserving the symmetry of the molecule. On the other hand, during the asymmetric stretch, the two oxygen atoms move in different directions; at many points during the vibration the bond lengths differ from each other, and the symmetry of the molecule is broken.
To understand the relationship between molecular vibrations and peak positions, consider the generic diatomic molecule shown in Figure 2, which is a ball and spring model of a molecule, where individual atoms are represented by balls and chemical bonds by springs. The atoms in Figure 2 have masses M1 and M2, respectively. A real-world example of such a diatomic molecule would be hydrogen chloride (HCl), where atom 1 would be chlorine, and atom 2 hydrogen.
Figure 2: The ball and spring model for a generic diatomic molecule containing atoms of masses M1 and M2.
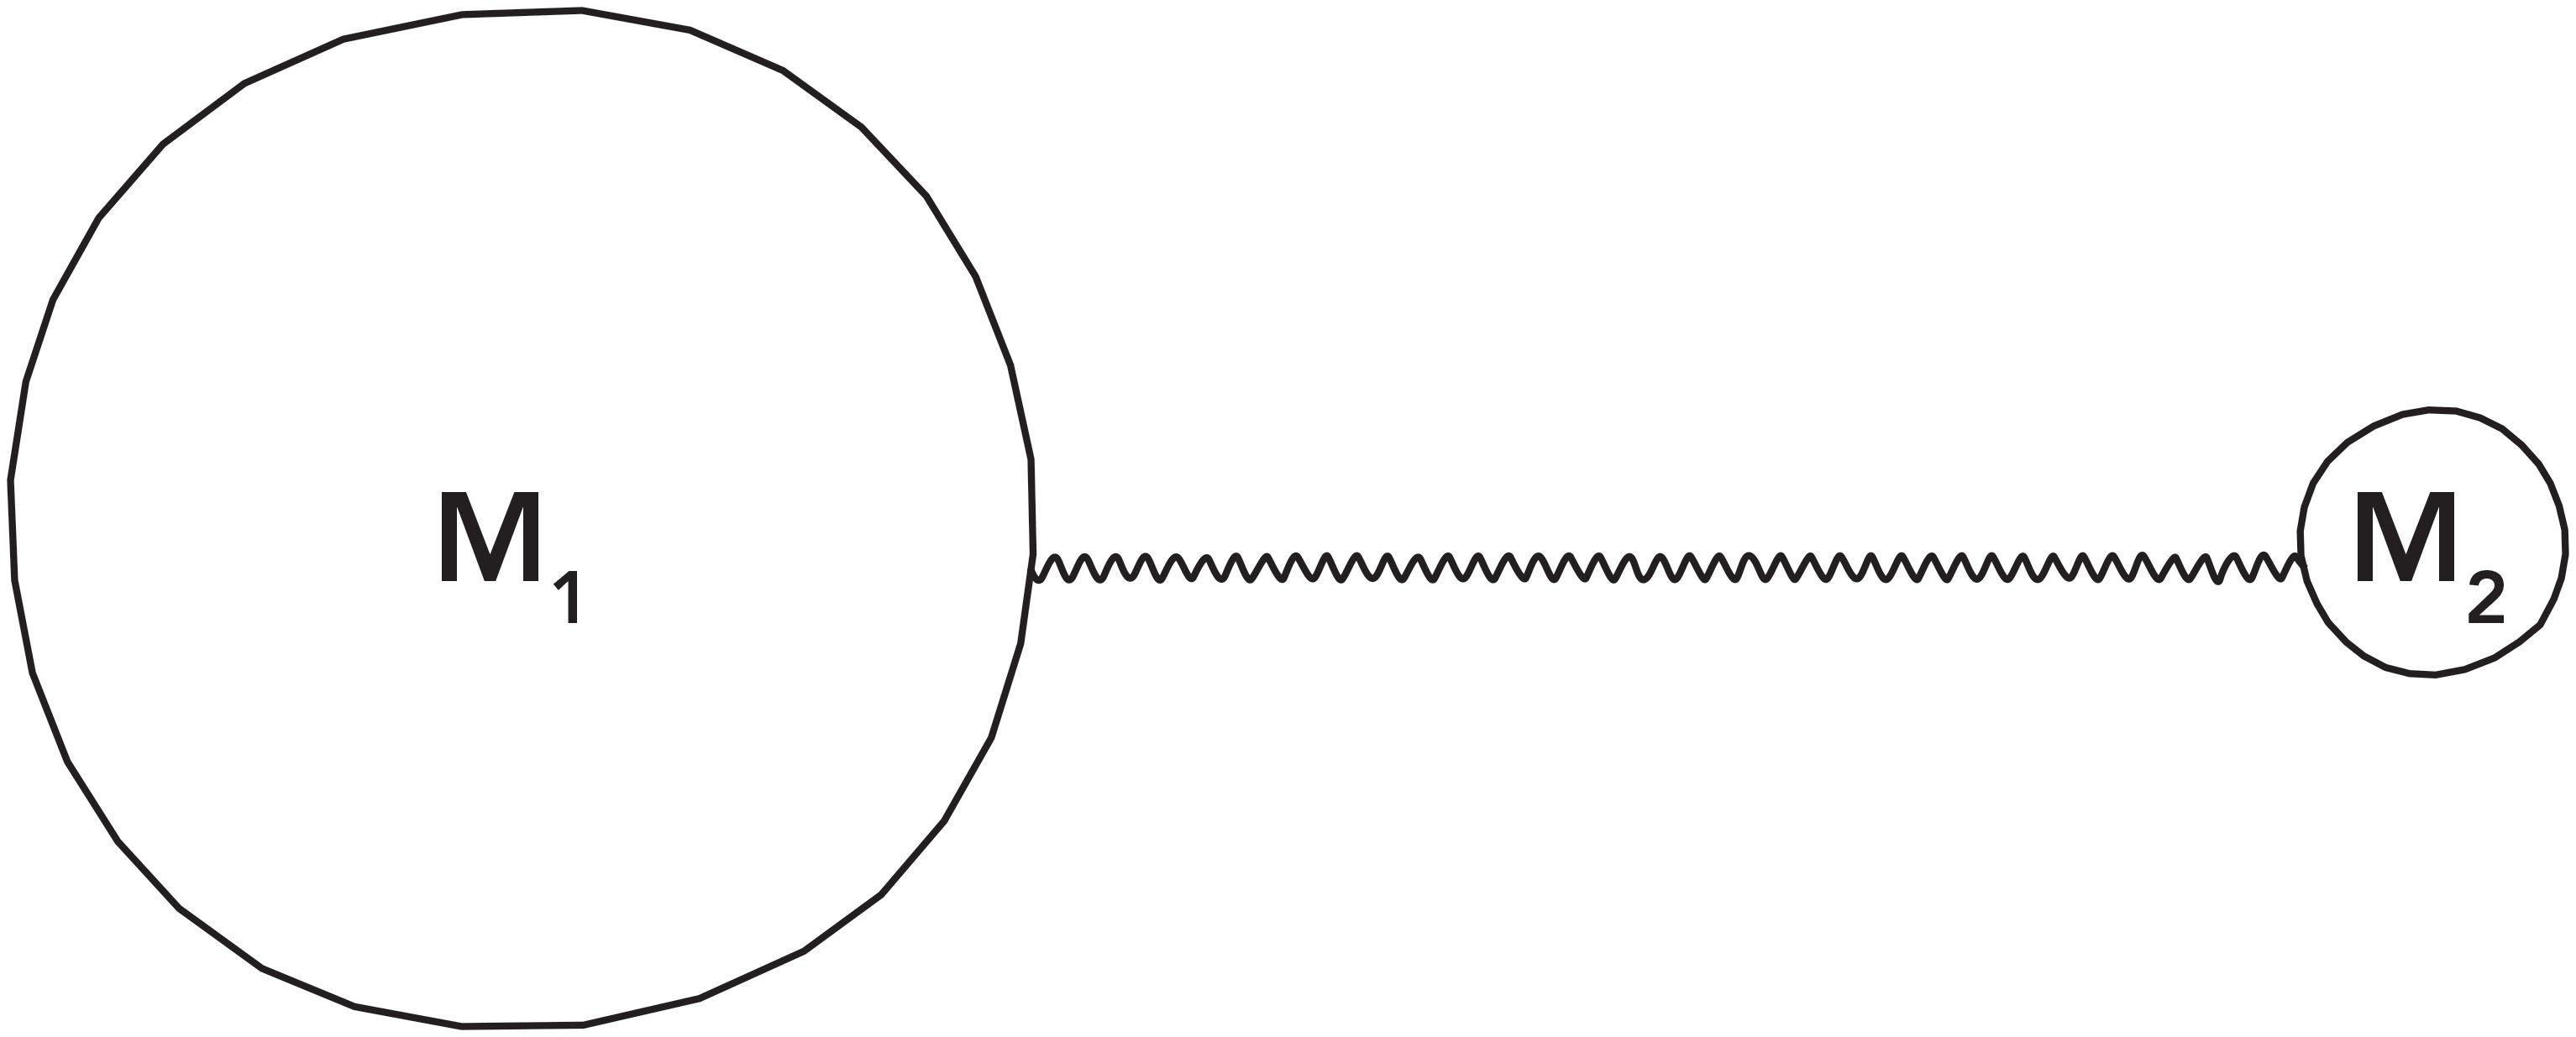
Diatomic molecules have only one vibration (1), the stretching of their single chemical bond, and therefore have only one infrared peak. Our goal is to derive an equation that will tell us the wavenumber of the vibrational peak in the spectrum of a diatomic molecule, like the one shown in Figure 2. To do this, we will assume when this molecule vibrates, it does so in what is called a harmonic fashion. This means that when the chemical bond stretches, the two atoms move in phase with each other, with the same amplitude, and pass through their equilibrium positions at the same time (1). Real-world harmonic systems include a swinging pendulum and a rotating wheel; many systems whose motion repeats can be characterized mathematically as a harmonic oscillator. Most molecular vibrations are much more complicated than the harmonic motion assumed here, but assuming harmonic motion makes the math easier.
To begin, we apply physics to the situation. We define the reduced mass of our diatomic molecule as such:
MR = (M1M2)/(M1+M2) [1]
Where
MR = Reduced mass
M1 = Mass of atom 1
M2 = Mass of atom 2
By using a single quantity to represent the mass of a two-mass system, the mathematics of the derivation is made easier.
The second piece of physics we have to consider is Hooke’s Law (1), which describes the behavior of springs, and vibrating chemical bonds, as such (equation 2):
F= -kx [2]
Where
F = Restoring force of a spring
k = Force constant of the spring
x = Distance stretched
The force constant, k, is a measure of a spring’s stiffness, and when applied to chemical bonds, it is a measure of bond strength.
Anyone who has ever stretched a rubber band has an intuitive grasp of Hooke’s Law. F is the amount of force needed to stretch and maintain the rubber band at a given length, and is equal to the amount of force the rubber band is putting on the person trying to stretch it (the restoring force). Experience shows it takes more force to stretch a rubber band a long distance than a short distance, which is why the variable x appears in Hooke’s Law. Experience also shows it takes more force to stretch a stiff rubber band than a weak one, which is why the force constant k appears in Hooke’s Law.
If one takes the reduced mass, Hooke’s Law, applies one of Newton’s Laws, and solves the resulting differential equation, this result is obtained (1):
W = (1/2πc)(k/MR)1/2 [3]
Where
W = Peak wavenumber position in cm-1
c = The speed of light
k = Force constant
MR = Reduced mass
Equation 3 is the equation we have been looking for—it predicts the position in wavenumbers of the single vibrational peak for a generic diatomic molecule. Note there are several constants in the equation, including the value of π and the speed of light, and that the two variables are the force constant, MR, and reduced mass, k.
Equation 3 is perhaps the most important equation in infrared spectroscopy. It relates components of a molecule’s structure, bond strength, and atomic mass, to what is called a spectroscopically observable quantity, the peak position in wavenumber. If two molecules have different molecular structures, they will have different spectra (1–5), and this is a direct result of equation 3; molecules with different structures have different bond strengths or atomic masses, and therefore different peak positions. As we have seen throughout the last five years, peak positions in an infrared spectrum can be used to determine the structures of unknown molecules. Equation 3 gives us the correlation between chemical structure and peak position; equation 3 is why infrared spectra are useful.
Since k is in the numerator in equation 3, as the force constant goes up the peak position increases. This means strong chemical bonds have higher peak positions than weak chemical bonds. The force constant is determined by a chemical bond’s electronic structure, which is how the electrons and nuclei are arranged with respect to each other in a bond (1). When comparing peak position shifts between molecules caused by changes in k, the phenomenon is called an electronic effect; a change in electronic structure caused the bond strength to change, causing k to change, and resulting in a change in peak position.
An interesting example of an electronic effect is the position for carbon-carbon single bond, (C-C), double bond (C=C), and triple bond (C≡C) stretching peaks. C-C stretching peaks typically fall from 1400 to 1000 cm-1 (going forward, assume all peak positions are in cm-1 units even if not denoted), as shown in the spectrum of hexane in Figure 3.
Figure 3: The infrared spectrum of hexane. The C-C stretching region is from 1400 to 1000. is assigned as a C=C stretching peak.
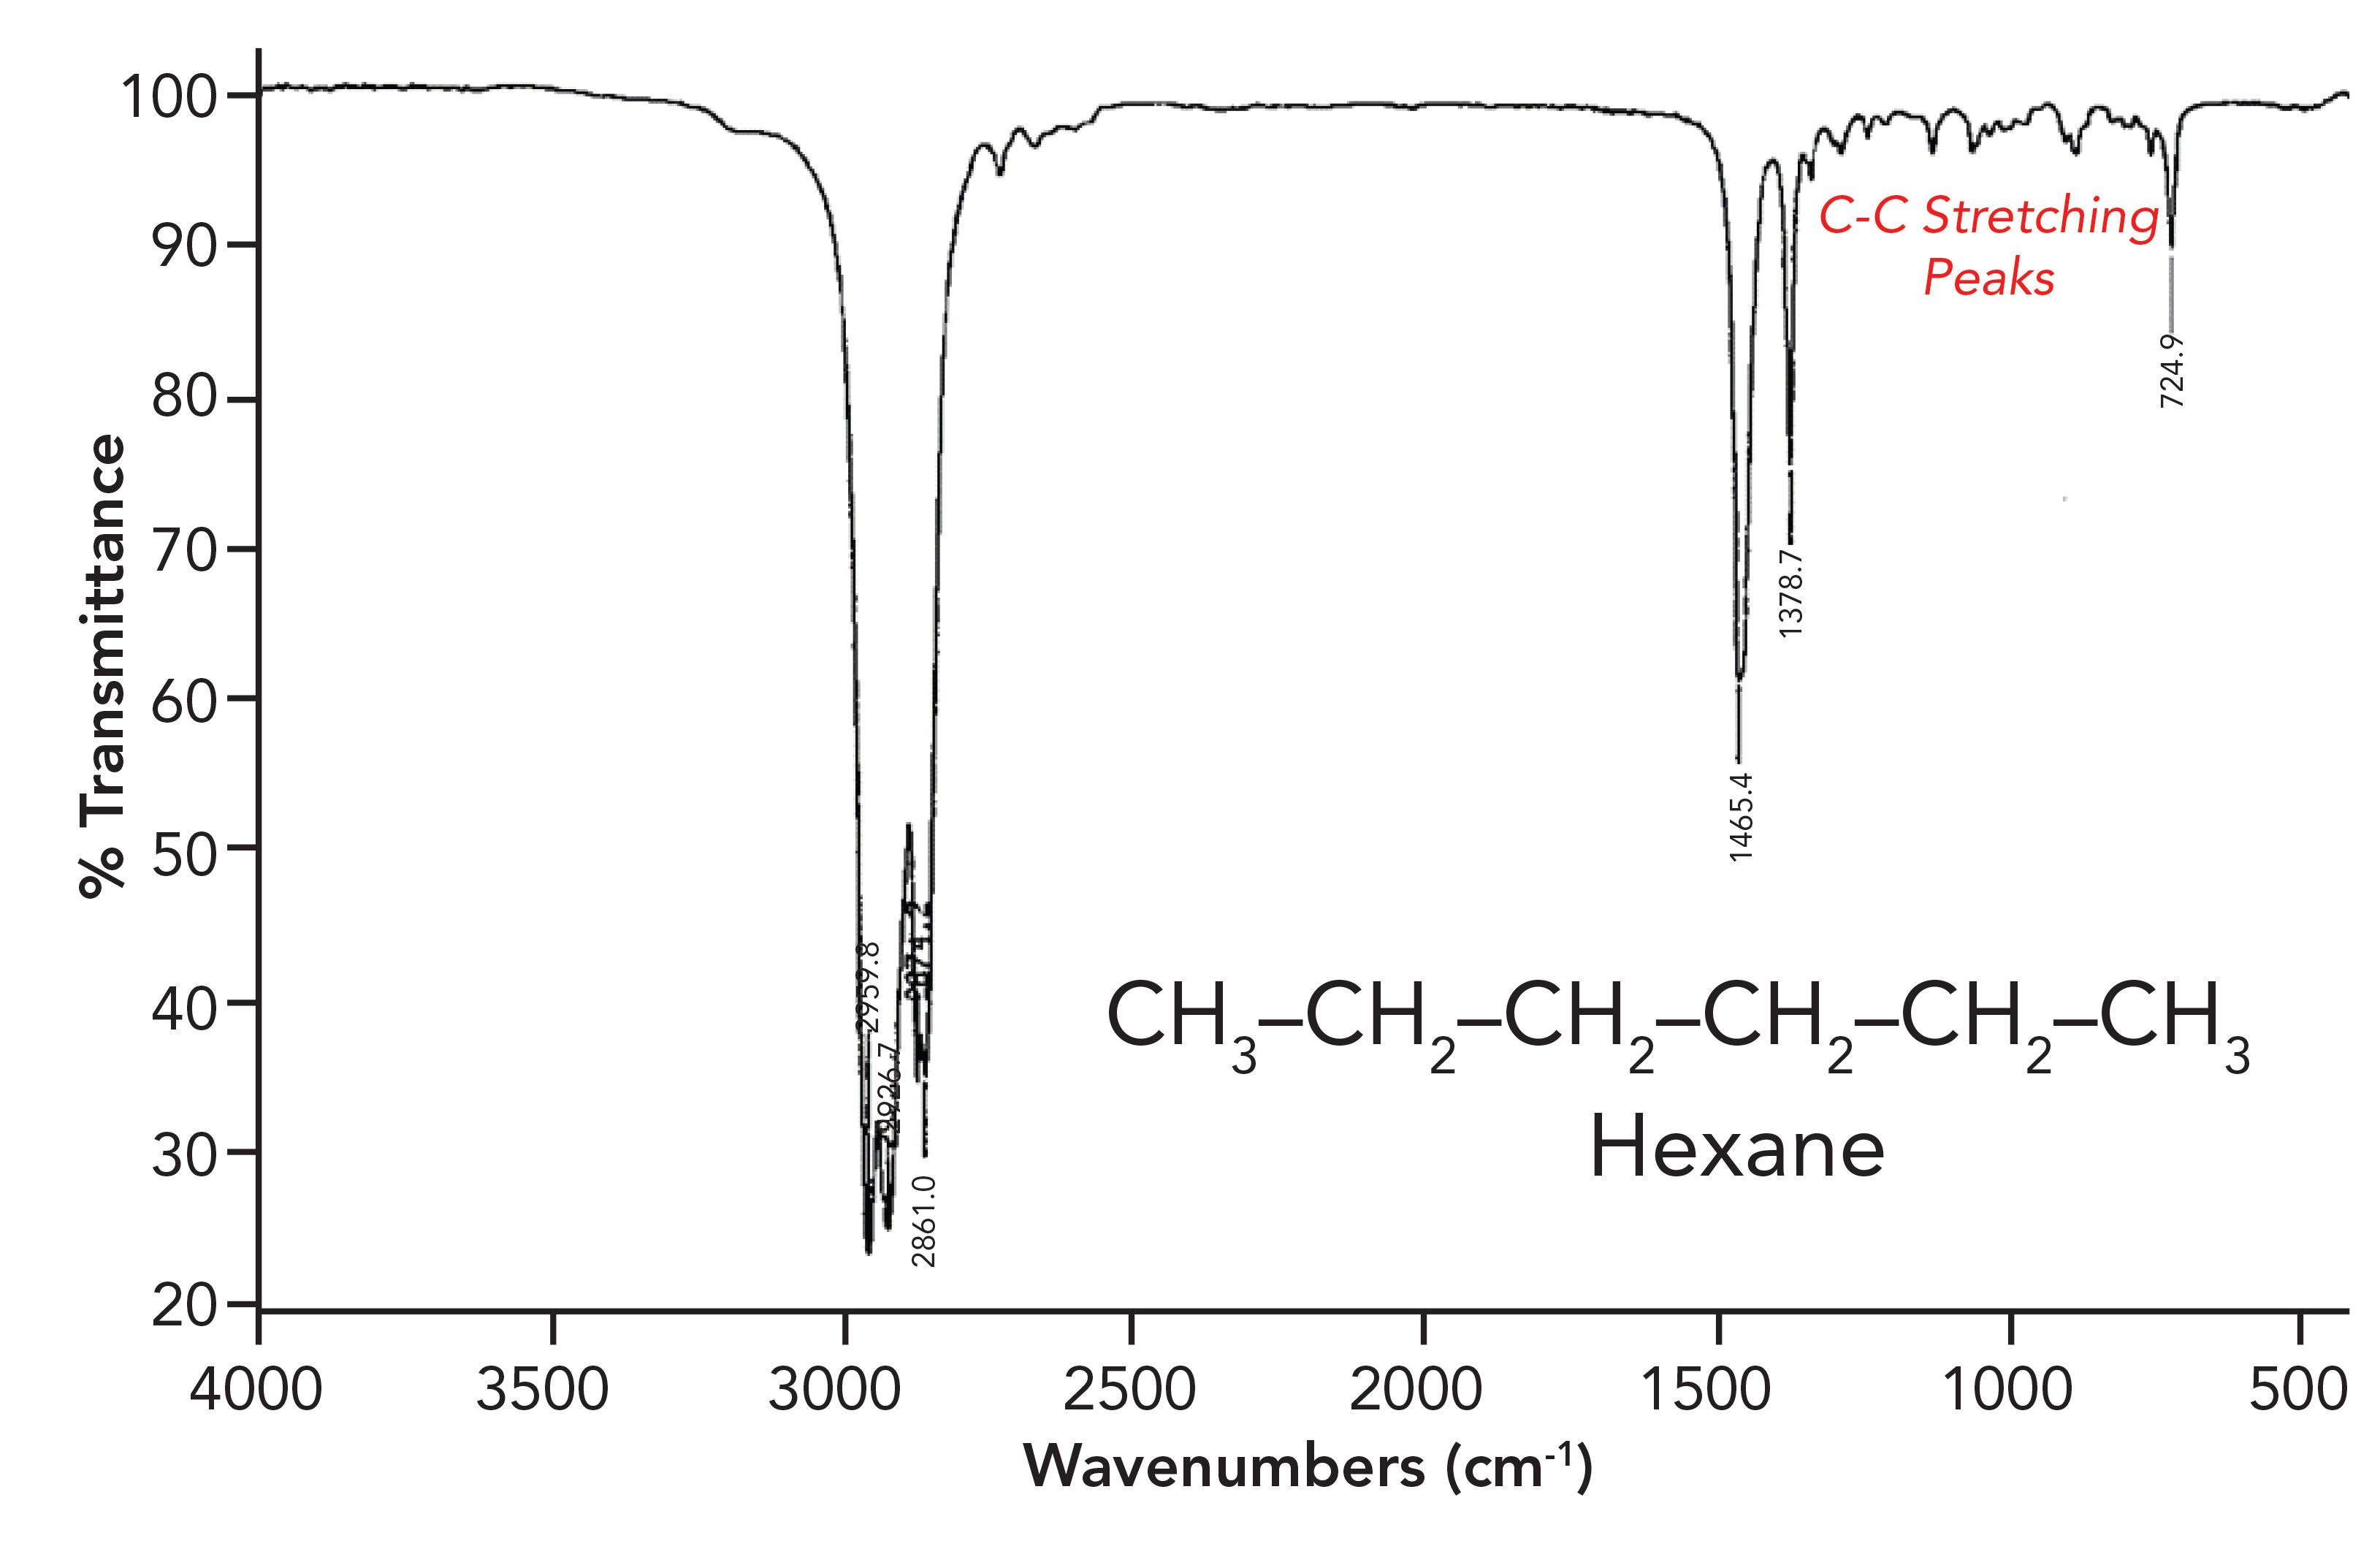
In Figure 3 the C-C stretching peaks are a series of small peaks just to the right of the CH3 umbrella mode peak at 1379.
Carbon-carbon double bond, or C=C stretching peaks, fall at a higher wavenumber than C-C stretches, from 1680 to 1630, because a double bond is stronger, has a higher force constant, and therefore a higher peak position than a C-C bond. An illustration of a C=C stretching peak is shown in the spectrum of 1-Octene in Figure 4.
Figure 4: The infrared spectrum of 1-octene. The peak labeled B at 1641 is assigned as a C=C stretching peak.
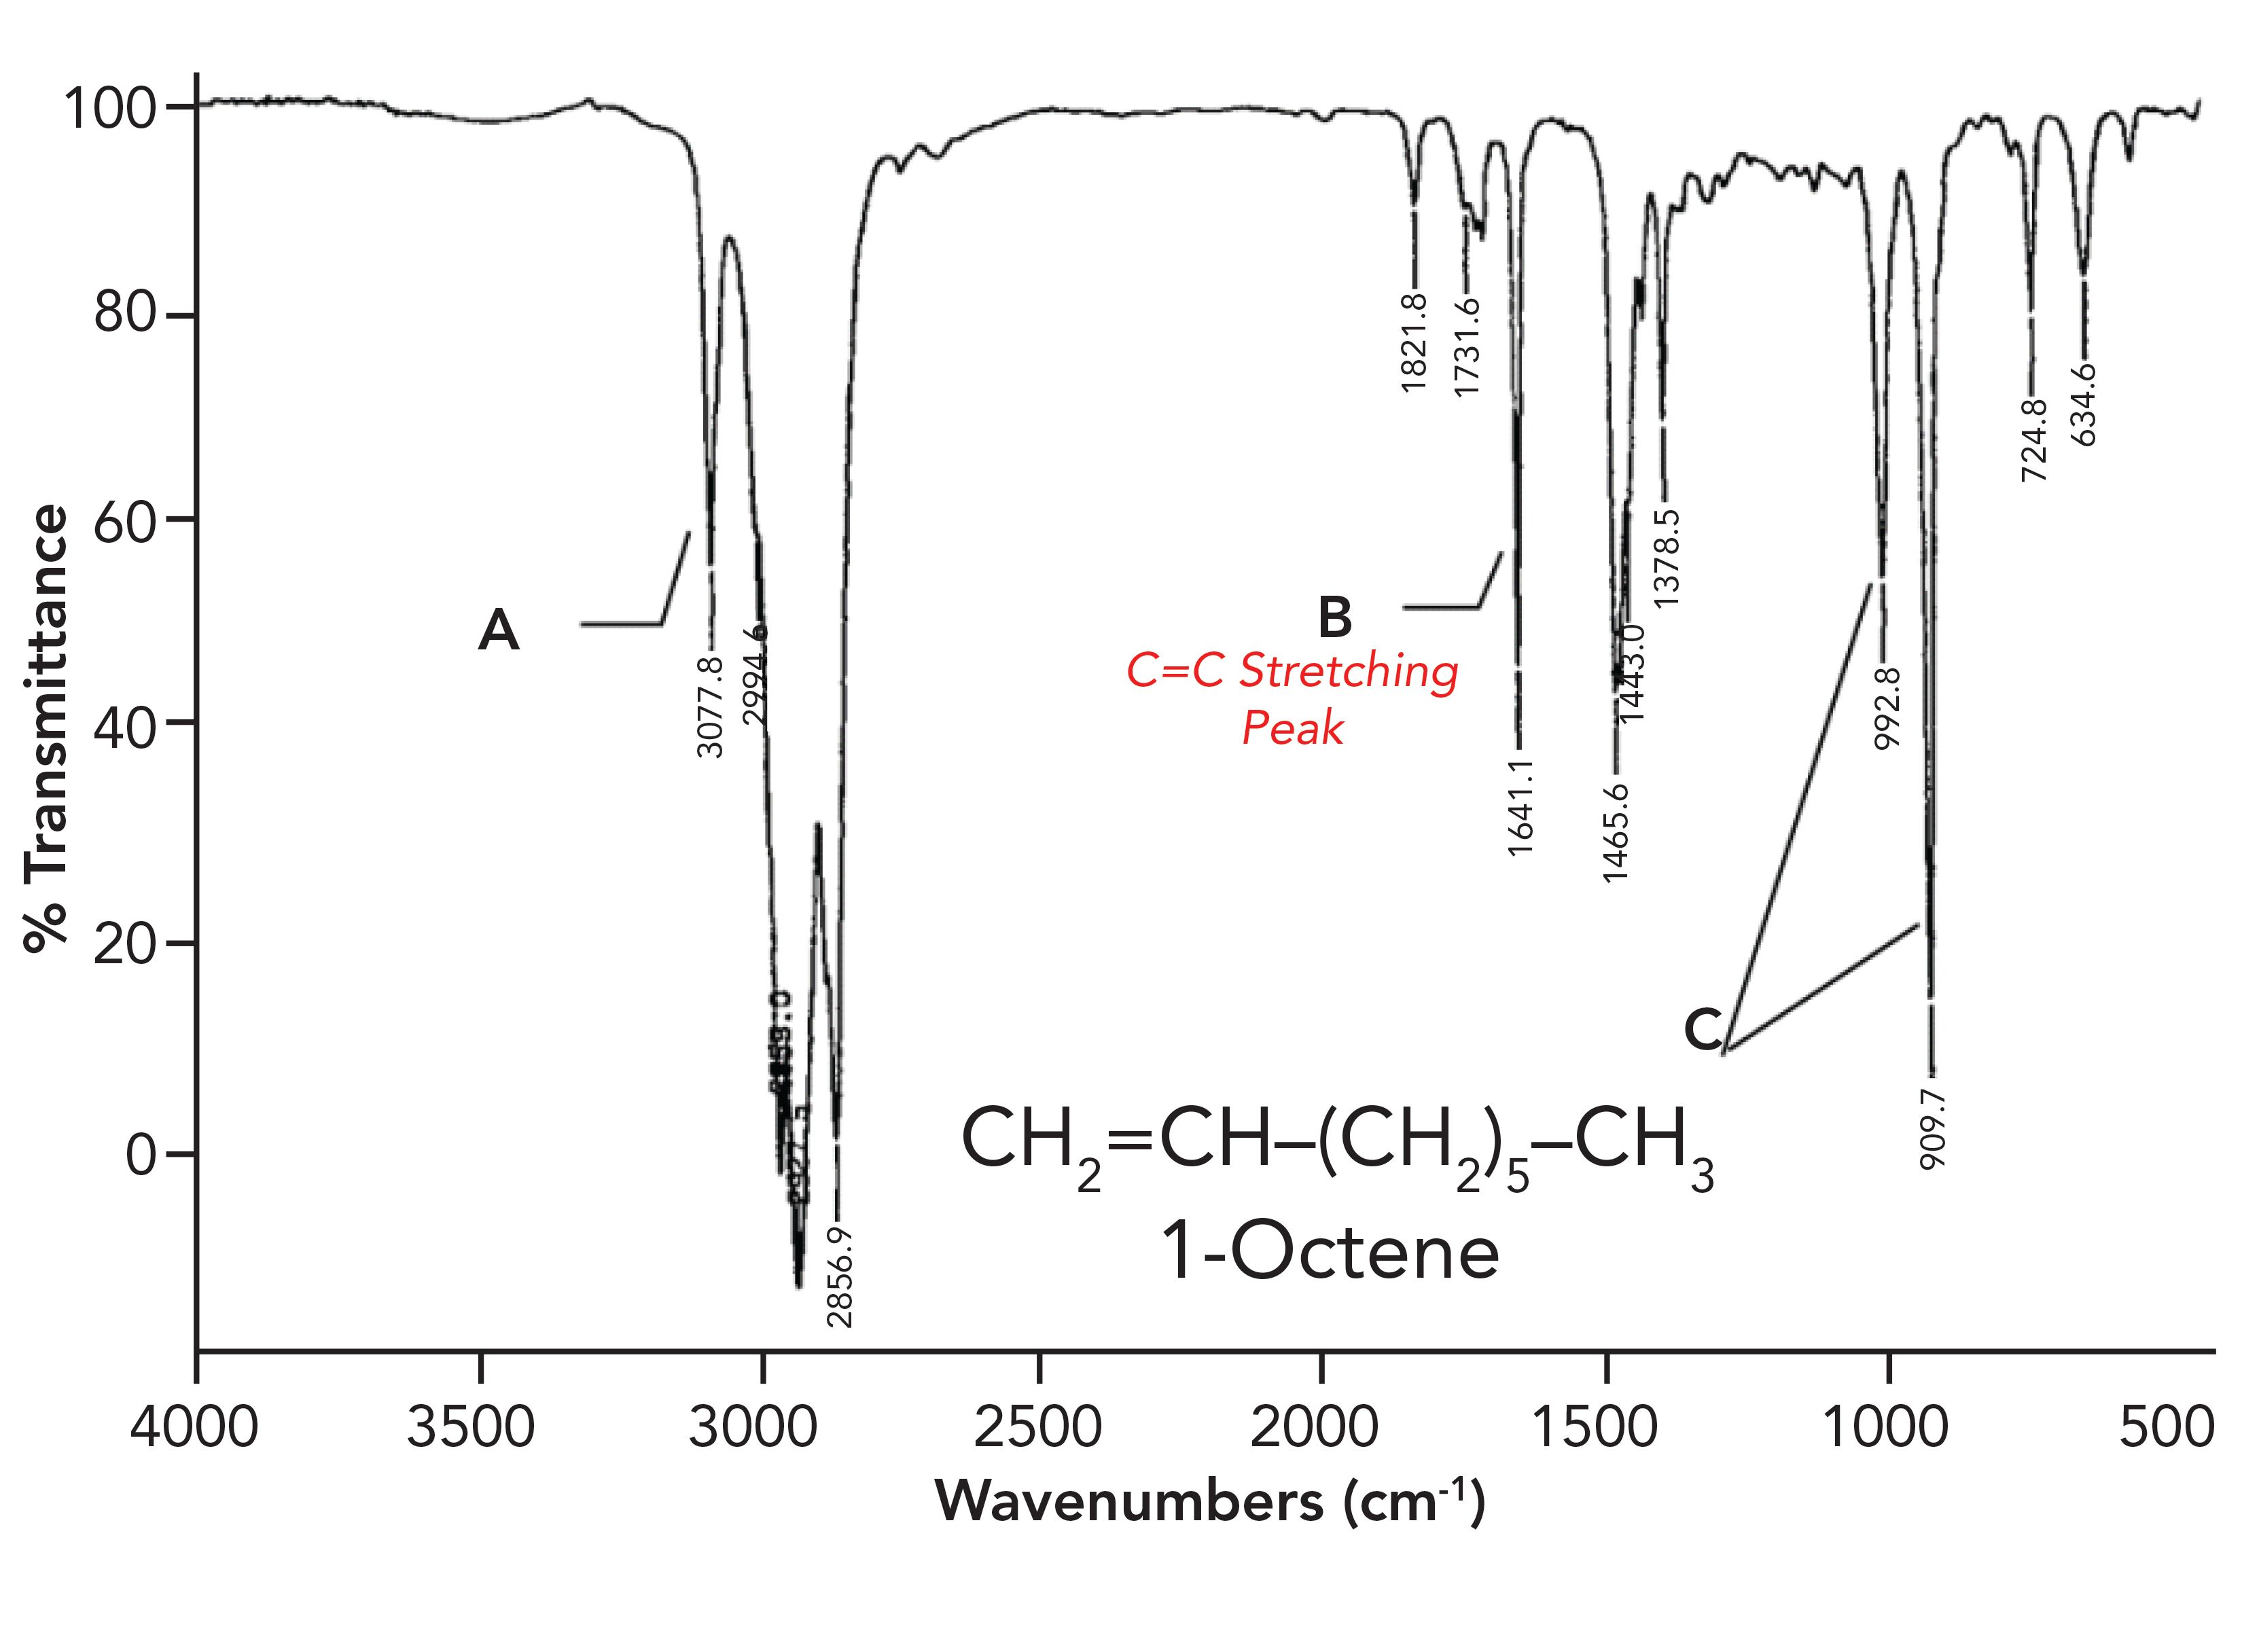
The peak labeled B at 1641 is an example of a C=C stretching peak.
C≡C bonds are even stronger than C=C bonds, and therefore have a stretching peak position typically near 2100. An example of a C≡C stretching peak is shown in the spectrum of 3,3-dimethyl-1-butyne in Figure 5.
Figure 5: The infrared spectrum of 3,3-dimethyl-1-butyne. Note the C≡C stretching peak near 2100.
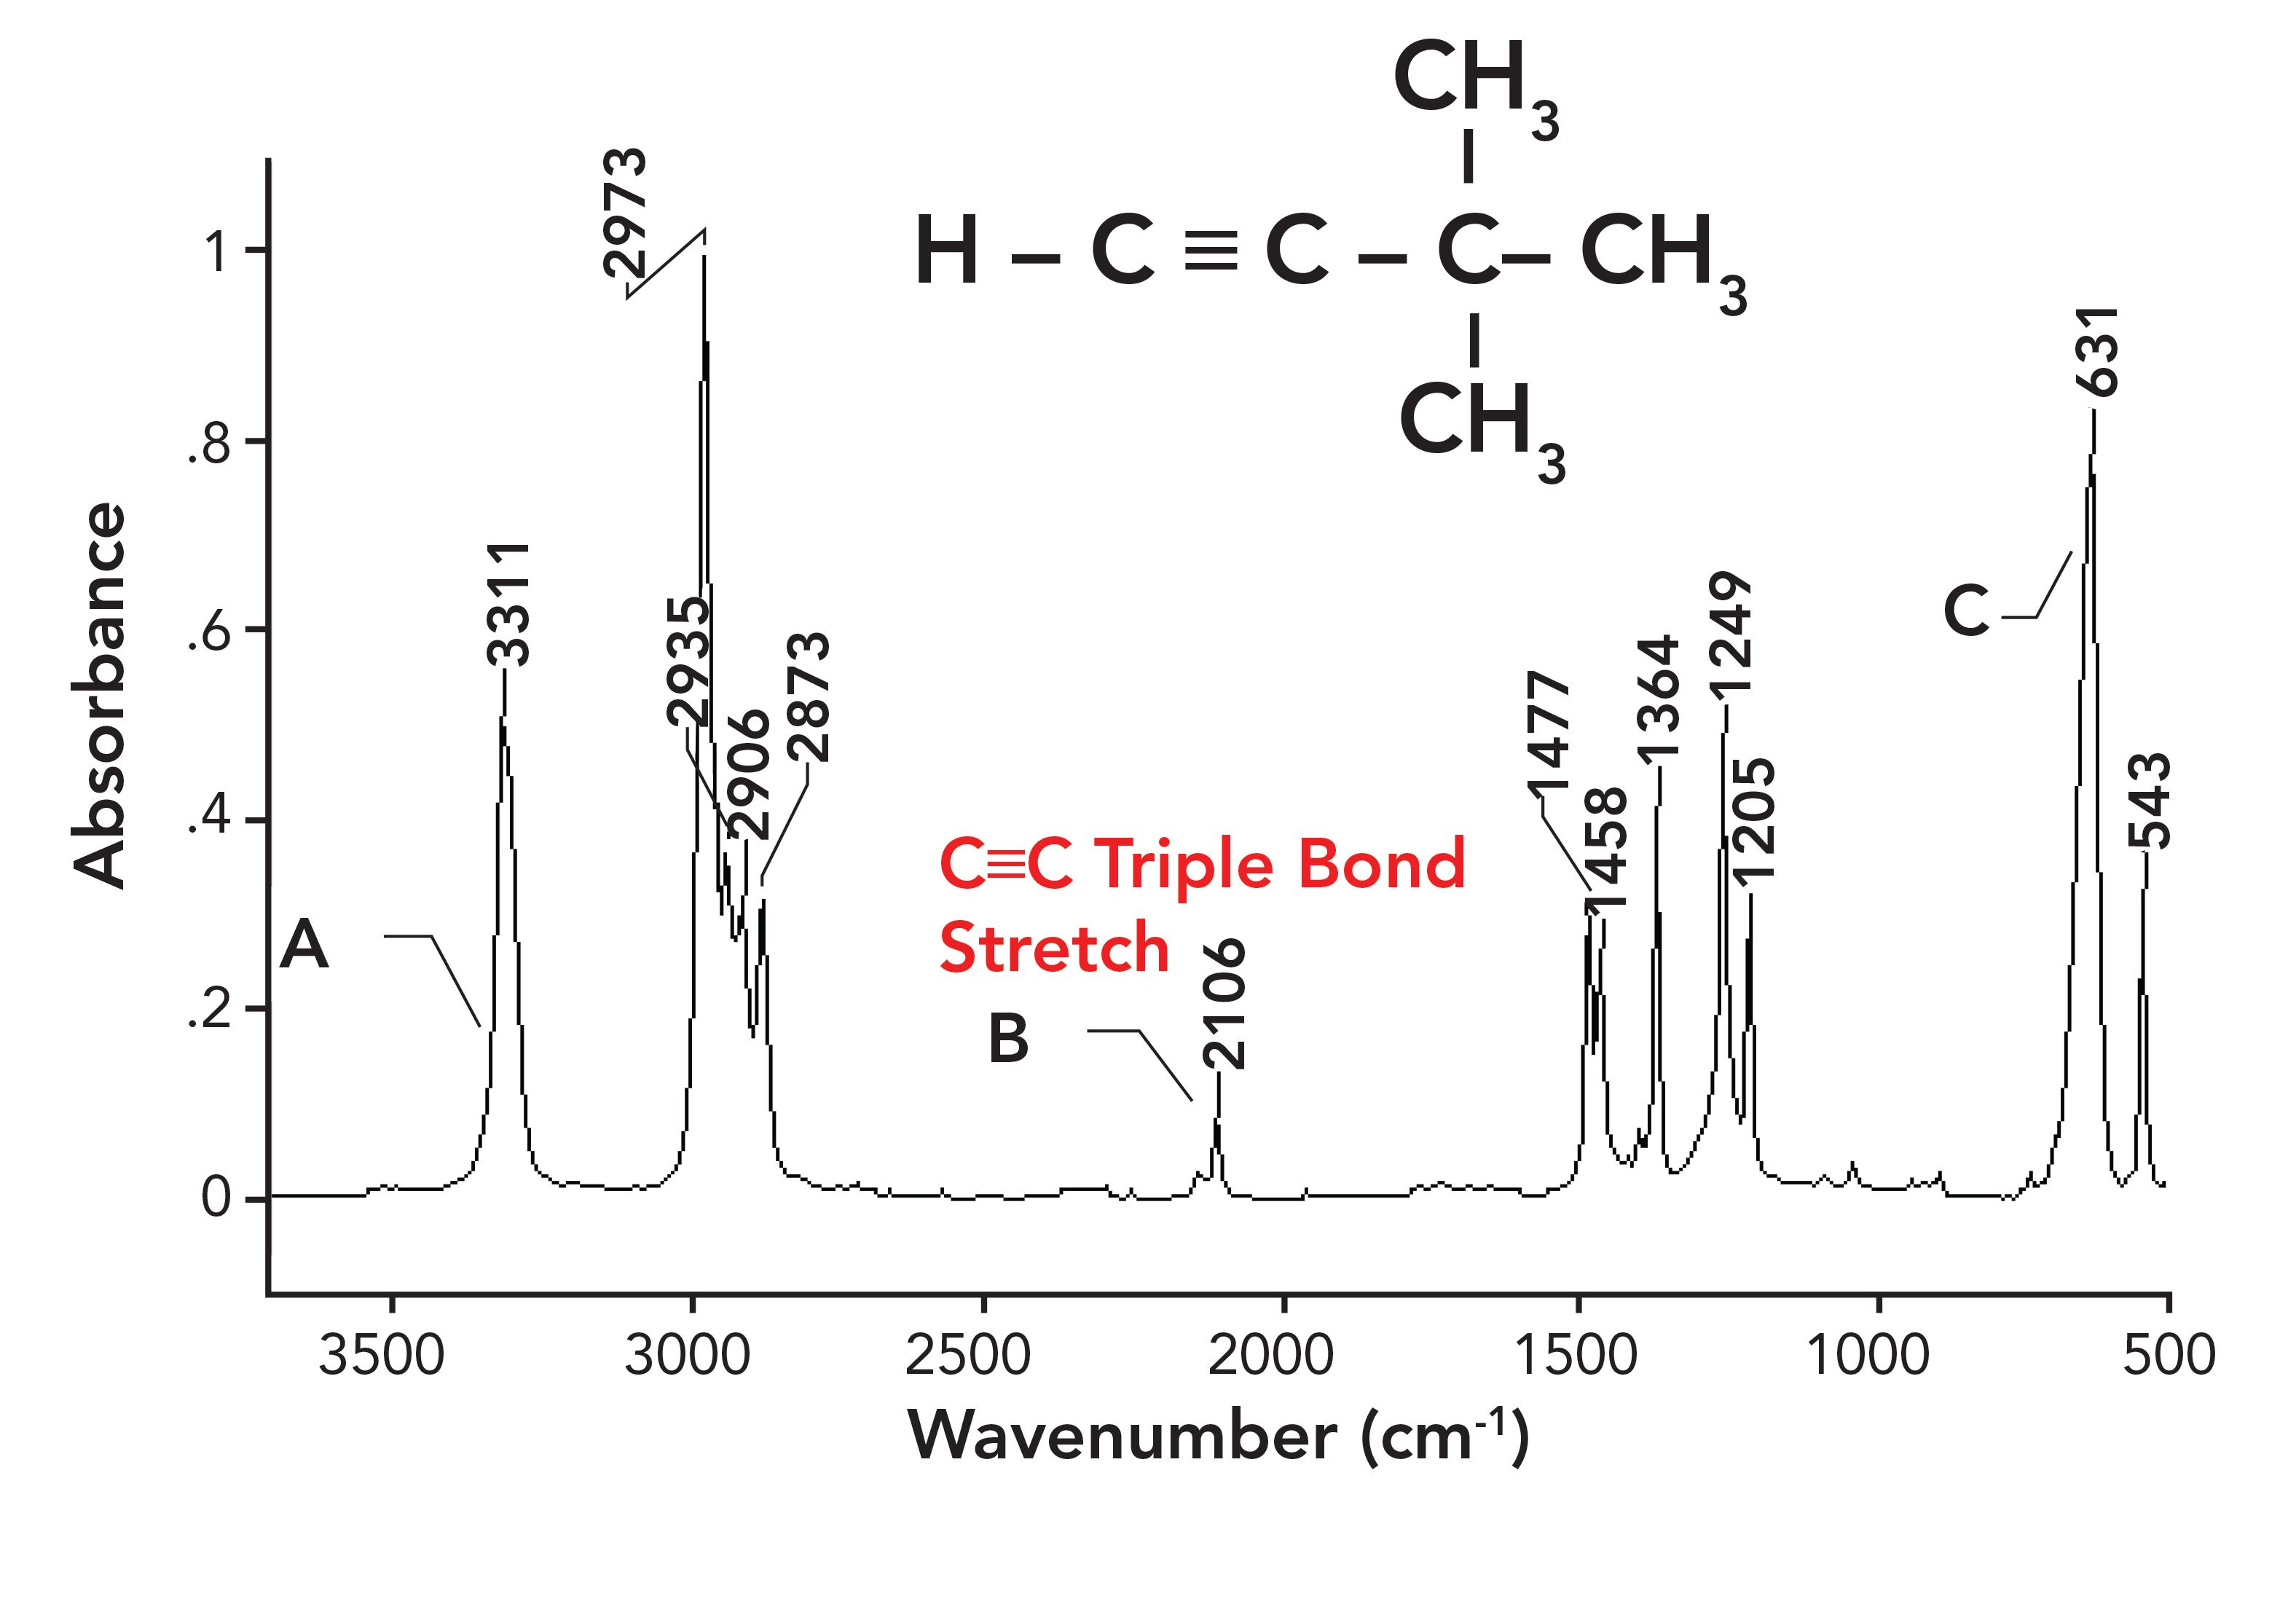
In summary then, we have seen a classic example of an electronic effect, where a change in bond strength causes C-C, C=C, and C≡C stretching peaks to appear from 1400 to 1000, 1680 to 1630, and ~2100, respectively.
The denominator in equation 3 contains the reduced mass, therefore molecules with heavy atoms in them have lower wavenumber peaks than molecules with light atoms in them. When peak positions change because of a change in atomic mass, it is called a mass effect. A classic example of a mass effect is the wavenumber region where peaks of organic and inorganic molecules fall. As we have seen, organic functional groups contain light elements such as C, H, N, and O. In general, most of the peaks from these functional groups fall above 400. Figures 3, 4, and 5 illustrate this well.
Inorganic molecules are composed of heavier metal atoms such as Na, K, Ca, and Pb. Many of the peaks from inorganic functional groups fall below 400. This is because metal atoms tend to weigh more than non-metal atoms. In fact, the reason that most FT-IRs can’t scan below 400 is that is where the inorganic material KBr, often used in beamsplitters, begins to absorb (1). An example of an inorganic with strong far infrared peaks is seen in Figure 6, the far infrared spectrum of calcium carbonate (CaCO3).
Figure 6: The far infrared spectrum of calcium carbonate (CaCO3).
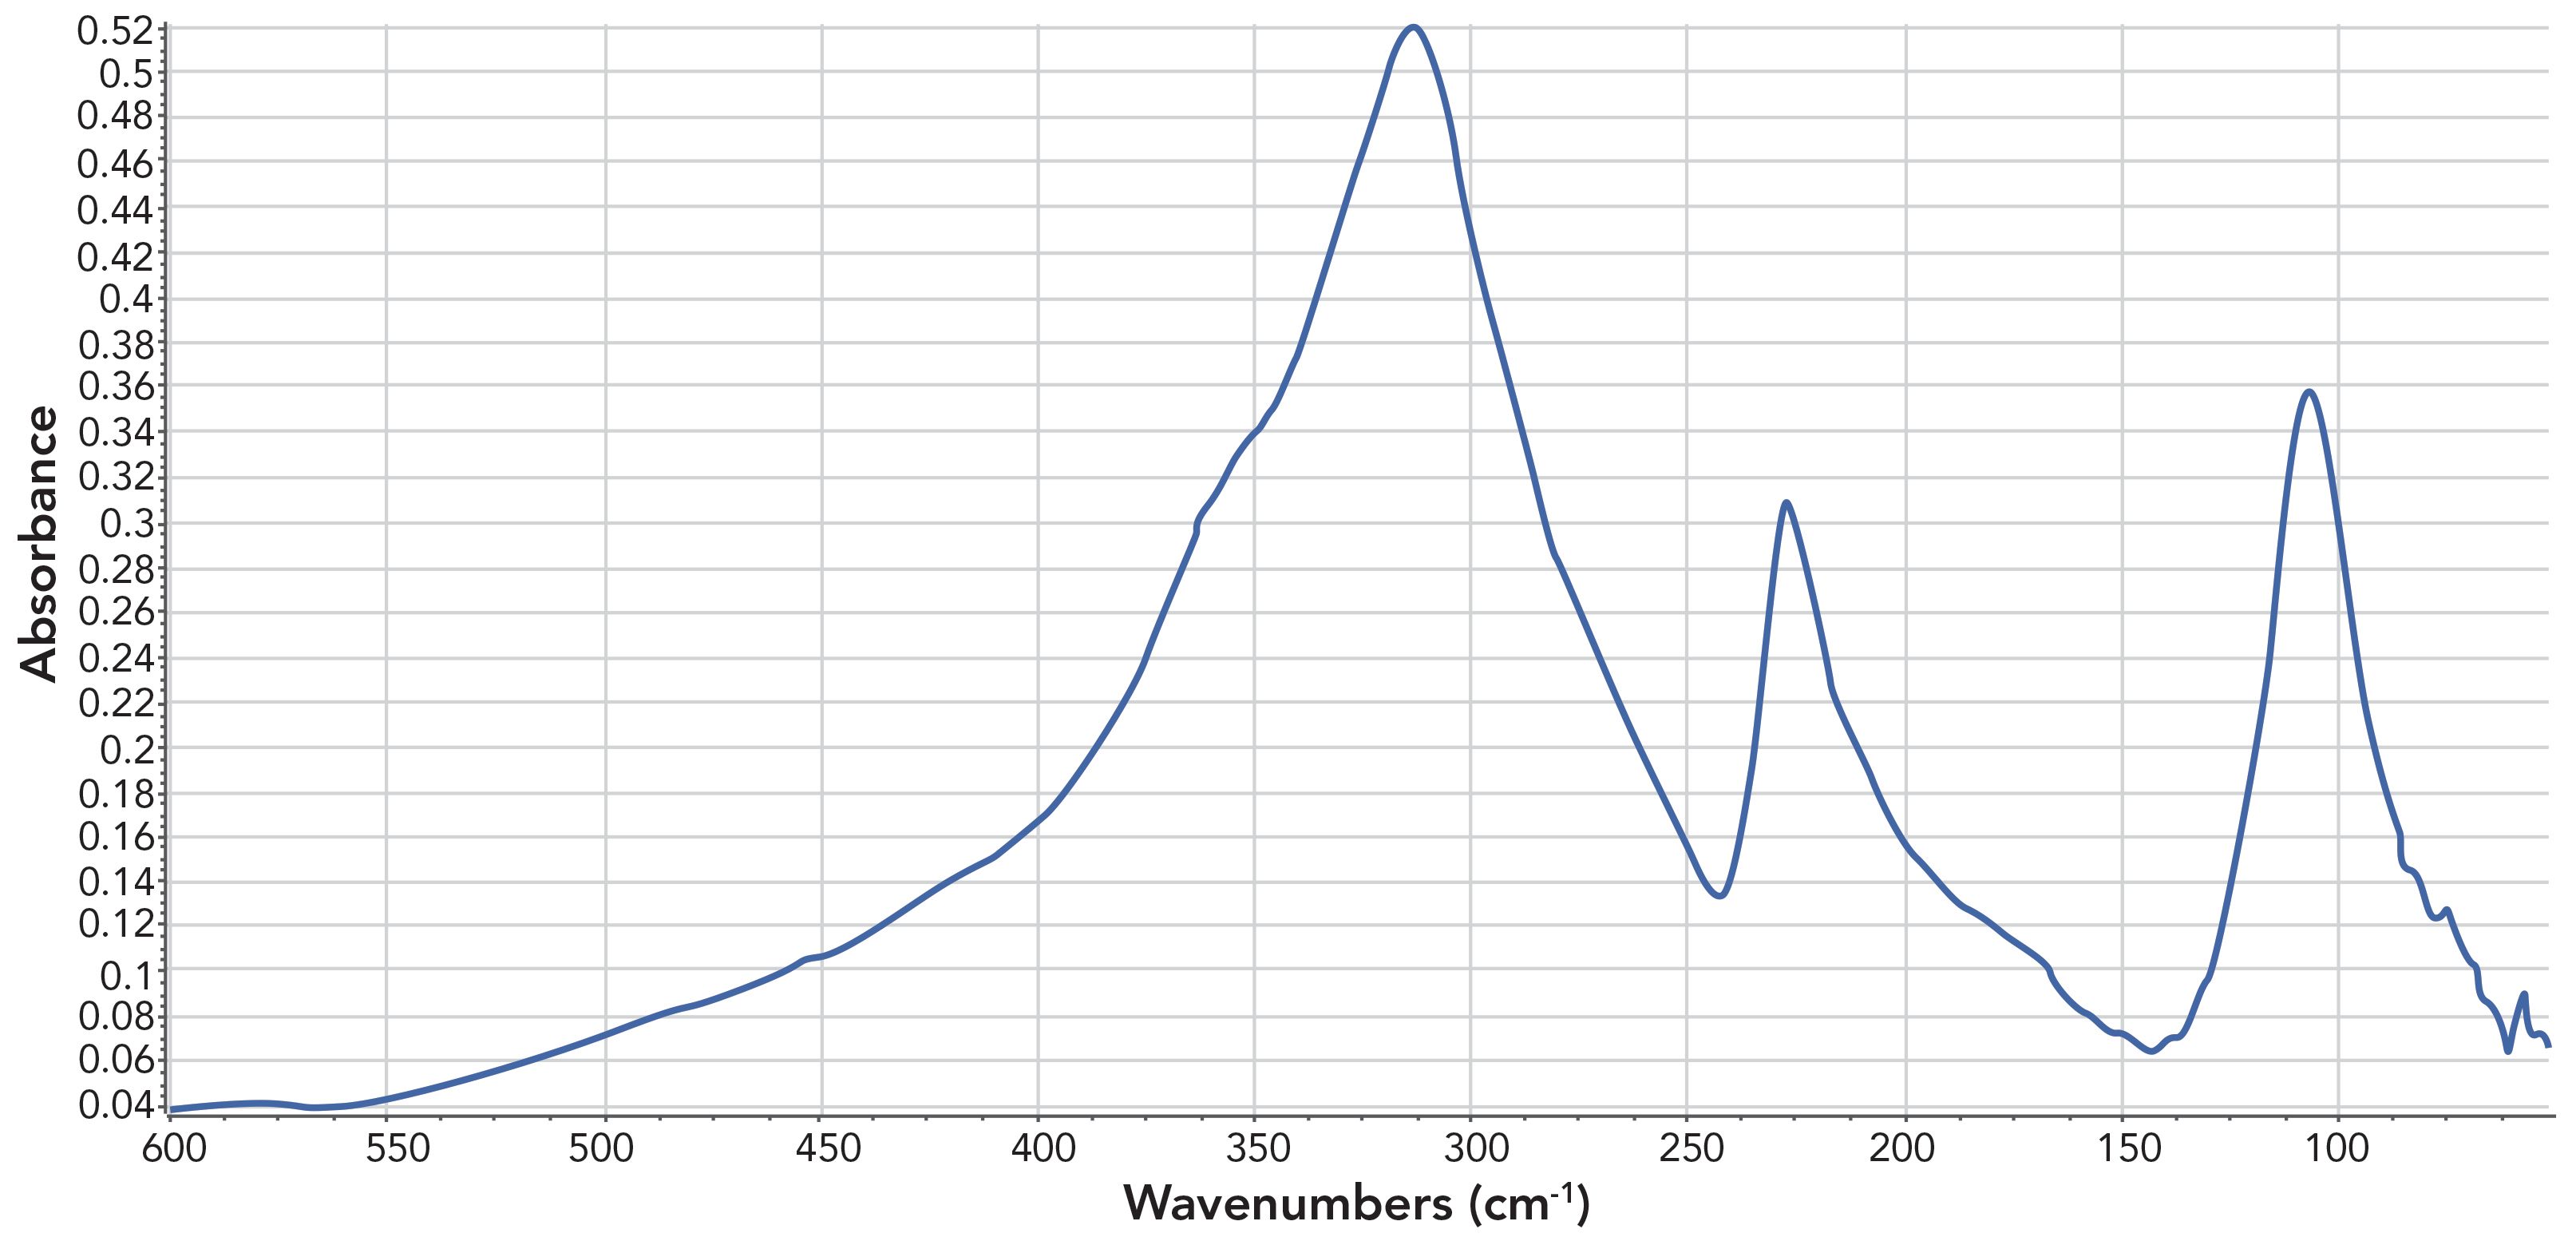
Note that the spectrum in Figure 6 is plotted from 600-1 to 50 cm-1, well into the far infrared that is typically defined as being from 400-1 to 4 cm-1 (1).
In summary, we have seen how changes in electronic structure and atomic mass impact peak positions. Much of what we know about why different functional groups have different peak positions can be understood utilizing these concepts (1).
Limits of the Harmonic Oscillator Model
Equation 3 is straightforward to understand, and lays a good foundation for understanding the connection between infrared peak positions and chemical structure. However, it is based on assumptions that are not always correct. In reality, most molecular vibrations are not harmonic, but anharmonic, which means their vibrational motion is much more complicated that what we have assumed here. In this case, we use the anharmonic oscillator model to describe these vibrations. The net effect is that equation 3 is modified with extra terms to take anharmonic motion, or anharmonicity, into account (7–9). This being said, equation 3 is still approximately correct, and serves to explain much of what we observe in terms of why different functional groups absorb at different wavenumbers.
Conclusion
The correlation between molecular structure and peak positions is a large part of what makes infrared spectroscopy useful. Using the Harmonic Oscillator model, Equation 3 was derived , relating peak positions to force constant and reduced mass. When changes in force constant cause a change in peak position, it is called an electronic effect. When changes in atomic mass cause a change in peak position, it is called a mass effect. Much of what we know about why different functional groups have different peak positions can be understood using the concepts of electronic effect and mass effect. The limitations of the harmonic oscillator model were also discussed.
References
- B.C. Smith, Infrared Spectral Interpretation: A Systematic Approach (CRC Press, Boca Raton, Florida, 1999).
- L. J. Bellamy, The Infrared Spectra of Complex Molecules (Chapman and Hall, London, United Kingdom, 1975).
- D. Lin-Vien, N. Colthup, W. Fately, and J. Graselli, The Handbook of Infrared and Raman Characteristic Frequencies of Organic Molecules (Academic Press, Boston, Massachusetts, 1991).
- N. Colthup, L. Daly, and S. Wiberley, Introduction to Infrared and Raman Spectroscopy (Academic Press, Boston, Massachusetts,1990).
- G. Socrates, Infrared and Raman Characteristic Group Frequencies (Wiley and Sons, New York, New York, 3rd Ed., 2001).
- B.C. Smith, Spectroscopy 30(1), 2015, 16–23.
- G. Herzberg, Infrared and Raman Spectra (Van Nostrand, New York, New York 1959).
- E. B. Wilson, J.C. Decius, and P. C. Cross, Molecular Vibrations: The Theory of Infrared and Raman Vibration Spectra (Dover Publications, New York, New York, 1955).
- J. M. Hollas, Modern Spectroscopy (Wiley and Sons, New York, New York, 1996).

Brian C. Smith, PhD, is the founder and CEO of Big Sur Scientific, a maker of portable mid-infrared cannabis analyzers. He has over 30 years experience as an industrial infrared spectroscopist, has published numerous peer-reviewed papers, and has written three books on spectroscopy. As a trainer, he has helped thousands of people around the world improve their infrared analyses. In addition to writing for Spectroscopy, Dr. Smith writes a regular column for its sister publication Cannabis Science and Technology and sits on its editorial board. He earned his PhD in physical chemistry from Dartmouth College. He can be reached at: SpectroscopyEdit@ MMHGroup.com

AI Shakes Up Spectroscopy as New Tools Reveal the Secret Life of Molecules
April 14th 2025A leading-edge review led by researchers at Oak Ridge National Laboratory and MIT explores how artificial intelligence is revolutionizing the study of molecular vibrations and phonon dynamics. From infrared and Raman spectroscopy to neutron and X-ray scattering, AI is transforming how scientists interpret vibrational spectra and predict material behaviors.
Real-Time Battery Health Tracking Using Fiber-Optic Sensors
April 9th 2025A new study by researchers from Palo Alto Research Center (PARC, a Xerox Company) and LG Chem Power presents a novel method for real-time battery monitoring using embedded fiber-optic sensors. This approach enhances state-of-charge (SOC) and state-of-health (SOH) estimations, potentially improving the efficiency and lifespan of lithium-ion batteries in electric vehicles (xEVs).
New Study Provides Insights into Chiral Smectic Phases
March 31st 2025Researchers from the Institute of Nuclear Physics Polish Academy of Sciences have unveiled new insights into the molecular arrangement of the 7HH6 compound’s smectic phases using X-ray diffraction (XRD) and infrared (IR) spectroscopy.