Transmission Raman: A Method for Quantifying Bulk Materials
The motivation for the development of an instrument for transmission Raman measurements is described. The basic instrumentation and the first results from a commercial system are provided. Transmission Raman spectroscopy (TRS) performance is compared to and contrasted with that of a confocal Raman microscope.
Modern Raman instrumentation has evolved to provide enhanced sensitivity, ease-of-use, and a small footprint. Consequently, a wide range of applications has been developed successfully over the past few years, attracting the attention of analysts requiring the detailed information that Raman spectra provide.
The emphasis in recent years has been on Raman microscopy, because sampling with the microscope has enabled easy and efficient measurement of solid samples, has allowed scientists to avoid much of the fluorescence interference, and has provided spatial resolution with information content that is virtually unavailable from any other technique. Raman imaging has provided spatially resolved chemical information at the scale of submicrometers to hundreds of micrometers, the results of which can offer spatial heterogeneity of chemical components, or chemical identity of morphological elements.
As the importance and usefulness of Raman microscopy and imaging (highly spatially resolved analysis) is being established, the concern for healthy statistical representation of the entire sample has been raised. For example, the physical dimensions of a typical pharmaceutical tablet are in centimeters while the typical sampling volume of Raman microscopy measurement is in micrometers. It is apparent that single measurements cannot represent the characteristics of the entire sample. Raman imaging can analyze the entire surface of a sample with ever-increasing speed, but it still is a surface analysis method, which represents only a fraction of the entire volume of the sample. A different approach is required that allows the measurement of an entire sample, or at least a large percentage of the sample, without prejudice to surface material.
Transmission Raman has been introduced as a possible solution. The development has resulted in at least one instrument with monitoring content uniformity of the solid dosage (for example, tablets or capsules) as the first application of many to come. A solid dosage form is formulated to contain a certain amount (a load) of active pharmaceutical ingredient (API). As with any other pharmaceutical products, it is critical that each unit (for example, a tablet) contains the same amount of API (content uniformity) to guarantee the specified dosage is delivered to the patient. In a transmission Raman scheme, the sample is illuminated on one side and the Raman scattered light is collected on the distal (far) side. For any photon to be detected, it has to transverse the entire thickness of the sample, which is what guarantees that the signal represents the entire sample. The Raman spectrum will show the contribution from all components present, in the proportion of their contents, and any change will flag possible changes in API contents of the tablet.
Clearly, this is of importance for pharmaceutical tablets, but there are other materials, especially ones that are highly scattering, where this type of measurement can be of benefit. Certainly, composites including ceramics and polymers fall into this category. The only requirement is that the sample does not absorb the light. The distinction must be made between scattering and absorption. If there is no optical absorption, the material is colorless. It will be white, however, when there is a mass of compacted particles. The white "color" is the result of multiple scattering events, which are really just subsequent reflections off of each particle interface. Because of this scattering, the material is not transparent. Light will not be transmitted along straight paths, so an image cannot be transmitted, but light can exit the far side after multiple scattering events.

Figure 1
Figure 1 illustrates the conceptual differences between the different optical schematics for exciting and collecting Raman signals. Table I summarizes the key aspects of these schematics. All are based upon the backscattering configuration except for transmission Raman. When materials are optically clear (nonscattering), it is possible to probe the bulk with the backscattering configuration by focusing in the interior, but only transmission Raman enables measuring the bulk when there is scattering.

Table I: Summary of key aspects of various optical schematics of Raman measurements
Implementation of Transmission Raman
Figure 2 illustrates the principle of a transmission Raman experiment. The laser illuminates one side of the sample and the Raman-scattered light that exits the far side is collected and sent to the analyzer (monochromator and CCD). The results shown in this article were obtained using the AccuRA transmission Raman system (HORIBA Scientific, Edison, New Jersey), which includes an automated sample tray for tablets.
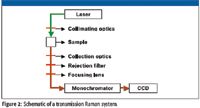
Figure 2
The main goal of a transmission Raman measurement is to characterize the entire sample very quickly so a large number of samples can be compared. Figure 3 shows transmission Raman spectra measured from the same tablet containing 20% API with varying acquisition time from 1 s to 0.1 s. The signal-to-noise ratio varies according to the length of the acquisition time, and still is high enough to yield scientifically meaningful results at 0.1 s acquisition time.

Figure 3
Previous studies reported that Raman spectra of a bilayer tablet measured from each side using transmission Raman were virtually identical, while those recorded using the macro backscattering configuration favored the measured side. They also demonstrated that reproducibility of the transmission Raman measurements is minimally affected by sample positioning and tilting.
Another investigation was performed to compare content uniformity between equivalent commercial products manufactured by the innovator and a generic company.
Comparison with Raman Microscopy
Samples with a colored coating such as Tylenol PM (McNeil-PPC, New Brunswick, New Jersey) appear opaque (yielding spectra only from the coating, not from the core) to Raman microscope measurements. This is because the Raman microscope measurement is performed in backscattering configuration, which favors the surface, and with a focused beam, which limits the sampling volume to the focal point. In contrast, the transmission Raman measurement, performed in forward scattering configuration with a collimated beam, is more successful in measuring the contents of the tablet. Figure 4 shows Raman spectra measured from a Tylenol PM tablet in various conditions. Figure 4d shows a Raman spectrum of the tablet obtained after the coating was scraped off, recorded with a Raman microscope, and it shows the spectral features from the drug inside. Figures 4b and 4c show the spectra of the tablet when the coating is intact, recorded with a Raman microscope, the laser focused on the surface and 5 mm below, respectively. Both spectra are dominated by the TiO2 in the coating. The penetration of the laser beam is limited due to light absorption by the colored material in the coating. Figure 4a shows the spectrum recorded with a transmission Raman instrument showing spectral features from all ingredients in the tablet.
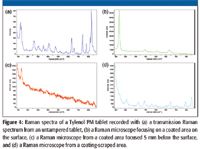
Figure 4
Figure 5 shows a photograph of Advil (Wyeth Consumer Healthcare, Madison, New Jersey) and Tylenol PM tablets, both with colored coatings, mounted on the sampling tray, with their spectra recorded on a transmission Raman instrument. Two distinctively different spectra were observed, clearly identifying and classifying them according to their identity.
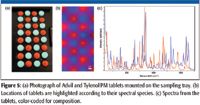
Figure 5
Figure 6 shows the photograph of aspirin and acetaminophen tablets; both are white and of similar sizes, mounted on the sampling tray, and their spectra recorded with a transmission Raman instrument. Again, two distinctively different spectra were observed according to their chemical ingredients.
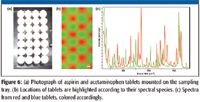
Figure 6
Summary
Transmission Raman has progressed from a proof-of-concept stage to a robust, commercialized system in a short amount of time. It has been demonstrated that Raman spectra that represent the entire tablet can be recorded rapidly and reproducibly. The Raman spectra can be used to quantify API contents in the tablet.
Eunah Lee and Fran Adar are with Horiba Scientific, Edison, New Jersey.
References
(1) A. Sparén, J. Johansson, O. Svensson, S. Folestad, and M. Claybourn, American Pharmaceutical Review, Jan/Feb 2010.
(2) J. Johansson, A. Sparén, O. Svensson, S. Folestad, and M. Claybourn, Applied Spectroscopy 61(11), 1211–1218 (2007).
(3) Andrew Whitley, "Transmission Raman: Just what the doctor ordered!", IFPAC 2010.
How THz and THz-Raman Spectroscopy Are Used in Drug Safety, Farming, and Mining
May 20th 2025A new review by researchers from IIT Delhi and the University of Queensland highlights how Terahertz (THz) and low-wavenumber Raman (THz-Raman) spectroscopy are advancing quality control and efficiency in pharmaceuticals, agriculture, and mineral industries. These powerful non-invasive tools enable detailed multi-parameter sensing, offering deeper insight at the molecular level.
The Rise of Smart Skin Using AI-Powered SERS Wearable Sensors for Real-Time Health Monitoring
May 5th 2025A new comprehensive review explores how wearable plasmonic sensors using surface-enhanced Raman spectroscopy (SERS) are changing the landscape for non-invasive health monitoring. By combining nanotechnology, AI, and real-time spectroscopy analysis to detect critical biomarkers in human sweat, this integration of nanomaterials, flexible electronics, and AI is changing how we monitor health and disease in real-time.
Nanometer-Scale Studies Using Tip Enhanced Raman Spectroscopy
February 8th 2013Volker Deckert, the winner of the 2013 Charles Mann Award, is advancing the use of tip enhanced Raman spectroscopy (TERS) to push the lateral resolution of vibrational spectroscopy well below the Abbe limit, to achieve single-molecule sensitivity. Because the tip can be moved with sub-nanometer precision, structural information with unmatched spatial resolution can be achieved without the need of specific labels.

.png&w=3840&q=75)

.png&w=3840&q=75)


.png&w=3840&q=75)


.png&w=3840&q=75)
