What Does Your Proficiency Testing (PT) Prove? A Look at Inorganic Analyses, Proficiency Tests, and Contamination and Error, Part I
Trace inorganic analysis is an essential part of analytical testing. In many cases, contamination can alter or skew elemental analysis, which leads to inaccurate results. Another way in which contaminants can alter results in a detrimental fashion is in regard to proficiency testing and laboratory audits. Proficiency testing (PT) is a series or schemes of samples that are intended to assess the performance of individuals or laboratories in specific areas or for specific analytical tests. PT is also designed to be used to improve processes and methods. If contamination and error enter into the analysis process, then the results can be altered, causing the analyst or laboratory to perform poorly in a PT scheme. In this two-part article, we examine the development, rationale, and best practices for PT, including how contamination can enter inorganic samples and how to eliminate or control those sources.
Proficiency testing (PT) is a phrase that often solicits groans or resigned sighs. Most of us on the receiving end of a proficiency test dislike even the thought of being “evaluated” despite the fact that testing is our “business” in many cases. The truth is that PT is not a tool to trick analysts or put them on the spot. Laboratories use PT to comply with their accreditation requirements and evaluate analyst performance. PT is an integral part of a quality management system (QMS) under quality assurance and control (QA/QC).
Quality Management Systems (QMS)
A QMS contains the practices and processes a business follows to meet customer requirements. The International Organization for Standardization (ISO) has become one of the world’s largest developers of voluntary international standards for all manufactured, agricultural, and technological products and services. The standards issued by ISO are the framework for the quality management systems of ISO accredited companies and laboratories (1).
In the 1990s, ISO began creating standards for laboratories to standardize procedures and ensure competency and accuracy. Throughout the years, laboratories, reference materials, and PT providers have pursued ISO accreditation for their facilities as a mark of quality and reliability (2).
A QMS includes components such as a mission statement, goals, and objectives through all the processes for organizational structure, data management, manufacturing processes, and QA/QC. Many laboratory practices fall under the heading of QA/QC while still being part of the overall quality system. Laboratory QA/QC has may processes routinely included in standard operating procedures (SOP). Some of the key processes for analytical laboratories are the use of certified reference materials (CRMs) or standards, the use of validated or verified methods, and the use of PT to ensure quality.
Understanding PT
In PT, one uses characterized samples that are created to represent the types of samples, matrices, and targets being analyzed in laboratories. Most of the time, these samples contain measured values that are not disclosed to the PT participants and are treated like blind samples—samples in which the nature and quantities are unknown. Some proficiency tests may give information in regard to the target identity, quantitative range, and other information, which directs the analyst in how to perform sample preparation or analyses. PT samples can come in many different forms, from solid or liquid native matrices to extracted oils, liquids, and solids. The analyst is expected to prepare and treat the PT sample in the same way similar types of samples would be routinely processed.
PT participants confidentially share their results with the PT provider for final evaluation and grading. In this way, PT serves as an indicator for the competency of an individual laboratory staff and its analytical performance. Results reported to the PT provider are compared to the reference values established for that PT, which are either established by a reference laboratory or determined by averaging the values reported by the PT participants. Participating PT laboratories can report their values either as individual values or as a composite average value determined by the results obtained by all their individually tested analysts.
PT participants that achieve passing PT results are ensuring the validity and reliability of their laboratory test results. PT is an external quality assessment tool. PT should be an integral part of the testing laboratory’s quality system. In the evaluation of a PT program, the laboratory must consider some critical points: the qualifications of the PT administrator; the quality and qualifications of the PT provider; and the accessibility of data. Within most QMS systems, such as those based on the ISO guidelines, laboratories are required to use certified providers for their analytical standards, methods, and PT. For ISO 17025 laboratories, PT providers must be accredited to ISO 17043 and CRM providers to ISO 17034.
PT is not a means of method validation. Methods used for PT should have previously been validated by the laboratories or standards organizations that have issued those methodologies—that is, the United States Pharmacopeial Convention (USP) (3) and the American Society for Testing and Materials (ASTM) International. PT serves to measure the ongoing proficiency of independent laboratories through interlaboratory comparison of test results for the same sample. Some regulatory bodies stipulate the frequency of PT participation, requiring laboratories to participate in PT on an annual basis. Other laboratories participate in accordance with their accreditation audit schedule. Some accreditation audits only occur once every other year. Thus, the laboratories would participate in PT once every two years.
Understanding the key components of the QMS a laboratory operates under is an important part of passing any PT test. Some of the issues with PT results are not the result itself but the way the statistics, standards, and methods of the QMS have been applied, leading to error.
Evaluating Methods for Regular Use and Proficiency Testing
Analytical methods intended for use in an accredited laboratory (for regular use or in PT) must either be validated or verified under the laboratory’s QMS. Method validation is the process in which a new method undergoes testing and statistical analysis to determine if it is fit for the intended purpose. Method validation occurs either when a new method is created, or when an existing method is changed so significantly that all the statistical parameters need to be reestablished. Method verification occurs when a method is transferred from one type of process to another similar type of process, such as transferring an atomic absorption (AA) method to an inductively coupled plasma (ICP) method.
Passing a proficiency test can serve as method verification because PT is used to check an already validated method. For example, standard methods and compendial methods are verified, whereas in-house–developed methods are validated. After an in-house method has been validated, it can be verified by successfully passing a proficiency test from an accredited third-party provider. In this example, PT is integral to the QMS of the participant laboratory (4).
All methods must undergo statistical evaluations and must establish the method dynamic range as part of the quality management program, including the statistical concepts of true value, error, bias, uncertainty, accuracy, and precision, which are all interrelated concepts.
Understanding the Basis of Laboratory Statistics
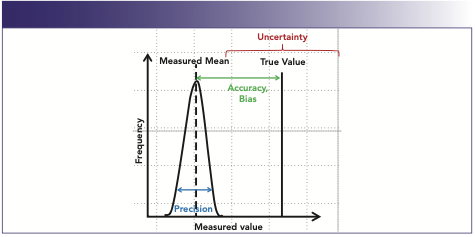
The goal for all analytical analyses is to have measured values close to the true value. Accuracy is a measurement of how close measured values get to the true value; precision indicates how close a group of results are to one another.
Factors that move the measured value away from the true value are called bias or error. Bias is the partiality or systematic deviation from the true value that results in over or underestimation. Error is the difference between the measurement and the true value. Error causes values to differ when measurement is repeated. It is impossible to completely eliminate error, but it can be controlled and documented.
Errors are characterized as random or systematic. Random errors are fluctuations and variances in even the most tightly controlled systems that produce anomalies. Random errors are often impossible to eliminate. Precision is often associated with the statistical measurement of random error. The second type of error is systematic error, which appears from a traceable source, such as instrument malfunction, record-keeping errors, or measurable repeated variants, that affects result outcomes. Systematic errors can often be eliminated by routine maintenance, procedure changes, or record keeping (Figure 1).
FIGURE 1: Graphic representation of accuracy, bias, and precision.
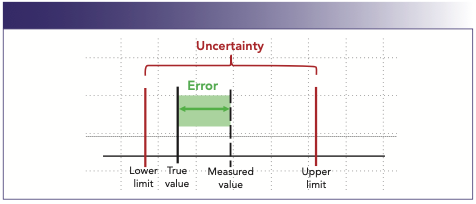
The final important concept for laboratory analyses is uncertainty. Uncertainty is a statistical estimate attached to a value that characterizes the range of values where the true value lies within a stated confidence interval. Uncertainty estimates the effect of short-term fluctuations, variables in the performance of an analyst or piece of instrumentation, or accounts for bias or drift that can be corrected or calculated (Figure 2).
FIGURE 2: Graphical representation of uncertainty and error.
Uncertainty can be calculated in many different ways depending on the type of instrument, equipment, or processes being evaluated. However, all the possible factors that can influence or change the range of expected values must be included in an uncertainty calculation. A suitable QC-known certified reference material or reference standard should be employed for calculating statistics and validating an analytical method.
Importance of Standards in PT
Standards are a critical key in all analytical analyses. In the case of conducting a PT study or scheme, standards play a critical role in obtaining passing results. The first step in using standards as a part of an analytical process is to understand what standards or reference materials are and how they are used. Standards can be used for qualitative analysis (identity), quantitative analysis (numerical results), or both. They can also aid in identifying or eliminating errors, or be used to determine statistical variables, such as uncertainty, accuracy, and precision.
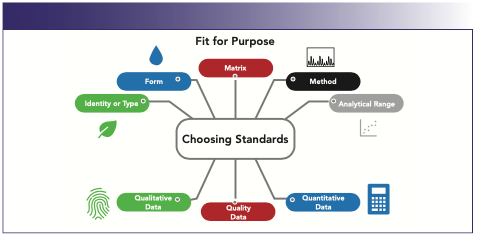
As a result, questions often arise regarding which standards are used and at what point standards are introduced into a sample preparation and analysis process. One of the most important considerations for choosing a standard (for both general analyses and PT schemes) is whether the standards fit for the purpose in which they will be used (Figure 3). Some questions to ask are: Does the standard reflect the identity or type of sample that is going to be tested? Are the forms (oil, power, solid, among others) of the standards or samples significantly different in a way that will affect the outcome of testing? In the same vein, is the matrix of all the samples, standards, and PT schemes the same or different, and will that change the results or processing? Are the standards amenable to the type of instrumentation being used? Will the samples and standards fall into the analytical range of those instruments? Will changes have to be made to the methods or instruments? The choice of standards can also be difficult to navigate because there are often many choices between reference materials, CRMs, standards, and QC samples.
FIGURE 3: The role of standards and fit for purpose.
Often, the highest level of commercially produced reference materials are certified standards or CRMs produced by primary or secondary standards providers under a QMS such as ISO. These suppliers produce CRMs that have one or more certified values with uncertainty established using validated methods and are accompanied by a certificate of analysis. The uncertainty characterizes the range of the dispersion of values that occur through the determinate variation of all the components that are part of the process for creating the standard.
CRMs have a number of uses, including validation of methods, standardization or calibration of instrument or materials, and for use in QA/QC procedures. A calibration procedure establishes the relationship between a concentration of an analyte and the instrumental or procedural response to that analyte.
A calibration curve is the plotting of multiple points within a dynamic range to establish the elemental response within a system during the collection of data points. The matrix effect can be responsible for either elemental suppression or enhancement. In analyses where a matrix can influence the response of target, it is common to match the matrix of analytical standards or reference materials to the matrix of the target sample to compensate for matrix effects.
Calibration Curves and PT
Calibration curves are the practical application or function of standards in analyses. Standards are diluted to points on the curve that reflect the range of target concentrations and are often affected by the limitations of the instrumentation. Data can become biased by calibration points biased by instrument limits of detection, quantitation, and linearity and by the response of the system versus its baseline (signal-to-noise).
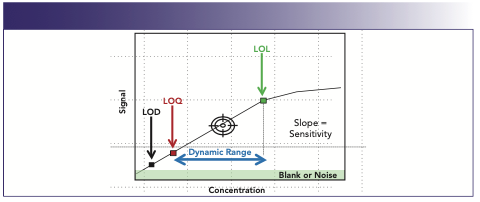
The limit of detection (LOD) is the lower limit of a method or system at which the target can be detected as different from a blank with a high confidence level (usually over three standard deviations from the blank response). The limit of quantitation (LOQ) is another lower limit of a method or system in which the target can be calculated, where two distinct values between the target and blank can be observed, usually over 10 standard deviations from the blank response (Figure 1). The signal-to-noise ratio (S/N) is a measurement of the ratio between response of an analyte to the baseline variation (noise) of the system. LOD values are often recognized as target responses that have three times the response of baseline noise or S/N ≥ 3. LOQs are recognized as target responses that have 10 times the response of baseline noise or S/N ≥ 10. Limits of linearity (LOL) are the upper limits of a system or calibration curve where the linearity of the calibration curve starts to be skewed, creating a loss of linearity. This loss of linearity can be a sign that the instrumental detection source is approaching saturation. Finally, dynamic range is the array of values between the LOQ and the LOL where the greatest potential for accurate measurements will occur. Dynamic range can be established for instruments and analytical methodologies. Effective calibrations are created within the system‘s and method’s dynamic range.
The establishment of an instrument’s dynamic range is most often designated by the type of instrumentation. The dynamic range for a method is most commonly established during the method validation or verification process (Table I and Figure 4).

FIGURE 4: Calibration curve limits and range.
Best Practices For PT and QMS
- Changes to methods or policies should all be completed and validated prior to any PT.
- Updated copies of those policies and procedures should be reviewed with all staff members participating in the PT.
- Train staff for proper handling of PT samples, results, and reports.
- Make sure all maintenance and repairs of systems are completed well in advance of a PT round.
- Calibration and linearity checks should be performed by analysts on equipment and instruments prior to starting PT.
- Replace all consumable chemicals with fresh materials.
- Complete any statistical evaluations of precision and accuracy needed for the intended method or systems before PT.
- Check calibration and cleanliness of equipment, volumetrics, and labware.
Derailing PT with Contamination and Error
The fastest way to significantly deviate from a result’s true value is by error and contamination. As we discussed earlier, there are some forms of error (random error) that are difficult to eliminate entirely. Then, there is systematic error, in which some mistakes or deviations in systems or procedures can be corrected. First, let us look at common sources of error in the laboratory: calculation, measurement and dilution mistakes, errors, and contamination.
Calibration curves are a key element of analytical procedures. These curves are created by diluting standards into several target points along the dynamic range to cover the possible target results. Proper dilution of standards and samples is based on the understanding of basic dilution and volumetric procedures and dilution factors. Volumetric measurement is a common repeated daily activity in most analytical laboratories. Many processes in the laboratory, from sample preparation to standards calculation, depend on accurate and contamination-free volumetric measurements. Unfortunately, laboratory volumetric labware, syringes, and pipettes are common sources of misuse, contamination, carryover, and error in the laboratory.
The root of these errors is based on the four “I” errors of volumetrics: incorrect choice, inadequate cleaning, infrequent calibration, and improper use. These four “I”s can lead to error and contamination, which negates all intent of careful measurement processes.
Incorrect choice can be seen in the choice of grades of labware or the selection of pipettes and syringes for analytical measurements. Many errors can be avoided by understanding the markings displayed on the volumetric containers and choosing the proper tool for the job. There is a lot of information displayed on volumetric labware. Most labware, especially glassware, is designated as either Class A (analytical or quantitative) or Class B (general use) labware. If a critical measurement process is needed, then only Class A glassware should be used for measurement.
As for syringes and pipettes, many manufacturers recommend a minimum dispensing volume of approximately 10% of the total volume of the syringe or pipette. Spex studies showed that dispensing such a small percentage of the syringe’s total volume created a large amount of error (5). Dispensing 20% of a 10 μL syringe created over 20% error. The error only dropped down below 5% once the volume dispensed approached 100%.
Larger syringes were able to get closer to the 10% manufacturer’s dispensing minimum without a large amount of error, but the error did drop as the dispensed volume approached 100%. The better choice for measuring materials using a syringe or pipette is to select a pipette closest to the targeted amount to be dispensed to reduce error.
Inadequate cleaning of syringes and pipettes can lead to crossover and contamination, which can skew your results. Many volumetric containers can be subject to memory effects and carryover. In critical laboratory experiments, labware sometimes needs to be separated by purpose and use. Labware subject to elevated levels of organic compounds or persistent inorganic compounds can develop chemical interactions and memory effects. It is sometimes difficult to eliminate carryover from labware and syringes even when using a manufacturer’s stated instructions. For example, many syringes are cleaned by several repeated solvent rinses prior to use. A study of syringe carryover by Spex showed that some syringes are subject to elevated levels of chemical carryover despite repeated rinses (5).
Infrequent calibration happens when a laboratory does not follow a quality plan or is lacking in its routine maintenance. Many laboratories have schedules of maintenance for equipment such as balances and automatic pipettes, but often overlook calibration of reusable burettes, pipettes, syringes, and labware. Under most normal use, labware often does not need frequent calibration, but there are some instances where a schedule of recalibration should be employed. Any glassware or labware in continuous use for years should be checked for calibration. Glass manufacturers suggest that any glassware used or cleaned at high temperatures, used for corrosive chemicals, or autoclaved, should be recalibrated more frequently. It is also suggested that under normal conditions, soda-lime glass should be checked or recalibrated every five years, and borosilicate glass should be checked after it has been in use for 10 years.
Inorganic analysts know that glassware is a source of contamination. Even clean glassware can contaminate samples with elements such as boron, silicon, and sodium. If glassware, such as pipettes and beakers, are reused, the potential for contamination escalates. At Spex, a study was conducted to measure the residual contamination of pipettes after being manually and automatically cleaned using a pipette washer (5). An aliquot of 5% nitric acid was drawn through a 5 mL pipette after the pipette was manually cleaned according to standard procedures. The aliquots were analyzed by ICP-mass spectrometry (MS). The results showed significant residual contamination still persisted in the pipettes despite a thorough manual cleaning procedure but was reduced when an automated washer was employed.
Finally, improper use can apply to the actual way in which the labware is to be used. If a volumetric is designed to contain liquid, it will be marked by either the letters TC or IN. Labware that is designated to deliver liquid would be marked by either the letters TD or EX. Sometimes, there are additional designations, such as wait time or delivery time, inscribed on the labware. The delivery time refers to a period of time required for the meniscus to flow from the upper volume mark to the lower volume mark. The wait time refers to the time needed for the meniscus to come to rest after the residual liquid has finished flowing down from the wall of the pipette or vessel. An analyst should wait for the liquid to stabilize before attempting to dispense for other dilutions.
The first dilution many laboratories make is a stock solution or starting solution. This type of working standard is made to create a higher concentration stock from raw materials or concentrated material from which other standards will be made.
For this calculation, one needs the concentration of the target stock, the final weight or volume of the total stock and the purity of the raw material (or concentration of the concentrate being used).

Another type of dilution is a simple dilution using a dilution factor as seen in the below equations:
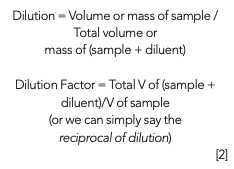
To make calibration curves, most people employ a mixture of simple dilutions separate from each other or use a serial dilution which is a series of dilutions, where each dilution is cumulative. Although this type of dilution is typical in some situations, if an error occurs during early dilutions, then subsequent dilutions can also be in error; therefore, bias could be created in the calibration curve. In preparing for a PT scheme, it is best to create a checklist of all the steps, equipment, supplies, and materials that could be needed for the testing. It is important to check equipment calibration and cleanliness before starting the PT (6,7).
Best Practices for Planning for Proficiency Testing
- Use only calibrated volumetrics to create dilutions and allow sufficient time for equilibration of the volumetrics as noted by the equipment.
- Check the quality of all volumetric labware and chemical materials to reduce contamination.
- Plan ahead for ordering standards, chemicals, and consumable supplies needed for the study.
- Check and recheck all calculations for calibration curves and dilutions.
- Check the study dates and plan ahead for sufficient time to complete the PT study.
- Make sure to order PT schemes well ahead of study start date to ensure enough time.
Final Thoughts
The function and reputation of a laboratory is based on producing accurate results that are above reproach and often can be legally defensible. A QMS dictates within its policies a set of checks and balances to provide validation that the results are valid. A part of this checks and balance system is the use of PT to document the ability of the laboratory and its employees to produce quality results. In some laboratories, such as in the case of a trace inorganic laboratory, routine issues, such as contamination and error, can severely alter results and cause bias. These biases can lead to erroneous results or PT failures. By recognizing all the possible sources of error and contamination in the inorganic laboratory environment, one can actively try to eliminate contamination and error, thereby producing more accurate results. Part 2 of this article, which will be published in the July “Atomic Perspectives” column, will examine the planning, running, and reporting of a PT scheme and the possible impact of error and contamination.
Further Reading
(1) International Organization for Standardization, Conformity Assessment – General Requirements for Proficiency (ISO/IEC Standard No. 17043) (2010) Retrieved from: https://www.iso.org/standard/29366.html
(2) International Organization for Standardization, General Requirements For the Competence of Testing and Calibration Laboratories (ISO/IEC: Standard No. 17025) (2017). Retrieved from: https://www.iso.org/publication/PUB100424.html.
(3) United States Pharmacopeial Convention, USP Proficiency Testing Program. www.usp.org/proficiency-testing (accessed April 2022).
(4) NSI Laboratory Solutions, Proficiency Testing. www.nsilabsolutions.com/proficiency-testing/ (accessed April 2022).
(5) SPEX, CertiPrep Webinar Clean Laboratory Techniques. https://www.spexcertiprep.com/webinar/clean-laboratory-techniques (accessed April 2022).
(6) American Society for Testing and Materials, ASTM D1193-06(2018), Standard Specification for Reagent Water. https://www.astm.org/d1193-06r18.html (accessed April 2022).
(7) Spex, Knowledge Base for White Papers on Dilutions, Calibrations, and Standards. www.spex.com/Knowledge-Base/AppNotesWhitepaper (accessed April 2022).
ABOUT THE CO-AUTHORS
Patricia Atkins is a Senior Applications Scientist with Spex, an Antylia Company who specializes in scientific content and education for the analytical community.

Lauren Stainback is the Global Product Manager for NSI Lab Solutions Inc. (a Spex/Antylia Scientific company), leading NSI’s product and business development efforts.

ABOUT THE COLUMN EDITOR
Robert Thomas, the editor of the “Atomic Perspectives” column, is the principal of Scientific Solutions, a consulting company that serves the educational and writing needs of the trace element analysis user community. Rob has worked in the field of atomic spectroscopy and mass spectrometry for more than 45 years, including 24 years for a manufacturer of atomic spectroscopic instrumentation. He has authored more than 100 scientific publications, including a 15-part tutorial series, “A Beginners Guide to ICP-MS.” In addition, he has authored five textbooks on the fundamentals and applications of ICP-MS. His most recent book, a paperback edition of Measuring Heavy Metal Contaminants in Cannabis and Hemp was published in December, 2021. Rob has an advanced degree in analytical chemistry from the University of Wales, UK, and is a Fellow of the Royal Society of Chemistry (FRSC) and a Chartered Chemist (CChem). Direct correspondence to SpectroscopyEdit@mmhgroup.com●


LIBS Illuminates the Hidden Health Risks of Indoor Welding and Soldering
April 23rd 2025A new dual-spectroscopy approach reveals real-time pollution threats in indoor workspaces. Chinese researchers have pioneered the use of laser-induced breakdown spectroscopy (LIBS) and aerosol mass spectrometry to uncover and monitor harmful heavy metal and dust emissions from soldering and welding in real-time. These complementary tools offer a fast, accurate means to evaluate air quality threats in industrial and indoor environments—where people spend most of their time.
Atomic Perspectives: Highlights from Recent Columns
March 3rd 2025“Atomic Perspectives,” provides tutorials and updates on new analytical atomic spectroscopy techniques in a broad range of applications, including environmental analysis, food and beverage analysis, and space exploration, to name a few. Here, we present a compilation of some of the most popular columns.