X-Ray Fluorescence and FT-IR Identification of Strontium and Carbonate in Domestic and Imported Gypsum Drywall
The authors discuss the use of XRF and FT-IR for identifying contaminants in drywall.
Earlier this decade, before the "Great Recession," of 2009 and the subsequent cautious recovery of 2010, the U.S. and, indeed, the global community experienced a dramatic housing boom. The U.S. housing market from 1997–2004 was up an average of 53% (1). The U.S. prime rate fell from 9% on January 4, 2001, to 4% by June 23, 2003, according to the Wall Street Journal (2). These factors, in turn, fueled an increase in construction. Such an increase in fact, that American drywall producers had difficulty keeping up with demand. Consequently, homebuilders turned to drywall imported from other sources, including China. From January 2006 to early 2009, approximately 550 million lb of drywall was imported from China alone. This figure represents enough material to construct 60,000 homes. At the same time, Gulf Coast states like Louisiana were renovating homes damaged by hurricanes Katrina (August 2005) and Rita (September 2005).
In 2008, homeowners in Florida began to suspect that the foul smell and corrosion issues affecting their homes were tied to drywall (3). Since then, state and federal agencies including the Florida Department of Health, the Consumer Product Safety Commission (CPSC), the Centers for Disease Control (CDC), and the Department of Housing and Urban Development (HUD) have been struggling to understand the scope of the issue as well as provide root-cause analysis. The CPSC released an update on this issue on May 25, 2010, stating it had received 3343 incident reports related to drywall from 37 states. The vast majority of these reports (93%) are concentrated in just five states: Florida (58%), Louisiana (20%), Mississippi (6%), Alabama (5%), and Virginia (4%). The CPSC update also describes a study done by the Lawrence Berkeley National Laboratory (LBNL) identifying the most prevalent volatile sulfur emissions (hydrogen sulfide, sulfur dioxide, and dimethyl sulfide) likely responsible for the deleterious health and corrosion effects (4). Supporting this claim is the evidence that the blackened material found on copper wires and coils in homes was identified as copper sulfide (5). Of the 20 samples from The LBNL study with measurable H2S emission levels ranging from 0.12 to 203 mg/m2/h, 15 were of Chinese manufacture while five were from North America (6). The top 10 emitting samples were all of Chinese origin.
Several pieces of the analytical puzzle regarding problem drywall have become clearer (chemical identification of the corrosion and the volatiles that cause it), and some remain unclear (the source of the sulfur in the mined gypsum and the chemical mechanism of volatile sulfur emission) but the most pressing challenge for analytical science is the ability to understand and rapidly detect key features of contaminated drywall before it is installed. Multiple methodologies have been used in the effort to determine the critical signatures of contaminated drywall including gas chromatography (GC)–chemiluminescence, X-ray diffraction (XRD), Fourier-transform infrared (FT-IR), DART mass spectrometry (MS), GC–MS, and X-ray fluorescence (XRF). Not all these techniques are, however, suited to rapid, remote analysis.
It has been reported that FT-IR spectroscopy can be used to identify contaminated drywall (7), the classification based upon the presence of an infrared spectral feature around 1450 cm-1. This peak is purported to be present only in Chinese drywall, not in wallboard manufactured in North America. Strontium also has been implicated in tainted gypsum wallboard. The current study identifies the most likely source of this key infrared spectroscopic feature as carbonate anion and suggests the molecular species responsible may be strontium carbonate, SrCO3. The use of handheld XRF and FT-IR analyses in tandem demonstrates the utility of these field-deployable techniques. In addition, we show that both Chinese and North American sources of drywall contain these spectral features although the known samples with the highest concentrations of carbonate and strontium are all of Chinese origin. Thermogravimetric (TGA)–IR shows that CO2 and H2O are the only major gases emitted at high temperature and confirms the presence of sulfur compounds in the gypsum wallboard by identifying SO2 as the sole minor gas component.
Experimental
Six samples of gypsum drywall originating either in North America or elsewhere were provided by an independent testing laboratory. Information on sample origin was not provided before the analysis was completed, so the samples were effectively run blind. One of the six samples (Sample F) was never positively identified as to origin. Three additional samples were acquired locally in Wisconsin.
A Nicolet iS10 FT-IR (Thermo Scientific, Madison, Wisconsin) spectrometer with a Smart iTR attenuated total reflection (ATR) accessory was used to obtain a spectrum from each sample in less than 1 min. A small amount of powder or a piece from the drywall was placed on the ATR crystal and the pressure applicator precisely pressed the powder against the crystal. Less than 100 mg of sample was required to obtain a high signal-to-noise spectrum. A comparison of spectra acquired at 4 cm-1 and 2 cm-1 resolution confirmed that the spectral features could be correctly analyzed at the lower resolution with enhanced sensitivity.
All XRF measurements were taken with a NITON XL3 handheld XRF analyzer (Thermo Scientific). The samples were measured through polyethylene bags with the powder collected in a corner to provide a thicker sample. The analyzer default calibration was used for quantification. The ratio of strontium to calcium was also investigated as it might lead to improved precision during repetitive sample analysis. Measurements between 10 and 20 s were used for the samples. For measurements of samples with lower levels of strontium the reported uncertainty was less than ±20 ppm.
TGA–IR measurements were taken on a Nicolet 6700 FT-IR spectrometer (Thermo Scientific) with a TGA sampling accessory connected to a TA Instruments Q5000IR thermogravimetric analyzer. Sample A (45 mg) was placed in the TGA and the temperature was ramped from 30 °C to 900 °C over 45 min while the sample was purged with dry nitrogen. The heated gas stream from the TGA was then guided to the FT-IR via heated transfer line and was passed through the TGA accessory on the FT-IR spectrometer. A spectrum was acquired every 20 s. TGA results are linked automatically to the FT-IR data via an OMNIC series file.
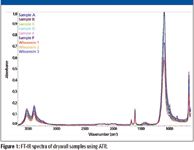
Figure 1
Results and Discussion
Figure 1 shows the FT-IR solid-phase ATR spectra of the six provided samples along with the three samples acquired locally. In an ATR experiment, the evanescent wave of the infrared energy interacts with a sample in contact with the ATR crystal. The light absorbed by the sample is directly related to the vibrations of the chemical bonds in the material. Different chemical bonds produce spectral features at specific locations in the infrared spectrum. The size of the peaks in the spectra corresponds to the amount of a particular species that is in contact with the analyzer crystal. The spectra from the ATR analyses have been normalized to the sulfate peak at 1104 cm-1. In peak normalization, all the sulfate peaks have been multiplied by a specific factor to make them equal the same absorbance value. This factor, now specific to each spectrum, is applied to all other peaks in that spectrum allowing the comparison of the carbonate peaks to one another as ratioed to the sulfate peaks.
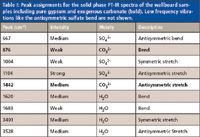
Table I: Peak assignments for the solid phase FT-IR spectra of the wallboard samples including pure gypsum and exogenous carbonate (bold). Low frequency vibrations like the antisymmetric sulfate bend are not shown.
Gypsum (calcium sulfate dihydrate) is the most common sulfate mineral and has the chemical formula CaSO4•2H2O. The infrared peak assignments for gypsum within the spectral window of the current experiment are known (8,9) and are listed in Table I. The most prominent feature in all the spectra is at 1104 cm-1 and is attributed to the antisymmetric stretch of the sulfate (SO42-) anion of gypsum. Small differences in the shape of this peak may be due to hydration or the presence of cations other than calcium. Slight variations in the hydrate peaks might also be due to the environment of the wallboard material.
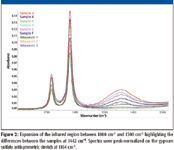
Figure 2
Two peaks in the IR spectra of the wallboard samples, 876 cm-1 and 1442 cm-1, are not found in pure gypsum. The 1442-cm-1 region for all nine samples is shown in close-up detail in Figure 2 alongside some of the hydrate resonances showing that not all the samples in the experiment contain this resonance. Comparisons of sample spectra to reference spectra from the RRUFF mineralogical database (10) strongly suggest that the chemical species responsible for the two unidentified peaks is carbonate, CO32-. These peaks are also assigned in Table I and highlighted. Mineralogical data naturally associates gypsum with calcite, CaCO3, a common carbonate-containing mineral making the spectroscopic connection between gypsum and carbonate significant (11).
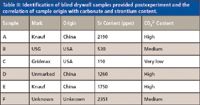
Table II: Identification of blind drywall samples provided postexperiment and the correlation of sample origin with carbonate and strontium content.
The frequency of the observed carbonate asymmetric stretch at 1442 cm-1 does not align with the calcite reference spectrum as one would expect if this were the source of the gypsum contamination. The best match for the carbonate stretch was strontianite, SrCO3. It has been observed that different cations affect the resonant frequencies of carbonate vibrational modes (12), allowing the consideration of strontium as the potential cation for carbonate in this case. The expanded spectrum in Figure 4 compares calcite and strontianite reference spectra to Sample A. The carbonate asymmetric stretch for Sample A is at 1442 cm-1 (bend is 876 cm-1), while the carbonate resonance from the strontianite is at 1438 cm-1 (bend is 856 cm-1) and calcite is centered at 1396 cm-1 (bend is 871 cm-1). The carbonate peak in the spectrum of Sample A is wider than the reference spectrum, which might be due to interactions with the CaSO4 major component. It is unclear why the strontianite reference provided a poorer match than calcite for the small, low-energy carbonate bend when it matched well with the more prominent high-energy stretch mode. The character of the vibration is, nonetheless, likely from a carbonate anion as many of these minerals have a known infrared signature (13) with the ν3 asymmetric stretch, the ν2 bend and the ν4 planar bend around, respectively, 1440 cm-1, 870 cm-1, and 710 cm-1.
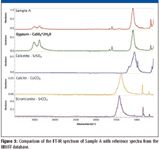
Figure 3
Table II shows that the three samples with the largest carbonate peaks are of Chinese origin while Sample F, although its origin was indeterminate, also contains a strong carbonate peak. Chinese samples were not, however, the only ones with carbonate peaks. Sample B, identified as a U.S. sample, showed a small carbonate peak at 1442 cm-1. The three wallboard samples obtained locally after the ban on Chinese wallboard was put in place (the assumption was that these were produced domestically) showed extremely low carbonate content similar to or lower than that found in Sample C (U.S.). These data strongly suggest that imported wallboard samples contain higher levels of carbonate than do samples from the U.S., as evidenced by matching resonant frequencies of all the wallboard samples with the carbonate stretches from the RRUFF standards as well as the known infrared behavior or carbonate minerals.
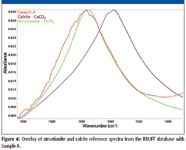
Figure 4
Handheld XRF analysis has proven a critical tool in applications such as lead in paint and children's toys, RoHS compliance and, more recently, as reported on June 4, 2010, by National Public Radio, cadmium in novelty drinking glasses (14). In addition to the previous applications, one of the clear values of handheld analytics is the ability to quickly and accurately analyze samples that are heavy or hard to move. Wallboard is a case-in-point for both the former and the latter.
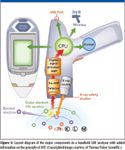
Figure 5
The principle of XRF starts with X-rays impinging on a sample wherein collisions between photons and inner-shell electrons result in electron ejection from the core levels. Higher-level electrons then fill the void and, in so doing, release energy in the form of another photon. This fluorescent X-ray photon is then measured by a detector and quantified. Each element in a sample produces characteristic X-rays in this fashion. XRF analyzers determine the chemistry of a sample by measuring the spectrum of the characteristic X-rays emitted by the different elements in the sample when it is illuminated by excitation X-rays emitted either from a miniaturized X-ray tube, or from a small, sealed capsule of radioactive material. Figure 5 shows the basic layout of an XRF analyzer.
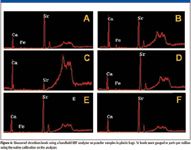
Figure 6
Strontium has been linked to contaminated drywall by the CPSC, U.S. EPA, and Unified Engineering, although its role in the mechanism of generation of volatile sulfur compounds is not clear. Table II shows the concentration of strontium for Samples A–F. As with the carbonate data, the XRF data shows that, in majority, the samples of Chinese origin had higher levels of Sr than did the samples from the U.S. Samples A, D, and E show the highest concentration of Sr for the known samples with, respectively, 2190 ppm, 1260 ppm and 1750 ppm. Sample F, although it has the highest concentration of Sr (2351 ppm) overall in addition to a significant carbonate peak, must be ignored as it was never definitively identified as coming from either the U.S. or elsewhere. Sample B was manufactured in the U.S. and has, in addition to a moderate carbonate ion concentration, an elevated level of strontium (530 ppm). XRF spectra for samples A–F are shown in Figure 6.
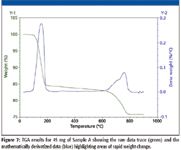
Figure 7
TGA–IR was run on Sample A to look for potential sulfur compounds as well as verify the presence of carbonates through high-temperature decomposition. Figure 7 shows the TGA results (raw data in green) over the 45 min run where the temperature was ramped from 30 °C to 900 °C. After it was mathematically derivatized (shown in blue), the TGA trace shows the time at which significant weight was lost from the sample as a peak instead of a long straight downward sloping line making it easier to identify and or quantify. The derivatized TGA trace shows only two major features, the first peak has an onset temperature of approximately 100 °C, which would correspond to water loss. This is logical as the known chemical formula for gypsum is that of a dihydrate. This is made definitive by the FT-IR gas phase analysis showing water as the sole component coming from the TGA at the maximum in the Gram–Schmidt plot centered around 6 min in Figure 8. Gram-Schmidt is a methodology for looking at the change in a dynamic FT-IR experiment over time where all succeeding spectra are gauged against either a background or an introductory period during the experiment where there is little spectral activity (15). It allows users to look at one set of temporal data and know exactly when the most activity occurred during a run. Clicking on this plot will show the concomitant FT-IR spectra, allowing for easy identification of the species coming through the FT-IR at any one point without needing a calibration. Centered at 20 min on the Gram–Schmidt plot, although not easily seen in the raw data of the TGA, is a long, broad feature that corresponds, spectrally, to the evolution of SO2. The spectrum is shown in Figure 9 stacked with an SO2 reference spectrum. Finally, centered at 34 min, is the second major feature identified by the spectral data as CO2. A follow-up solid-phase ATR spectrum taken on what remained of Sample A after the TGA-IR showed that the carbonate peak had disappeared, bolstering the theory that the peak at 1442 cm-1 was due to carbonate. The presence of SO2 also suggests that extraneous, sulfur-based compounds are associated with these gypsum samples and, in some capacity, are ultimately responsible for the volatile sulfur compounds affecting homes.
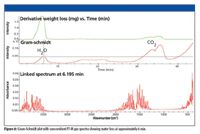
Figure 8
Conclusion
Together, FT-IR and XRF spectroscopies provide a rapid and reliable way to obtain valuable information about gypsum drywall. XRF confirms significant levels of strontium in imported wallboard as well as one sample made in the U.S. FT-IR analysis shows the peak at 1442 cm-1 is due to the presence of carbonate anion, perhaps from strontianite, and is observed at high concentrations in samples of imported drywall. However, this presence is also observed, albeit at a significantly lower level, in two samples of drywall produced in the U.S. TGA–IR detects three gaseous species during the 45-min run, H2O, CO2, and a small amount of SO2.
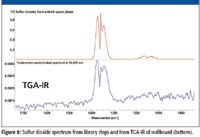
Figure 9
Jeffrey Hirsch is Chief Scientist, Molecular and Microanalysis, Steven R. Lowry is Senior Applications Scientist, and Mick Dowd is Product Specialist with Thermo Fisher Scientific, Madison, Wisconsin.
References
(1) S. Max, "Global Housing Boom" CNNMoney.com, 11 November 2004, Web.
(2) Prime Rate History. 2010. The Wall Street Journal, Web.
(3) A. Kessler, "Chinese Drywall" Sarasota Herald-Tribune, 1 February 2009, Web.
(4) Consumer Products Safety Commission Investigation of Imported Drywall - Status Update, May 2010, Web.
(5) Consumer Products Safety Commission Press Statement, 23 November 2009, Web.
(6) Consumer Products Safety Commission Notes for Draft Table of Reactive Sulfur Gas Emission, 27 May 2010, Web.
(7) "Suspect Chinese Drywall Analysis Fourier Transform Infrared Spectroscopy," www.assuredbio.com, Web.
(8) M. Haas and G.B.B.M. Sutherland, Proc. Roy. Soc. London 236, 427–445 (1956).
(9) H. Takahashi, I. Maehara, and N. Kaneko, Spectrochimica 39, 449–455 (1983).
(10) R.T. Downs, The RRUFF Project: an integrated study of the chemistry, crystallography, Raman and infrared spectroscopy of minerals. Program and Abstracts of the 19th General Meeting of the International Mineralogical Association, Kobe, Japan, (2006).
(11) The Handbook of Mineralogy series is a Five Volume set authored by John W. Anthony, Richard A. Bideaux, Kenneth W. Bladh, and Monte C. Nichols, and published by Mineral Data Publishing.
(12) H. Adler and P.F. Kerr, Amer. Minerol. 48, 124–137 (1963).
(13) H. Adler and P.F. Kerr, Amer. Minerol. 48, 124–137 (1963).
(14) S. Hensley, "McDonald's Recall Of Shrek Glasses Started With Tipster" National Public Radio, 4 June 2010. Web.
(15) R.C. Wiebolt and D.A. Hanna, Anal. Chem. 59, 1255–1259 (1987).
LIBS Illuminates the Hidden Health Risks of Indoor Welding and Soldering
April 23rd 2025A new dual-spectroscopy approach reveals real-time pollution threats in indoor workspaces. Chinese researchers have pioneered the use of laser-induced breakdown spectroscopy (LIBS) and aerosol mass spectrometry to uncover and monitor harmful heavy metal and dust emissions from soldering and welding in real-time. These complementary tools offer a fast, accurate means to evaluate air quality threats in industrial and indoor environments—where people spend most of their time.
NIR Spectroscopy Explored as Sustainable Approach to Detecting Bovine Mastitis
April 23rd 2025A new study published in Applied Food Research demonstrates that near-infrared spectroscopy (NIRS) can effectively detect subclinical bovine mastitis in milk, offering a fast, non-invasive method to guide targeted antibiotic treatment and support sustainable dairy practices.