2010 Salary Survey
This year brought some increases in salary, workload, and stress level for the spectroscopic community.
Downsizing and layoffs have affected nearly every facet of the American workforce during the last year, and the spectroscopy job market is no exception. Despite this, the spectroscopy field has seen some increases in salary, as well as workloads and stress levels.
This year, Spectroscopy's salary survey had 553 respondents, from a broad range of job sectors and locations. Here are a few statistics about this year's results:
- 28% of respondents are from the Midwest region; 27% are from the Northeast region; 21% are from the Southeast region; 21% are from the Southwest region; and 3% are from the Northwest.
- 20% of respondents are 50–54 in age; 14% are 40–44 in age; 14% are 45–49 in age; 12% are 55–59 in age; 11% are 35–39 in age; 10% are 60–64 in age; 7% are 30–34 in age; 6% are 25–29 in age; 5% are 65+ in age; and 1% are 20–24 in age.
- 73% of respondents are male and 27% are female.
- 43% of respondents hold doctoral degrees; 34% hold bachelor's degrees; 20% hold master's degrees; and 4% hold associate degrees.
- 62% of respondents received their highest degree in chemistry; 11% received it in biology; 8% received it biochemistry/biophysics; 8% received it in physics; 3% received it in environmental engineering/science; 2% received it in chemical engineering; 2% received it in geology/earth science; 2% received it in polymer science; and 2% received it in pharmaceutical science.
- 64% of respondents work in the private sector; 18% work in academia; 14% work in government/national lab; and 4 % work in other areas.
- 93% of respondents are employed full-time; 3% are postdoctoral researchers/graduate students; 2% are employed part-time; 1% are contract employees/ consultants; and 1% are unemployed.
- 20% of respondents are senior scientists/researchers/research fellows; 15% are chemists/spectroscopists; 14% are laboratory directors/managers; 10% are staff scientists/researchers/research fellows; 5% are full professors; 5% are laboratory technicians/technologists; 5% are analysts; 4% are research assistants/associates; 2% are assistant professors; 2% are associate professors; 2% are process engineers; 2% are technical directors; 1% are process chemists; 1% are CEO/presidents; and 12% are other.
Pay it Foward
According to this year's survey, the mean salary for all respondents is $80,778, which is an increase from last year's mean of $78,807 — an increase of $1971. This is also the largest salary we've seen over the last decade (see Table I).
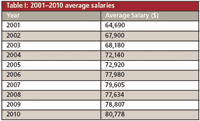
Table I: 2001â2010 average salaries
As seen in Table I (with the exception of 2008), salaries have risen continuously for spectroscopists by a few thousand dollars each year. The largest increase reported was in 2006, when the average salary rose by nearly $5000. When evaluating the data this way, it is not surprising that the salaries continued to rise despite the troubled economy.
Another factor playing into salaries again this year was respondents' level of experience in their respective fields. An estimated 40.9% of respondents had between 21 and 35 years of experience; 17.6% had between 10 and 15 years of experience; 11.8% had between 16 and 20 years of experience; 11.6% had less than 5 years of experience; 9.6% had between 5 and 9 years of experience; 5.3% had between 36 and 40 years of experience; and 3.3% had 41 or more years of experience. As with most industries, the more professional experience a person has, the higher their salary.
One Small Step for Womankind, One Giant Leap for Gender Equality
As in previous years, there is still a significant earnings gap between males and females. However, this year women have made small strides to close in on their male counterparts' salaries. According to the survey, composed of 73% males and 27% females, males are earning an average salary of $83,054 and females are earning an average salary of $69,356. While this is still a gap of $13,698, it is a significant improvement over 2009's gap of $15,578, 2008's gap of $16,000, and 2007's gap of $14,218 (see Figure 1).

Figure 1: Salary gap between males and females.
Working 9-to-5 (Job Sectors)
Spectroscopy covers a broad range of industries, but the three big players are academia, government, and the private sector. This year's survey was composed of 64% of respondents from the private sector; 18% from academia; 14% from government/national lab; and 4% from other areas. Private sector employees reported an average salary of $84,799, which is slightly less than last year's average. Respondents working in academia reported an average salary of $66,448, about a $4000 increase over last year's average. Finally, scientists working in government/national labs reported an average salary of $75,373—slightly smaller than last year's average but still higher than 2008's (see Figure 2).
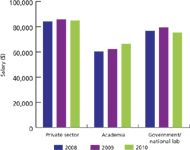
Figure 2: Salary summary by job sector, 2008â2010.
Don't Worry, Be Happy
While everyone loves a salary increase, it almost never comes for free and this year is no exception, as our respondents reported an increase in workload and stress level.
According to our survey, 62% of respondents had an increase in workload; 30% had their workload remain the same; and 7% had a decrease in workload (1% responded with not applicable). As possible causes for increased workload, most respondents said staffing cuts or an increase in business. Other reasons cited for increased workloads were new equipment additions to the lab, new handling techniques and procedures, and new regulations. Respondents who reported a decrease in workload cited automation through new equipment, increased staffing, and new technology that increased productivity and quality as the main causes, while continuing education, specialization of laboratory personnel, and improved workplace attitudes were also possible reasons.
Respondents also reported a 54% increase in stress level; 41% reported their stress level remained the same; and 5% reported a decrease in stress level (see Figure 3). The most common reasons chosen for increased stress level were business uncertainty, staff management uncertainty, and negative workplace attitudes. Those who reported a decrease in stress level cited improved workplace attitudes, increased staffing, and continuing education as the reasons.

Figure 3: Stress levels, 2009â2010.
Despite the increased workloads and stress levels, 38% of respondents reported feeling satisfied with their current position (down from last year's 42%); 33% felt very satisfied (down from last year's 47%); 14% were not satisfied (up from last year's 12%); 12% felt extremely satisfied; and only 3% were not at all satisfied (see Figure 4). Although this is good news for employers, compared to last year, the satisfaction levels have decreased and dissatisfaction has increased, which is not too surprising when looking at the entire picture.
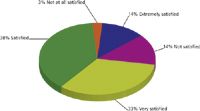
Figure 4: Job satisfaction levels, 2010.
In accordance with people feeling satisfied in their current positions, 39% of respondents reported feeling satisfied with their current employer; 28% reported feeling very satisfied; 17% reported feeling not satisfied; 12% reported feeling extremely satisfied; and 4% reported feeling not at all satisfied.
Regardless of individual levels of satisfaction, not many people are too keen on getting out there in this type of job market. According to our survey, 59% of respondents are not considering making a job change in the next year; 22% are not sure; and 19% are considering a job change. Of those respondents considering a job change, the main reasons are professional advancement, income, job environment, and intellectual challenge.
Professional advancement is an item on the top of most people's to-do lists, and knowing your next step is a key aspect of moving up. However, it's not always as clear-cut as it may seem, especially if people are looking to crossover into a new aspect of their job or a new field entirely. Our respondents offered us a mixture of answers on their professional goals with 41% reporting that they don't know or are not sure of their next career step; 20% said lab director/manager; 20% said retirement; 6% said company executive; 5% said consultant; 3% said full professor; 3% said assistant professor; and 2% said associate professor.
Another aspect of professional advancement is having a timeline for career goals. For example, it's unrealistic to go from laboratory technician to company executive within two years, but if you spread that out over a larger time frame and take career advancements in that direction, it becomes a much more realistic goal. According to our survey, 25% of respondents think it will take more than five years to take their next career step; 23% think it will take 1–2 years; 19% think it will take 2–3 years; 12% think it will take 4–5 years; 11% think it will take less than a year; and 10% think it will take 3–4 years.
Employers also play a major role in career advancement for their employees, with the opportunities they present. 45% of respondents reported that their companies are supportive of career advancement; 20% reported their companies are not supportive; 20% reported their companies as very supportive; 8% reported their companies as extremely supportive; and 7% reported their companies as not at all supportive. Compared to last year's results, it seems that companies are becoming more supportive of their employees career-advancement goals, with an increase from 44% of companies reported as supportive and a decrease from 25% of companies reported as not supportive or not at all supportive.
The fringe benefits a company offers to its employees also can have a positive impact on career goals and overall job satisfaction. According to the survey, 63% of respondents reported that their companies offered in-house training and 38% reported that their companies did not. Of those that did offer in-house training, tuition reimbursement, training courses, and seminars were the primary focus. Another benefit that companies often offer to employees is covering the cost of conferences and web seminars, and 77% of respondents reported their companies covering such projects, while 23% reported their companies do not cover them.
Overall, the relationship between employer and employee is a very complex dynamic, but the spectroscopy community seems to have a firm grasp on how to keep their companies running and employees satisfied.
From Coast to Coast and in the Middle
Spectroscopists from across the United States participated in this survey, and in the category of "Region by Salary," the Southwest was back on top with the highest average income this year, after a brief fall to second place in 2009 (see Figure 5). This year, the Southwest region reported an average salary of $94,496, a significant jump from last year's average of $79,111. The respondents' level of education might help explain the large salary jump since 44% have doctoral degrees, 19% have master's degrees, 33% have bachelor's degrees, and 4% have associate's degrees.
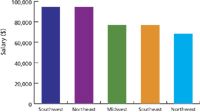
Figure 5: Salary summary by geographical region, 2010. (Southwest: CA, HI, AZ, NM, NV, CO, UT, OK, TX; Northeast: NY, MA, CT, PA, VT, NH, RI, ME, NJ; Midwest: OH, IN, IL, IA, MO, MI, MN, WI, KS, ND, SD, NE; Southeast: LA, MS, AL, GA, FL, TN, KY, NC, SC, AR, DE, VA, WV, MD, DC; Northwest: OR, WA, ID, MT, WY, AK.)
The Northeast has fallen from the top spot to a close second, with the region reporting an average salary of $94,473, a difference of a mere $23. This is nearly a $9000 increase from last year's average for this region, but again, education levels could help explain why. Respondents from this region reported 45% with doctoral degrees, 23% with master's degrees, 30% with bachelor's degrees, and 2% with associate's degrees.
In third place this year is the Midwest, with an average salary of $77,080, an increase of about $2600 from last year's average. Respondents in the Midwest also had high education levels with 40% holding doctoral degrees, 17% holding master's degrees, 39% holding bachelor's degrees, and 4% holding associate's degrees.

Figure 6: Level of education by geographical region, 2010.
Falling to fourth place this year is the Southeast, with an average salary of $77,021, a mere $59 short of third place. This is a slight decrease from last year's average ($77,094). Although this does not explain the decrease in salary, respondents reported education levels of 45% doctoral degrees, 21% master's degrees, 31% bachelor's degrees, and 3% associate's degrees.
Last, but not least, is the Northwest, with an average salary of $68,406. This region had the least amount of participants and saw the largest decrease in salary from previous surveys. In 2009, the average salary was $74,403, a difference of about $6000. This region also had a low percentage of participants with doctoral degrees (41%) and master's degrees (6%). The majority of respondents had bachelor's degrees (53%), which could explain the decrease in salary.
Methodology
The staff of Spectroscopy designed the 2010 Spectroscopy Salary Survey with the assistance of an outside vendor. A link for the online survey was sent to the entire circulation. The invitation was successfully sent to 24,465 subscribers. A total of 553 individuals responded. The field time of the survey was December 2 through December 15, 2009 (a reminder email was sent). To encourage participation, all subscribers who responded to the survey were entered into a drawing to win one of five $100 gift cards.
New Study Reveals Insights into Phenol’s Behavior in Ice
April 16th 2025A new study published in Spectrochimica Acta Part A by Dominik Heger and colleagues at Masaryk University reveals that phenol's photophysical properties change significantly when frozen, potentially enabling its breakdown by sunlight in icy environments.