Electron Transitions in Optical Emission and X-Ray Fluorescence Spectrometry
This article is a follow-up to an earlier "Atomic Perspectives" column on the spectral lines of hydrogen (1).

The origin of the characteristic spectral lines of the elements in the optical and X-ray regions of the electromagnetic (EM) spectrum is all about electron transitions. Excitation of outer-shell electrons to an excited state and their subsequent return to ground state results in electromagnetic radiation in the optical (ultraviolet–visible–infrared) region with wavelengths from about 100 to 1000 nm. Excitation of inner-shell electrons produces EM radiation in the X-ray region with wavelengths from about 0.01 to 10 nm.

Volker Thomsen
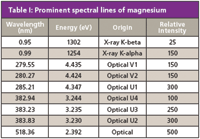
Figure 1 shows the two X-ray spectral lines and some prominent optical emission lines of magnesium (Z = 12). Note the logarithmic scale for wavelength. These spectral lines are listed by both wavelength and energy in Table I. Some relative spectral line intensities are also shown (2). The designation "U" for the optical emission lines refers to spectral lines of the neutral atom and "V" for the singly-ionized atom. The number that follows indicates the relative intensity with "1" generally being the strongest spectral line, depending upon the excitation condition.

Table I: Prominent spectral lines of magnesium
Some additional comments on Figure 1 and its associated table:
- The "U" and "V" nomenclatures are somewhat antiquated, included here solely to preserve the connection to the source, the MIT Wavelength Tables (2). Currently, spectral lines in the optical region are designated as follows: A capital "i" (I) for the neutral atom, II for the first ionized state, and so forth. For example, today we write Mg I 285.21 nm and Mg II 279.55 nm in referring to these spectral lines.
- Please note that the X-ray and optical relative intensities of Table I are on different scales (3).

Figure 1: Spectral lines of magnesium in the EM spectrum.
Electron Energy Levels
The electron energy levels of atoms are grouped together based upon the principal quantum number n. These groups differ from each other by about a factor of 10 in binding energy. Figure 2 shows a generic electron energy level diagram for the first three levels (n = 1, 2, 3) and the associated sublevels. The standard electron energy level designations are shown along the left side along with those used in X-ray fluorescence. On the right side are shown the associated quantum numbers: the principal quantum number "n," the orbital angular momentum quantum number, "l," and the magnetic quantum number "m." This diagram sets the stage for those to follow.

Figure 2: Generic energy level diagram.
Electron Energy Levels: X-ray
The electron energy transitions resulting in X-rays are easier to portray. The innermost electron shell is called the K-shell; the next farthest out from the nucleus is called the L-shell, followed by the M-shell, and so forth.
To produce the characteristic spectral lines in the X-ray region, the excitation energy (E) must be such that it is equal to or greater than the energy required to remove an electron from its shell, known as the "binding energy" (EB). That is, we must have:

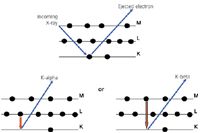
An outer shell electron will "drop down" to fill the void created in the inner shell and there is a certain probability that an X-ray characteristic of that atom will be emitted. This process is called X-ray fluorescence (XRF) and is shown in Figure 3 (4). The characteristic X-rays are called "K lines" if they result from an electron filling the innermost, or K-shell, and "L lines" if they result from filling the next electron shell out, the L-shell. Figure 4 shows an X-ray energy level diagram for magnesium.

Figure 3: X-ray fluorescence process.
Electron Energy Levels: Optical
In the optical emission spectroscopy (OES) process the electron transition is somewhat different. In this case, the excitation energy must provide the necessary energy for the following processes:
- Move an electron of the neutral atom from its ground state to an excited state or,
- Remove an electron from the atom (ionization) or,
- Excite an electron of the ion into an excited state of that ion.
Upon the return of the excited electron to lower energy levels, energy in the form of light is given off.

Figure 4: Energy level diagram for magnesium (X-ray).
Of course, equation 1 still holds true. Or does it? In the case of ionization, it certainly does. For the first and third processes noted earlier, a better formulation might be E ≥ Ee, where Ee is the appropriate excitation energy (atomic or ionic).
An electron energy level diagram for magnesium is presented in Figure 5. It shows the ground state of the neutral Mg atom, the first and second ionization potentials and several of the prominent spectral lines in the optical wavelength region.

Figure 5: Energy level diagram for magnesium (optical).
Discussion
Probably the first thing the reader will note in comparing Figures 4 and 5 is the vast difference in energy scales (y-axis). Note that the binding energy of the Mg K-shell electrons is about three orders of magnitude greater than the OES ionization–excitation energies.
In the XRF process the binding energy of the innermost electrons is the critical quantity as regards our subject here. Taking the example of the Mg atom, if the energy of the incoming excitation is insufficient to eject a K-shell electron, there are no characteristic X-rays produced.
Consider, for example, an 1100-eV photon impinging upon the Mg atom. Where does incoming energy go? The authors have never seen this question raised in traditional texts on X-ray fluorescence (5–7). Perhaps an L-shell electron is ejected, or an M-shell electron is ejected, producing optical transitions. Compton scattering and heat would seem to be other possibilities.
In the OES process, there are two quantities of interest: The first is the "excitation energy" to transit an outer shell electron to a short-lived (about 1 ns) "excited state." The "decay" of the electron in the "excited state" can take several paths, resulting in the emission of different spectral lines. The second is the ionization energy (or ionization potential). Only the ionization energy has a direct correlation with the binding energy of XRF as regards removing electrons from the atom.
Electron Energy Levels: Combined
There is no clear way to combine the two diagrams (Figures 4 and 5). However, let's just superimpose Figure 5 on top of Figure 4. The result is the very odd-looking Figure 6.

Figure 6: Energy level diagram for magnesium (combined OES and XRF).
Figure 6 is certainly problematic for several reasons, all of which relate to the y-axis:
- The mixing of log and linear energy scales on the y-axis is clearly unconventional from a mathematical point of view.
- To add insult to mathematical injury, the graph begins at +1300 eV, goes to zero and ends at about 25 eV. This is most irregular.
- In the OES process, the 3s2 energy level (M shell) is considered the zero level for the various excited levels and ionization of the atom (8,9). This is not a problem when restricted to the OES transitions. However, this is clearly not acceptable for the XRF energy diagram since it would mean that these electrons are not bound to the nucleus!
However, this is a tutorial intended to show the similarities between X-ray and optical emission electron transitions. As such, with proper explanation, this figure is perhaps of pedagogical interest despite the mathematical "irregularities."
Conclusions
The transition of electrons between their energy levels provides the basis for elemental spectrochemical analysis. Electrons are excited to higher energy levels or leave the atom (both possible in optical transitions, but only the latter in XRF). The same electron may return to a lower energy level (optical) or others may take up the vacancy (X-ray).
Carlos Augusto Coutinho, a retired Senior Researcher at Usiminas Steelworks R&D Analytical Division, is presently an ICP Application Chemist for SPECTRO SSA, Brazil. As a hobby, he enjoys reading subjects related to anthropology and playing the piano. E-mail: cacoutinho@task.com.br
Volker Thomsen, a physicist by training, has some 30 years of experience in elemental spectrochemical analysis (OES and XRF). He is currently a consultant in this area from his home in Atibaia, São Paulo, Brazil. His other interests include mineralogy and history of science. Occasionally, he still plays the blues harmonica. He can be reached at vbet1951@uol.com.br.
References
(1) V. Thomsen, Spectroscopy 23(11), 28–32 (2008).
(2) G.R. Harrison, MIT Wavelength Tables (MIT Press, Cambridge, Massachusetts, 1969).
(3) A. Thompson and D. Vaughan, Eds., X-Ray Data Booklet (Lawrence Berkeley National Laboratory, 2001). Online at http://xdb.lbl.gov/
(4) V. Thomsen and D. Schatzlein, Adv. Mat. Processes, 41–43 (August 2002).
(5) R. Tertian and F. Claisse, Principles of Quantitative X-Ray Fluorescence Analysis (Heyden, London, UK, 1982).
(6) E.P. Bertin, Introduction to X-Ray Spectrometric Analysis (Plenum Press, New York, 1978).
(7) R. Jenkins, X-Ray Fluorescence Spectrometry, 2d Ed. (John Wiley & Sons, Hoboken, New Jersey, 1999).
(8) NIST Basic Atomic Spectroscopy Data. Online at http://physics.nist.gov/PhysRefData/Handbook.htm.
(9) W.C. Martin and W.L. Wiese, Atomic Spectroscopy: A Compendium of Basic Ideas, Notation, Data, and Formulas. National Institute of Standards and Technology, 1999. Online at http:// physics.nist.gov/Pubs/AtSpec/

Applications of Micro X-Ray Fluorescence Spectroscopy in Food and Agricultural Products
January 25th 2025In recent years, advances in X-ray optics and detectors have enabled the commercialization of laboratory μXRF spectrometers with spot sizes of ~3 to 30 μm that are suitable for routine imaging of element localization, which was previously only available with scanning electron microscopy (SEM-EDS). This new technique opens a variety of new μXRF applications in the food and agricultural sciences, which have the potential to provide researchers with valuable data that can enhance food safety, improve product consistency, and refine our understanding of the mechanisms of elemental uptake and homeostasis in agricultural crops. This month’s column takes a more detailed look at some of those application areas.