2016 Salary Survey: Continuing the Squeeze
Spectroscopy
Analysis of Spectroscopy’s annual reader survey on salary, workload, and job satisfaction. The latest Spectroscopy salary survey shows that the average salary has dropped slightly, despite increasing workloads. But has this drop impacted job satisfaction?
The latest Spectroscopy salary survey shows that the average salary has dropped slightly, despite increasing workloads. But has this drop impacted job satisfaction?
Some years ago, spectroscopists’ salaries were on the rise. As the latest Spectroscopy salary survey shows, however, average salaries have dropped, the gender gap is standing its ground, and academia and government institutions are continuing to feel the squeeze of funding reductions. Only industry seems to feel some lessening of the burden of the global economic turmoil of recent years.
Of course, statistics mean nothing to the individual; what really matters is how you are doing. But the Spectroscopy salary survey can help you gauge your position in an ever-changing market. How do your salary and working conditions compare to those of your peers? Read on to find out.
Minor Drop in Salaries Overall
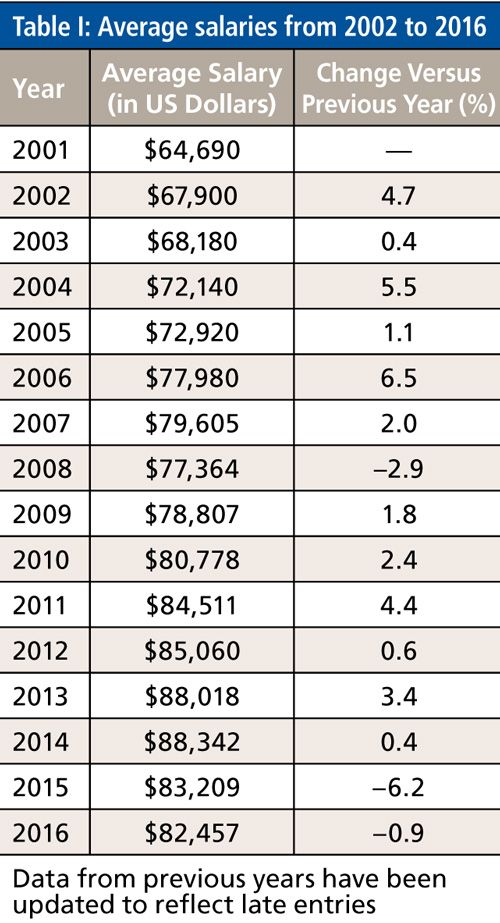
This year, our survey results show another reduction in the average salary for spectroscopists across the entire market. Still reeling from last year’s major reduction of -6.2% (Table I), the market has continued its downward pressure, with wages dropping a further notch (-0.9%).
Not all segments and groups took a hit, however (Table II). For example, industry salaries experienced an average increase of 4.2% to $89,488. This level still lags behind industry averages from 2013 and 2014, which were in the mid $90,000s. However, it may represent a slow recovery from the sharp decline in 2015 (-8.9%). In comparison, government salaries continue their downward trend with yet another decrease. Four years of decreases make for depressing reading and as the plight of research funding in the United States continues, the situation is not expected to improve any time soon (1).
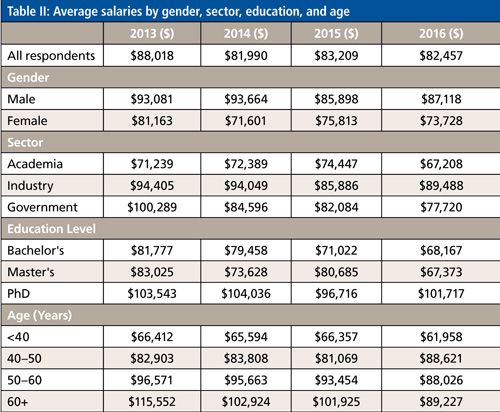
Education level and age once again are interesting factors. An evident trend is the year-on-year reductions for those who chose to stop their scientific education at the bachelor’s level, with average salaries for this group falling significantly from an average of $81,777 in 2013 to $68,167 in 2016 (-16.6%). If we put that into the context of inflation and real monetary value terms, it is a sizable reduction of disposable income felt by a large number of spectroscopists. Inconsistencies in data gathering make trends in master’s-educated spectroscopists difficult to assert, but it is unlikely they’re faring much better than bachelor’s-educated individuals. Average salaries for those with PhDs have increased compared to last year’s uncharacteristic slip below the $100,000 mark and point to stability in wages for those with that level of education.
In previous years, age has shown the trend you would expect: The older you are, the more experience you have gained, and the more you earn. However, 2016 sees a clustering of salary averages for those 40 and older. Reductions in salaries for those 60 and older have brought them in line with the 50–60 bracket, which has also seen a minor reduction in average salaries. On the other hand, the 40–50 bracket sees a definite increase, which may be a case of investing in the present by paying more for the work of experienced scientists in the 40–50 age bracket who need little to no instruction but still have many years of service ahead of them, as opposed to investing in the more distant future of the under 40 group, who may require more training. The latter group suffered a reduction in average wages this year following three years of stability.
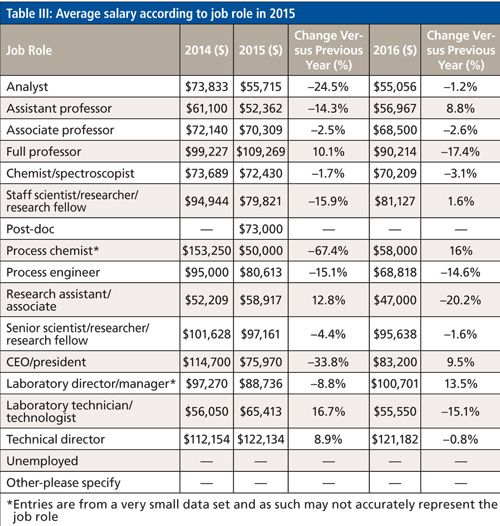
But what do average job salaries for specific roles (Table III) tell us about the current market? As expected from the market-wide figures, there are a lot of reductions in average salaries for specific roles this year, with only a few seeing increases. Laboratory directors and managers, CEOs and presidents, and process chemists have all seen increases, but the small data sets of these groups suggest that any overlying trend should perhaps be taken with grain of scepticism. Assistant professors are showing a salary increase (8.8%), but full professors show the second largest reduction, with a 17.4% reduction in average salary. This may well reflect the trend at universities to avoid replacing full professors who retire, which manifests itself as a reduction in wages for that job role. The largest salary reduction was suffered by research assistants and associates, who experienced a 20.2% drop.
The Stress, the Strain, and the Reasons for Staying
Once again, our survey reports that spectroscopists are working more, with the majority of respondents (66%) claiming to have experienced workload increases over the past year, compared to 30% who said workloads remained the same, and <5% saying they declined. Increased workloads are a consistent theme of our salary surveys, but with year-on-year cries of increased workloads, it is very likely that this says more about the status quo of businesses and institutions employing spectroscopists than it does about the state of individuals’ workloads. After all, if these were cumulative increases, many would have buckled from stress and exhaustion.
One piece of good news is that the biggest reason for increased workloads is increased business, though staffing cuts are still a factor (Figure 1).
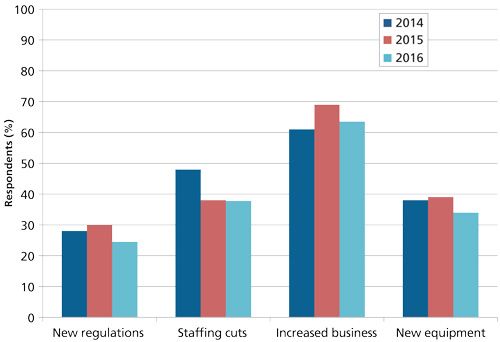
Figure 1: Reasons for respondents’ increased workload over the previous two years.
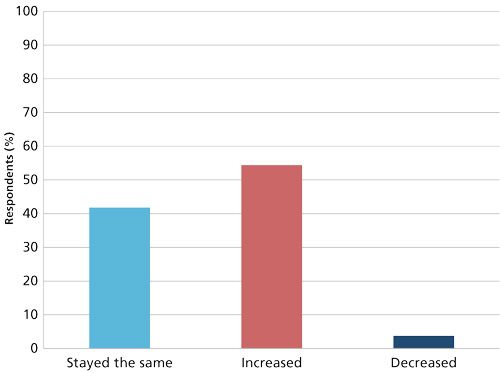
Figure 2: Respondents’ stress level compared to last year.
As would be expected, increased workloads come with higher levels of stress, with around half of respondents indicating their stress levels had increased. Despite increased workloads and increasing levels of stress, however, an overwhelming percentage of respondents-almost 74%-are satisfied with their jobs (Figure 3).

Figure 3: Percentage of respondents satisfied with their careers.
This satisfaction, in spite of increased workloads and stress, means that the vast majority (71.8%) have no plans to look for a new job within the coming year. The most popular reasons for staying put are the convenience of a work location (36.4%) and good colleagues (31.8%). A few are staying put because they fear that age discrimination will prevent them from getting hired for a new job, so they are remaining at their current jobs until retirement.
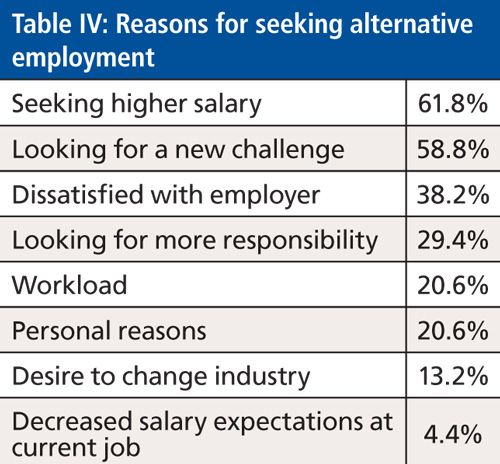
Those looking for new employment (28.2%) stated their desire for changes stemmed from seeking a higher salary (61.8%) and a new challenge (58.8%) as primary drivers. The full set of reasons for seeking a new job appears in Table IV.
Location Matters
Last year’s salary survey highlighted the regional variations that spectroscopists face in the United States. This obviously isn’t unique to spectroscopy, but it should be a factor in potential job hunters’ minds. A big geographic move may be risky or beneficial, as can be seen in Table V. And of course, variations in the cost of living must be considered too.
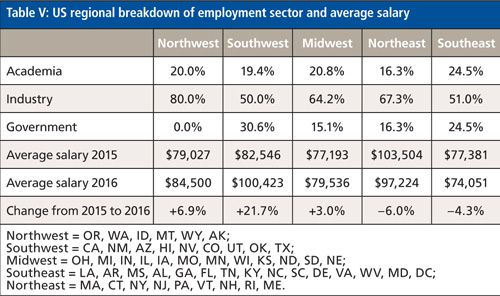
After two years of being in the top salary position (in 2014 and 2015), the Northeast has dropped to second place, behind the Southwest. Last year, the Northeast was able to hold on to its number one spot in spite of a 2.6% reduction in average salaries, but wages in this region dropped another 6.0% this year. That two-year consecutive dip for the Northeast occurred concurrently with a sizeable increase in average salary for the Southwest this year. The 21.7% increase for salaries in the Southwest represents a dramatic turn of fortunes; that region had previously seen several years of decreases.
The Northwest remains in third position despite a 6.9% increase in average salary (to $84,500), a slight slowdown from last year’s 8% rise but still another very good year for that region. The Southeast suffered its second consecutive fall with a 4.3% reduction to $74,051 (down from $77,381 in 2015). The Midwest saw a welcome increase, with average salaries up 3.0% to $79,536.
Outside the United States
Only 14% of respondents were from locations outside of the United States, primarily in Europe (Denmark, France, Germany, Spain, and the UK), but also from Australia, New Zealand, China, India, Japan, Ecuador, Columbia, and Puerto Rico. The average salary of European respondents was $57,435, but the data sets for other continents weren’t sufficient to reveal trends. Disparities between U.S. and European salaries result from factors such as cost of living and the variations in how health care and other core services are provided.
Self-Evident Inequality
Women continue to be paid significantly less than their male counterparts. To a certain extent the data from just one year isn’t the most important element to look at here. Women are consistently paid less regardless of employer type, education level, and whether or not they are management. The only anomaly showed up last year among master’s level spectroscopists: In 2015, male respondents in this group indicated an average salary of $80,471 compared to $81,468 in female respondents. A difference of 1.2% in one category in one year, however, doesn’t challenge the overall trend, which is clear and certainly doesn’t require in-depth analysis.

The smallest pay gap between the sexes can be seen in industry, where the average salary for men is $93,120 and for women $82,193, a difference of 12%. This compares favorably to academia, where the pay gap difference stands at 29%, and government, where the difference is 20%.
As for education level, the gap is smallest at the top, with women with PhDs earning an average of $98,236 compared to $103,051 for men. This 5% difference compares favorably with differences for those with a bachelor’s (14%) or master’s (14%) degree.
So for ambitious female spectroscopists who are looking for the sectors that are ironing out the pay gap the fastest, completing a PhD and finding a role in industry would likely result in the highest chance of getting closer to equal pay. This is an unfortunate reality of the current working world.
Career Advice
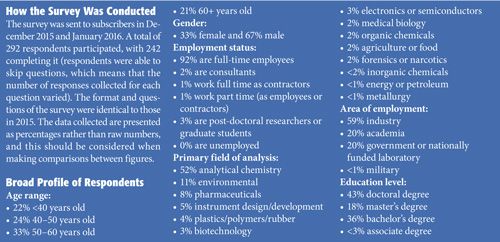
Despite the overall salary decreases, increased stress, and the uncertain employment markets, when we asked spectroscopists if they would recommend their career path to a recent graduate, 59% answered “yes.” Schadenfreude perhaps? Or is spectroscopy a satisfying career path as many indicated earlier (Figure 3)? Interestingly, 33% of respondents answered “maybe” showing at least some concern for the younger generation’s well being. About 8% said flat out they would not recommend their career to others.
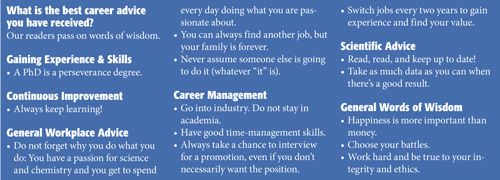
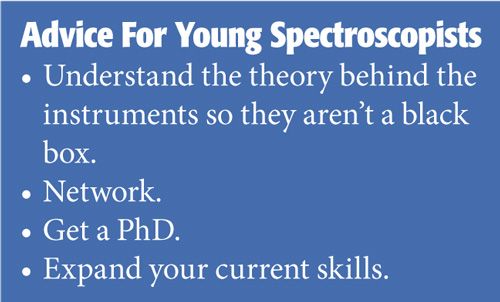
Despite such ambivalence about recommending the spectroscopy career path, respondents’ words of advice contain a lot of wisdom. The common tropes of “work hard” and “love what you do” aside, a selection of the best responses, as well as the best advice for young spectroscopists in particular, appear in the sidebars.
Conclusions
This year’s salary survey is a mixed bag. A small decrease in average salary overall hides some minor positives in the employment market including areas of the United States that have seen wage increases after many years of decline (the Southwest). Workload and stress continue to be considered too high, but job satisfaction remains relatively high. And the gender gap stands its ground, defiant in the face of social will.
The coming year will be an interesting one, particularly with major elections in the United States. Things could be a lot worse but they could also be a lot better. But one thing is for sure: Spectroscopists will persevere.
Reference
- A. Jahnke, “Who Picks up the Tab for Science,” (Boston University Research, Boston, Massachusetts, 2015). Available at: http://www.bu.edu/research/articles/funding-for-scientific-research/, (date accessed: 07/01/16).
Lewis Botcherby is an Associate Editor for LCGC Europe based in Ellesmere Port, UK. Direct correspondence to: lbotcherby@advanstar.com
New Study Reveals Insights into Phenol’s Behavior in Ice
April 16th 2025A new study published in Spectrochimica Acta Part A by Dominik Heger and colleagues at Masaryk University reveals that phenol's photophysical properties change significantly when frozen, potentially enabling its breakdown by sunlight in icy environments.
New Raman Spectroscopy Method Enhances Real-Time Monitoring Across Fermentation Processes
April 15th 2025Researchers at Delft University of Technology have developed a novel method using single compound spectra to enhance the transferability and accuracy of Raman spectroscopy models for real-time fermentation monitoring.
Karl Norris: A Pioneer in Optical Measurements and Near-Infrared Spectroscopy, Part I
April 15th 2025In this "Icons of Spectroscopy" column, executive editor Jerome Workman Jr. details how Karl H. Norris has impacted the analysis of food, agricultural products, and pharmaceuticals over six decades. His pioneering work in optical analysis methods including his development and refinement of near-infrared (NIR) spectroscopy has transformed analysis technology. This Part I article of a two-part series introduces Norris’ contributions to NIR.