Group Wavenumbers and an Introduction to the Spectroscopy of Benzene Rings
Spectroscopy
Continuing our theme of investigating the infrared spectra of hydrocarbons, we look at the nature of aromatic bonding and why aromatic rings have unique structures, bonding, and infrared spectra. Then we examine, in detail, the spectra of mono- and di-substituted benzene rings, and learn that infrared spectroscopy easily distinguishes between ortho-, meta-, and para- structural isomers.
The concept of group wavenumbers is defined, and the importance of recognizing patterns in infrared (IR) spectra is discussed. Continuing our theme of investigating the IR spectra of hydrocarbons, we look at the nature of aromatic bonding and why aromatic rings have unique structures, bonding, and IR spectra. The IR spectrum of benzene is analyzed in detail as a prototype example of an aromatic hydrocarbon.
A look at the spectrum of any pure molecule will disclose that many functional groups have multiple peaks. It is this pattern of peaks that defines the presence of a specific functional group in a sample, not one specific peak. Thus, interpreting spectra is not about memorizing peak positions, but is instead an exercise in pattern recognition. The human brain has evolved to be great at pattern recognition. Computers are good at many things except pattern recognition, hence the need to use our eyeballs and brains to interpret infrared (IR) spectra. A computer’s inability to interpret spectra is part of why there is a need for a column series like this one. Since humans are good pattern recognizers, I believe most people can learn to interpret IR spectra. My approach going forward will be to emphasize the pattern of peaks that defines the presence of a functional group in a sample rather than throwing hundreds of peak positions at you.
The peaks that define a functional group are what I will call its group wavenumbers. Some people call these “group frequencies,” but this is a misnomer. The x-axes of IR spectra are plotted in wavenumber, not frequency. A good group wavenumber peak has three useful properties:
- It will be intense so it is easy to see.
- It will appear in a unique wavenumber region where no other functional groups absorb.
- It will fall in a narrow wavenumber range regardless of what molecule the functional group appears in.
We have talked about group wavenumbers and peak patterns in previous articles without realizing it. For example, the methyl and methylene C-H stretches that were introduced previously (1). Now, we have given these peak patterns a proper name.
To be clear, not all of the peaks from a given functional group will be useful group wavenumbers. For example, a peak may be too weak to be seen reliably, may appear in a region where lots of other peaks appear, or move around a lot from molecule to molecule. Many of the upcoming columns will be devoted to the useful group wavenumbers of economically important functional groups.
One final thought: I compare interpreting IR spectra to playing a piano. You can’t just walk up to a Steinway and play a Beethoven sonata, you have to practice first. Similarly, you can’t just walk up to a spectrum and pull information out of it, you have to practice first. The purpose of these columns is to give you the knowledge you need to interpret spectra and the problem spectra give you the opportunity to practice what you have learned.
Introduction to Aromatic Molecules
To be able to interpret IR spectra, one must have a nodding familiarity with the nomenclature and structures of organic chemistry. In today’s world many people interpreting spectra do not have this background, so I have and will continue to discuss the structure and nomenclature of functional groups whose spectra we will discuss.
Aromatic molecules were originally named because some of them smell nice. However, if you have ever smelled pyridine you know that not all aromatic molecules do smell nice. It has been found that the bonding in aromatic molecules is unique.
The prototypical aromatic molecule is benzene, C6H6, whose structure is represented in Figure 1.
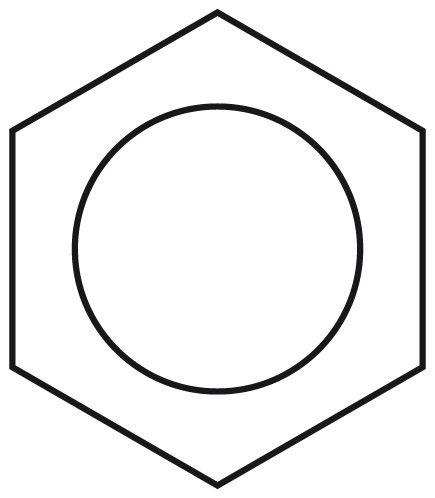
Figure 1: The chemical structure of the benzene molecule, C6H6.
The drawing in Figure 1 is that of a six-membered ring or hexagon. A carbon atom is located at each vertex of the hexagon and a hydrogen atom is attached to each carbon, although it is not written in. The circle inside the ring represents that the electrons are delocalized which is illustrated in Figure 2.
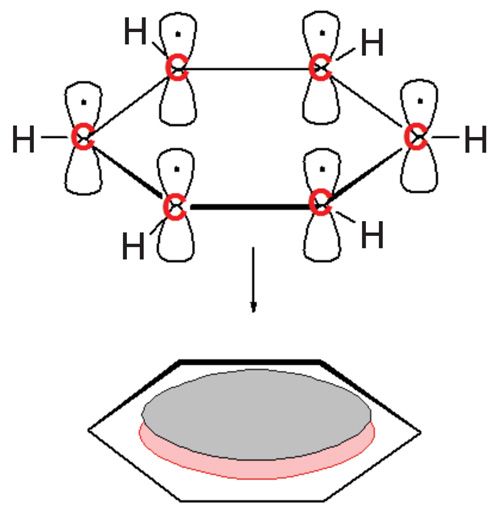
Figure 2: Top: The P orbitals on each of the six carbon atoms in benzene that contribute an electron to the ring. Bottom: the collection of delocalized P orbital electrons forming a cloud of electron density above and below the benzene ring.
Each of the carbon atoms in a benzene ring contains two P orbitals containing a lone electron, and one of these orbitals is perpendicular to the benzene ring as seen in the top of Figure 2. There is enough orbital overlap that these electrons, rather than being confined between two carbon atoms as might be expected, instead delocalize and form clouds of electron density above and below the plane of the ring. This type of bonding is called aromatic bonding (2), and a ring that has aromatic bonding is called an aromatic ring. It is aromatic bonding that gives aromatic rings their unique structures, chemistry, and IR spectra. Benzene is simply a commonly found aromatic ring. Other types of aromatic molecules include polycyclic aromatic hydrocarbons (PAHs), such as naphthalene, that contain two or more benzene rings that are fused (which means adjacent rings share two carbon atoms), and heterocyclic aromatic rings which are aromatic rings that contain a noncarbon atom such as nitrogen. Pyridine is an example of one of these. The interpretation of the IR spectra of these latter aromatic molecules will be discussed in future articles.
The IR Spectrum of Benzene
The IR spectrum of benzene is shown in Figure 3.
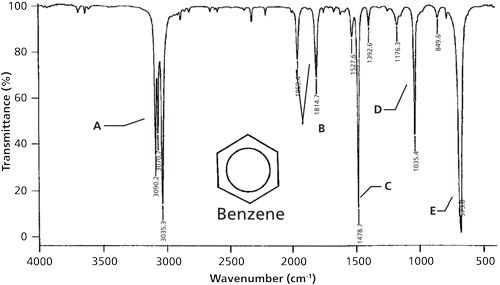
Figure 3: The IR spectrum of benzene, measured as a capillary thin film between two KBr windows.
As you read the spectrum of benzene from left to right, note there are three peaks between 3200 and 2800 cm-1, making these C-H stretches. However, these are higher in wavenumber than the CH2 and CH3 stretches we have discussed previously (1). Methyl and methylene groups are referred to as saturated carbons because they contain the maximum possible number of hydrogen atoms, that is, they are saturated with hydrogen. The carbons in aromatic rings are unsaturated, which means hydrogens can be added to these carbons via reaction. For example, benzene, C6H6, can be hydrogenated to form cyclohexane, C6H12, which is not an easy reaction to perform but has been done (3). As a result of being unsaturated carbons, the force constant for C-H stretching in aromatic rings is higher than for saturated carbons. As a result, in general unsaturated C-H stretches fall above 3000 cm-1, and saturated C-H stretches fall below 3000 cm-1. This is a useful dividing line to remember for your initial examination of a spectrum. First, look to see if there are any peaks between 3200 and 2800 cm-1. If there are, then these are C-H stretching peaks. Next, look at where the peaks are in this range. If there are peaks above 3000 cm-1 then the carbons in the sample are unsaturated only. If all of the C-H stretches are below 3000 cm-1 all the carbons in the sample are saturated. If there are C-H stretches above and below 3000 cm-1 there are saturated and unsaturated carbons present, which I call a “mixed” molecule. As stated previously, and as we will continue to see, every peak position range I give you will have exceptions. However, the 3000 cm-1 dividing line between the C-H stretches of unsaturated and saturated carbons has very few exceptions and is a very reliable rule of thumb. For aromatic rings, in general, the C-H stretches fall between 3100 and 3000 cm-1 as stated in Table I.
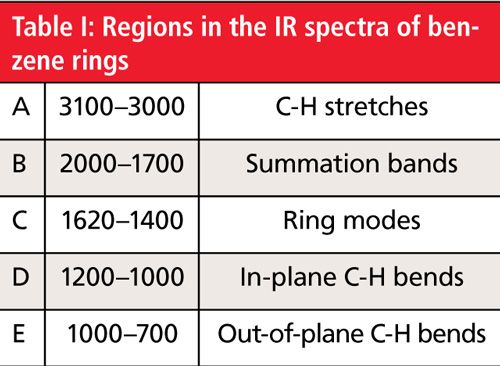
The area labeled B in Figure 3 refers to a region in aromatic ring spectra called the summation bands. More information on these peaks will come in a later column. The label C in Figure 3 at 1478 cm-1 is an example of a ring mode peak. A ring mode is a vibration that involves the stretching and contracting of the carbon-carbon bonds in an aromatic ring. These are typically sharp, but vary in number and intensity depending upon the molecule. They fall between 1620 and 1400 cm-1 as stated in Table I. The region labeled D in Figure 3 is where aromatic ring C-H in-plane bending peaks fall. These peaks are generally medium to weak in intensity, show up in a very busy spectral region, and hence are not useful group wavenumbers.
The most intense peak in Figure 3, labeled E, is an out-of-plane C-H bend. Since aromatic rings are planar, all the hydrogens are in the plane of the molecule. When these hydrogens bend above and below the plane of the molecule they are undergoing a C-H out-of-plane bend, which is sometimes called a wag because of the vibration’s resemblance to the wagging of a dog’s tail. This vibration gives rise to a large peak that typically falls between 1000 cm-1 and 700 cm-1. In the spectrum of benzene, this peak falls at 674 cm-1 because the molecule is unsubstituted.
Conclusion
To review then, the useful group wavenumbers for benzene rings are one or more C-H stretches between 3100 and 3000 cm-1, one or more sharp ring modes between 1620 and 1400 cm-1, and an intense ring bend from 1000 to 700 cm-1. Most of the time when a benzene ring is encountered it contains one or more substituents. The IR spectra of mono- and disubstituted benzene rings will be the topic of the next installment of this column.
References
- B.C. Smith, Spectroscopy 30(4), 18–23 (2015).
- B.C. Smith, Infrared Spectral Interpretation: A Systematic Approach (CRC Press, Boca Raton, Florida, 1995).
- R. Morrison and R. Boyd, Organic Chemistry, 7th Edition (Allyn and Bacon, New York, New York, 2003).
- B.C. Smith, Spectroscopy30(9), 40–45 (2015).

Brian C. Smith, PhD, is a Senior Infrared Product Specialist for PerkinElmer, based in San Jose, California. Before joining PerkinElmer, he ran his own FT-IR training and consulting business for more than 20 years, and taught thousands of people around the world how to improve their FT-IR analyses and interpret infrared spectra. Dr. Smith has written three books on infrared spectroscopy: Fundamentals of FTIR and Infrared Spectral Interpretation, both published by CRC Press, and Quantitative Spectroscopy: Theory and Practice published by Academic Press. He has published a number of papers in peer-reviewed journals and is a co-inventor on a patent for an FT-IR method to monitor dust exposure in coal mines.

AI Shakes Up Spectroscopy as New Tools Reveal the Secret Life of Molecules
April 14th 2025A leading-edge review led by researchers at Oak Ridge National Laboratory and MIT explores how artificial intelligence is revolutionizing the study of molecular vibrations and phonon dynamics. From infrared and Raman spectroscopy to neutron and X-ray scattering, AI is transforming how scientists interpret vibrational spectra and predict material behaviors.
Real-Time Battery Health Tracking Using Fiber-Optic Sensors
April 9th 2025A new study by researchers from Palo Alto Research Center (PARC, a Xerox Company) and LG Chem Power presents a novel method for real-time battery monitoring using embedded fiber-optic sensors. This approach enhances state-of-charge (SOC) and state-of-health (SOH) estimations, potentially improving the efficiency and lifespan of lithium-ion batteries in electric vehicles (xEVs).
New Study Provides Insights into Chiral Smectic Phases
March 31st 2025Researchers from the Institute of Nuclear Physics Polish Academy of Sciences have unveiled new insights into the molecular arrangement of the 7HH6 compound’s smectic phases using X-ray diffraction (XRD) and infrared (IR) spectroscopy.