2020 Salary Survey: What Are Today’s Career Trends?
The 2020 Spectroscopy salary and employment survey shows an increase in salaries from previous survey years. Salary, however, does not tell the whole story. We look at broader employment trends, including job satisfaction, workload, workplace bullying, the job market for spectroscopists, and more.
The 2020 Spectroscopy salary and employment survey extracted from calendar year 2019 trends shows an increase in salaries from previous survey years. Nearly three-fourths (72.3%) of respondents say that they are either highly satisfied or satisfied with their current career situation. At the same time, over two-thirds (68%) feel that their current job is meeting their career expectations.
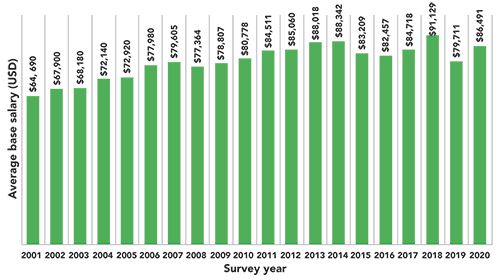
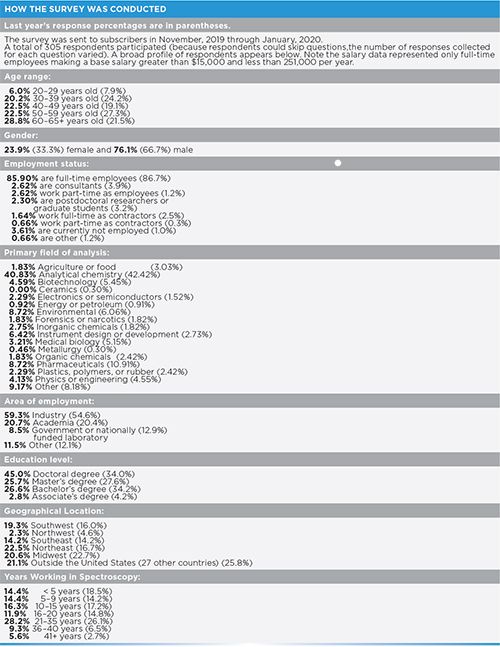
This year’s Spectroscopy salary survey results showed an 8.5% increase in average base salaries reported for all respondents compared to the 2019 survey numbers. A comparison of the survey sampling population differences from 2020 vs. 2019 indicates a slight increase in the average age of respondents this year (73.8% vs. 67.9% over 40), with more respondents from the Northeast of the United States (22.5% vs. 16.7%), more industrial respondents (59.3% vs. 54.6%), more doctoral participants (45.0% vs. 34.0%), and fewer female participants (23.9% vs. 33.3%). Based on the survey data history, and these factors, we would expect to see an increase in the average salary values reported this year. To highlight another variable that has a significant effect on average salaries, we note that last year 17.2% reported their job title as laboratory director or manager, whereas this year 17.0% reported a similar job title; therefore, basically there was no change in this factor. (See the box insert within this article to learn how the survey was conducted.) The salary trends over the history of this survey from 2001 to present are shown in Table I and Figure 1. These results represent all respondents with salaries greater than $15,000 and less than $251,000. For this year, there were 305 respondents (n = 305). For all respondents, the mean and median salaries were $86,490 and $72,000, respectively. For only U.S. respondents, the mean and median salaries were $111,312 and $100,000, respectively. One might also observe from the past five years (2016–2020) that last year’s reported salary decrease may be somewhat of an anomaly (Figure 1), although from this figure one can also observe an apparent decreasing average salary trend since 2014, with some small variations.
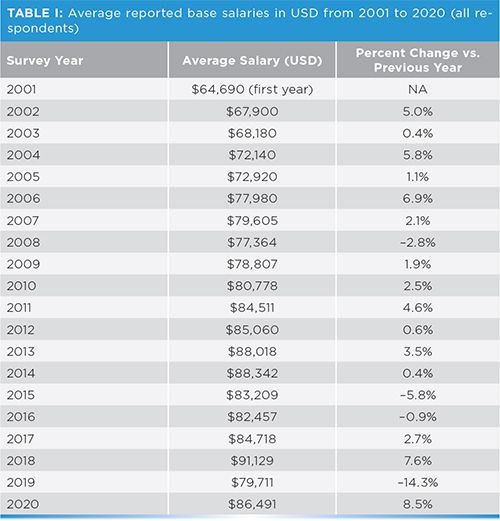
Figure 1: Bar chart showing the average reported base salaries for the 2001 to 2020 surveys.
Salary and Bonus Trends
Average Salaries by Gender, Sector, Education, and Age
As shown in Table II, the average male base salary of $104,602 is comparable to the 2018 survey, and the highest recorded over the past five years. We note this year’s survey includes more doctoral-level respondents (45% vs. 34% last year), and a gender difference (76.1% males vs. 66.7% for last year). Female salaries also followed an upward trend, with an average value of $78,988, representing the second highest survey results over the past five years. As for the reported gender gap in salaries, there is a clear and significant difference between male and female salaries; however, unless the variables of experience and education level are carefully factored, the raw differences are difficult to interpret precisely. That being said, the salaries for full-time male workers this past year averaged $104,453 compared to $78,988 for full-time female workers. This is a negative gap of 32.2%, which is statistically meaningful.
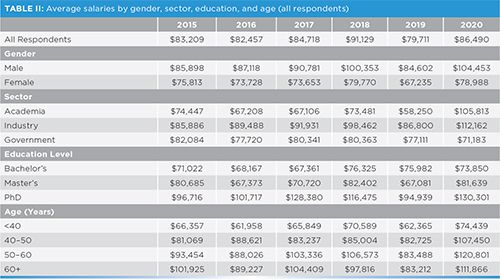
When comparing sector data, average reported survey base salaries increased in academia to an average of $105,813, indicating more senior-level respondents for this year’s survey. For the industrial sector, the average salary was $112,162, an increase over last year. Reported government salaries were slightly lower, with an average of $71,183, a decrease of $5928 over the 2019 survey.
Breaking the average salaries down by education level reveals a startling increase of 37% from last year for those who have completed a PhD. The current average of $130,301 is roughly equivalent to that of 2017. This year’s data also indicated that our sampling population with bachelor’s degrees had slightly lower average salaries than those at the master’s degree level, which is an expected trend. This salary difference between bachelor’s and master’s degree levels was also observed in the 2015, 2017, and 2018 surveys. Reported master’s level salaries increased from $67,081 to $81,639 in 2020 vs. 2019, a 21.8% increase. Note that the reported bachelor’s level salaries decreased from last year to this year by 2.9% (from $75,982 last year to $73,850 this year).
The 2020 survey data indicated that salaries have increased for all age groups compared to last year’s survey. The 60+ year age group had an average salary of $111,866, up from $83,212 reported last year; this was a 34.4% change. The 50–60 age group had the most dramatic change, increasing from $83,488 last year to $120,801 this year. The 40–50 age group averaged $107,450 this year, up substantially from last year’s value of $82,725. And the under 40 age group averaged $74,439 this year versus $62,365 in the 2019 survey; a change of 19.4%.
Average Regional Salary Differences in the United States
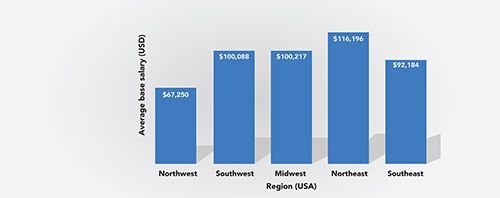
Table III and Figure 2 show the average base salaries for full-time workers in different geographical regions in the continental United States. The Northeast and Midwest regions had a marked increase in average salaries compared to last year. The Northeast had the largest uptick, from $92,295 to $116,196, an increase of 26%. Salaries in the Midwest grew 21%, from $83,172 to $100,217. Other sectors had slight increases in reported average salaries, with only one region (Northwest) reporting a decrease. The Northwest showed a decrease in average salary from $73,822 last year to $67,250 this year, a decrease of 9.8%. Overall, the Northeast exhibited the highest salaries followed by the Midwest, then the Southwest, Southeast, and Northwest.
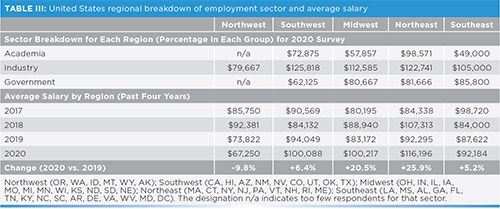
Figure 2: Bar chart showing the average base salaries by U.S. region for the 2020 survey.
A Closer Review of the Current Gender Gap
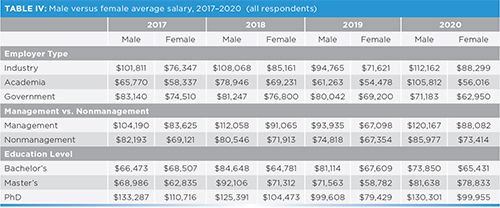
When we look at the ongoing gender pay gap (Table IV and Figure 3), we first note that most groups, irrespective of gender, reported an uptrend in salaries for this year versus last year. Those sectors showing a downtrend were for government and bachelor’s level workers. For males working in industry, the reported salaries increased from $94,765 last year to $112,162 this year, an 18% increase. For females working in the industrial sector, salaries increased from last year’s $71,621 to this year’s $88,299, a 23% increase. In academia, average salary changes from last year to this year were dramatically different for males, $61,263 to $105,812, indicating this year’s survey captured significantly more research fellows, directors, and full professor-level respondents. For females in academia, the reported salaries increased only slightly, from $54,478 to $56,016 (+3%). In government work, there was a reported decrease in average salaries from last year to this year, respectively; these were $80,042 to $71,183 for males, and $69,200 to $62,950 for females.
Figure 3: Salary gap between male vs. female workers over past five years (as percentage average salary difference), see Table II.
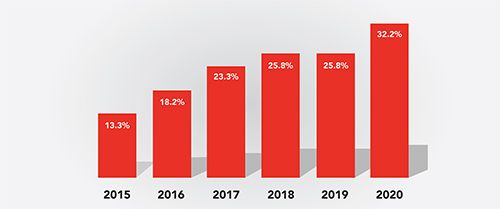
If we are to compare salary gaps over the past five years in dollars (Table II) and percentage (Figure 3) for all categories, we see that salary gaps between male and female worker’s salaries for all groups are significant, and remain that way. Even though there have been variations from year to year, the problem seems to be changing very little, and, if anything, the gap seems to be increasing, according to our multi-year survey data.
Bonuses, and Salary Increases
The average annual base salary for 2019 (2020 survey) for full-time workers was $86,491.
Just over half of our respondents (54.0%) received a bonus of some type, whereas 46.0% did not. For those who did receive bonuses, the average bonus was $19,977 for this survey ($12,026 last year) for U.S. full time workers, and $14,121 ($11,962 last year) for all full-time workers (U.S. plus international). For all workers, the lowest reported bonus was $50, while the highest bonus was $55,000. Note that the median bonuses for this survey were $13,000 for USA workers, and $11,000 for all workers (U.S. plus international).
Salary increases for this past year are shown in Table V. From the table we can see that ~15% of workers did not expect any increase, but 20% faced this reality; fully 5% of respondents that expected a raise did not receive one. From the table, one can see that 12.56% (7.17% + 1.35% + 4.04%) expected an increase of 5% or more, and 16.89% (5.78% + 5.33% + 5.78%) actually received this level of raise. Nearly 87% of respondents expected to receive less than a 4% increase, and 83% actually did receive a salary increase of 4% or less during the survey year; that is an accurate expectation (but not a great one)! We can see from the table that even though expectations for salary increases among respondents is not overly optimistic, even these low expectations were not met for most respondents. However, those expecting raises above 7% (5.39% of respondents) were pleasantly surprised, as over 11% of those surveyed did receive raises of 7% or above. From Table V, we can observe that over 11% (the sum of column 4) did not have their salary increase expectations met.

For most respondents (57%, an increase from 63% last year), salary increases were perceived to be based on organizational success, whereas 34% (31% last year) believe their salary increases were based on personal achievements (Figure 4). When asked if salary increases fairly reflected personal performance, 66.4% (64% last year) did not agree, and when asked if their annual salary increase keeps up with inflation, 63.6% (70% last year) said it did not. When asked if compensation received was competitive with salaries for similar positions in other organizations, 49.6% (54% last year) disagreed. When asked the ultimate question, if one would consider leaving a science career to make more money, only 36% (39.3% last year) said they would.
Figure 4: Breakdown of perceived basis (individual, team, or organizational success) for salary increases for 2019 (2020 survey).

Workload and Paid Time Off During 2019
Workload
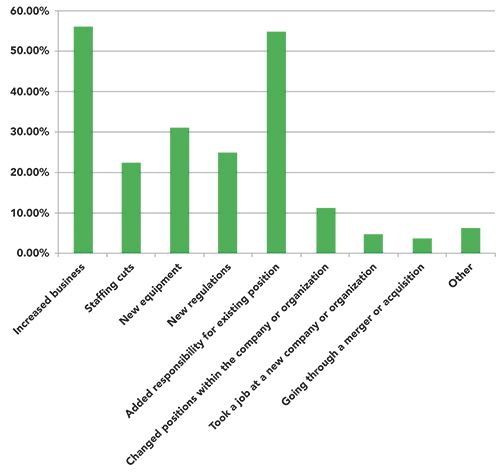
During this past year, 54.4% (56.0% last year) of respondents reported an increased workload, 38.4% (38.8% last year) said their workload stayed the same, and 5.7% (4.6% last year) reported a decrease in workload. The perceived reasons for increased workload during this past year are shown in Figure 5. Increased business and added responsibility for an existing position were the main causes for workload increases over the past two surveys. New equipment, new regulations, and staffing cuts comprised the next set of factors (very similar to last year). From Table VI, we see that although only 26.23% (22.05% + 4.18%) of respondents are contracted to work more than 40 or hours per week, 64.64% (46.77% +17.87%) actually worked more than 40 hours per week, and almost 18% admitted to working more than 50 hours per week on average. Last year, 26.78% were contracted to work more than 40 hours per week, and 58.47% actually worked more than 40 hours per week. These work numbers are as expected for technical professionals.
Figure 5: Percent of respondents indicating various perceived causes for their increased workload.

Paid Time Off (Vacation)
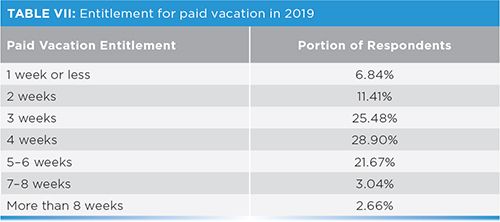
Allotted paid vacation for respondents during 2019 is shown in Table VII. We see from the table that for 2019, 27.37% (28.15% last year) of respondents are given five weeks or more of paid vacation, while 18.25% (26.23% last year) received two weeks or fewer of paid time off. We should consider that 47.41% (39.25% last year) of respondents have been with the same organization for 10 or more years, and 22.22% (18.0% last year) of the entire surveyed group have remained with the same organization for more than 20 years. Happily, well over half (56.27%) of respondents have four or more weeks of vacation. Last year, 51.1% of respondents had four or more weeks of vacation.
Job Satisfaction Intangibles
Career Fulfillment Factors
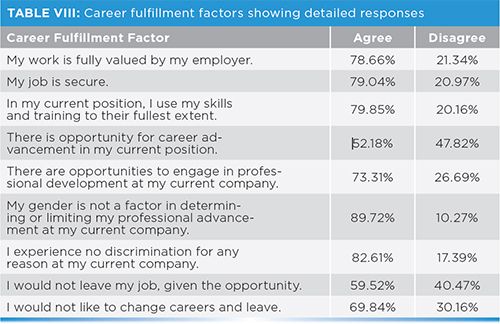
For this 2020 survey, 72% (65% last year) of respondents said they were either highly satisfied or satisfied with their current position, whereas 28% (35% last year) were either highly dissatisfied or somewhat dissatisfied. In another form of this question, 68% (60% last year) of respondents said their job met their career expectations, while 32% (40% last year) said it did not. The survey asked a number of detailed questions related to career fulfillment, and these responses are given in Table VIII. A full 78.7% (76% last year) felt that their work was valued by their employer, and 79% (83% last year) felt their job was secure. A remarkable 79.9% (75.7% last year) responded that they use their skills and training to its fullest extent in their current position. Overall, the career fulfillment responses for this year were extremely positive!
Bullying in the Workplace
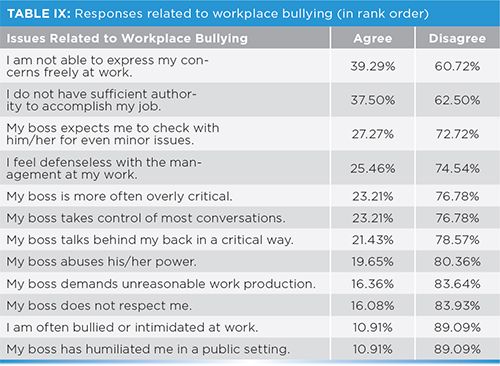
This year, the editors again decided to look more closely at an issue that has received little attention in the workplace until recently, but an issue that is known to cause serious work stress without much opportunity for workers to find relief: bullying. This year we again asked a number of workplace bullying related questions with some surprising results (Table IX). For this survey, 39.3% (47.7% last year) of respondents feel unable to express their concerns at work. A full 37.5% (47% last year) feel that they do not have sufficient authority to accomplish their jobs. A total of 11% feel bullied or intimidated at work, with 11% admitting they have been publicly humiliated by their boss (about the same percentages as last year). Note that work stress levels in 2019 were perceived to have increased for 40% of respondents as reported this year (48% last year), and 51% (45% last year) said that work stress remained unchanged; 9.1% (6.7% last year) stated that they had a decrease in work-related stress during 2019.
Job Choice and Satisfaction
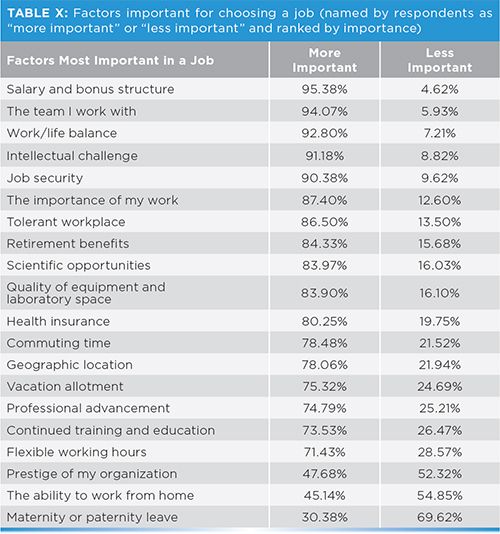
We also asked our respondents about the factors they consider most important to them when evaluating a job (Table X). The top-ranked factors were salary and bonus structure, the team they work with, and work/life balance (these were the same top three factors last year). Other factors, including intellectual challenge, job security, the importance of my work, and a tolerant workplace, also rated above 85%. The three least important factors reported were the prestige of the organization, the ability to work from home, and maternity or paternity leave (noting that 74% [67.9% last year] of our respondents are age 40 or over). For the younger group, the aspect of maternity or paternity leave would seem to be more important; only 26% of this year’s survey respondents were less than 40 years old.
Other Benefits and Job Fulfillment Issues
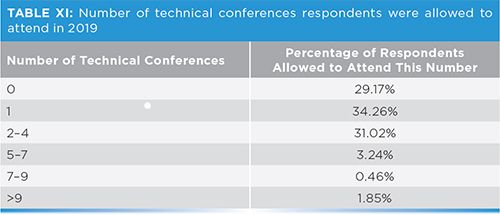
As in our survey last year, this year’s survey also asked about other work benefits, such as sponsored technical conference attendance, payment of professional dues, and provision for participation in inventions and patent work, as well as recognition of achievement by management. From Table XI, one can see that only 5.55% (5.16% last year) are permitted to attend five or more paid conferences, while 63.43% (66.06% last year) may attend none or just one sponsored conference per year. Those not permitted to attend any conferences last year were 29.2%. When asked if their organization pays their professional dues, only 46.3% (35.5% last year) answered yes. When asked if the organization allows workers to participate in inventions or patents, slightly under half 46.3% (49.4% last year) said they did. When asked if individuals or teams received special recognition from management during 2019, only 31% (29% last year) said they had, indicating that a large majority of 69% (71% last year) did not receive special recognition from their organization.
The Job Market and Job Prospects
How Easy is it to Find a New Position?
The job market for spectroscopy-related positions was also considered in this survey. From a series of questions, 23% (the same as last year) of respondents said competition was strong for such positions in their respective locations; 64% (50% last year) said it was moderate, and 13% (27% last year) said that the competition was weak, meaning a situation in which employers would have to compete for qualified workers.
To summarize perception of the job market strength, a series of questions was asked about the difficulty in finding a satisfactory position if one had to change jobs. 13% (12.3% last year) said it would be straightforward to find an equivalent position; 39.8% (40.2% last year) said it would take some time but it would be possible to find a comparable position, 24.7% (21.7% last year) said they could find another job but it probably wouldn’t be as good as their current position, and 23.01% (25.8% last year) said a search would be difficult and they would take whatever job they could find. Thus, just under half or 47.7% (47.5% last year) of respondents present a poor outlook for job opportunities.
To Be or Not to Be (in Management)?
Formal Academic Management Training
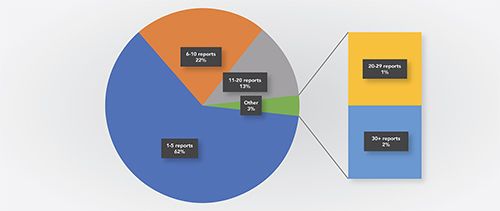
Precisely 50.0% (51.3% last year) of our respondents have a recognized management role at work, with 61.9% (63.9% last year) of those having 1–5 direct reports and 1.7% (5.4% last year) of managers having greater than 30 direct reports (Figure 6). For the total respondent population, 25% (20% last year) said they had formal academic credentials in business or management. Of those that have had formal business or management training, a series of questions was asked to determine the perceived value in taking additional time and expense to complete formal academic training in addition to their scientific or engineering training. The responses are given in Table XII. Those formally trained in business management are in strong agreement that this training has given them greater responsibility, a marked advantage in the workplace, that the time and money invested for training was worth it, and that this training has led to an increase in salary. We note here that, historically, the base salaries for managers has averaged much higher than for nonmanagers.
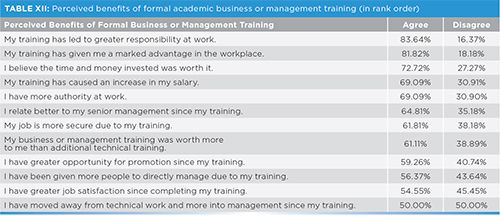
Figure 6: The percentage of managers with a specified number of direct reports.
Salary Advances in Management
As shown in Table IV, in 2020 there was a smaller base salary difference reported between management and nonmanagement positions for women, with the median salary for managers at $88,082 vs. $73,414 for nonmanagers. However, there was a significant difference reported for men, with median salaries of $120,167 and $85,977, respectively. Over the past four years, the average salaries for management versus nonmanagement, irrespective of gender or location, are $95,028 and $75,667, respectively. This trend represents a 25.6% base salary advantage for those in management positions, although, in this year’s data, women benefitted much less in this regard.
Summary and Conclusion
The 2020 Spectroscopy salary survey results showed an 8.5% increase in average base salaries compared to 2019. As in all surveys, the demographics of the survey respondents determine the results, and we noted specific demographic differences in this year’s respondent pool. There is still financial advantage for acquiring an advanced technical degree and even formal management or business training, as well as in taking a management position. The distinction between bachelor’s and master’s degrees is not so clear, but obtaining a PhD yields significant salary benefits, according to the data we have seen over the 20 years of this survey. For regional salaries reported in the United States, the Northeast exhibited the highest salaries, followed by the Midwest, then the Southwest, Southeast, and Northwest. Typically, the Northeast and Southeast regions of the United States have yielded the highest salaries. As in other professions, years of experience generally provide proportional increases in wages. Just over half of our respondents received bonuses of some amount. For those who did receive bonuses, the average bonus was $19,977 for U.S. full-time workers, and $14,121 for all full-time workers. Salary gaps by gender are significant and remain that way, and maybe even are increasing. Even though there have been variations from year to year, the gender gap seems to not be improving.
The survey indicated that one fifth of respondents did not receive a pay increase last year, and only one in nine received a raise of 7% or more. More than 80% received a salary increase of 4% or less. Most respondents believe that salary increases were based on organizational success, that salary increases did not fairly reflect personal performance, and that salary increases did not keep up with inflation. Well over half of those surveyed said their workload had increased, with respondents reporting that increased business within their organizations or added responsibility for an existing position were the main causes for this increase. Nearly two-thirds of the survey respondents work more than 40 hours per week, with one in six working more than 50 hours per week on average. Over half of respondents receive four or more weeks of vacation, while one in five respondents receive two weeks or less.
In spite of all this, nearly three-fourths of respondents say that they are either highly satisfied or satisfied with their current career situation. At the same time, over two-thirds feel that their current job is meeting their career expectations. Nearly four out of five respondents felt that their work was valued by their employer. Almost 80% of those that completed the survey felt their job was secure. One in ten expressed feelings of being bullied or intimidated at work, with one in ten admitting to having been publicly humiliated by a boss. Nearly half of respondents stated there was an increase in workload during this past year, and two in five reported increased work stress. The most important factors for any position were salary and bonus structure, “the team I work with,” and work and life balance.
Two thirds of responders are allowed to attend one (or more) technical conferences per year, while almost one third do not attend any conferences. Just one third have their professional dues paid, and just under half participate in invention or patent work. One in three was formally recognized for their work performance by their organizations last year. Just one in eight feel it would be straightforward to find another equivalent position, and nearly one in four said a search for a new position would be difficult and they would take whatever job they could find.
Half of our respondents have a formal management role in their current job function, with nearly two thirds of those having 1–5 direct reports and 1.7% of managers having more than 30 direct reports. We note that one in four of all respondents have formal academic credentials in business or management. Over the past four years, there has been an average base salary advantage of 25.6% for management vs. nonmanagement positions, irrespective of gender or location. However, the salary advantage is not reported to be as large for female managers as it is for male managers.
Jerome Workman, Jr. is the Senior Technical Editor of Spectroscopy. Direct correspondence to jworkman@mmhgroup.com
Trends in Infrared Spectroscopic Imaging
September 13th 2013An interview with Rohit Bhargava, winner of the 2013 Craver Award. This interview is part of the 2013 podcast series presented in collaboration with the Federation of Analytical Chemistry and Spectroscopy Societies (FACSS), in connection with SciX 2013, the federation?s North American conference.
Staying Updated with Spectroscopic Techniques: How Lead Investigators Adapt to a Changing Industry
June 6th 2024Spectroscopy is at the forefront of many changes happening across many industries. Here, three lead investigators comment on how they stay updated with the latest innovations and developments.
Advancing Agriculture for Future Generations: The Impact of Spectroscopy on an Important Field
February 1st 2024Welcome to our Advancing Agriculture for Future Generations content series! Begin your exploration by checking out a compilation of our articles that spotlight how spectroscopy is revolutionizing the agriculture industry.