Classification of Grassland Desertification in China Based on Vis-NIR UAV Hyperspectral Remote Sensing
High-precision statistics on desertification of grassland features are an important part of ecosystem research. In this study, a vis-NIR hyperspectral remote sensing system for unmanned aerial vehicles (UAVs) was used to analyze the type and presence of vegetation and soil of typical desertified grassland in Inner Mongolia using a deep belief network and 2D and 3D convolutional neural networks.
High-precision statistics on desertification of grassland features are an important part of grassland ecosystem research. The traditional manual survey is inefficient, and satellite remote sensing has very limited statistical precision, so high-spectral remote sensing by low-altitude drones is preferable. Here, we report a hyperspectral remote-sensing system for unmanned aerial vehicles (UAVs). We used the vegetation and soil of typical desertified grassland in Inner Mongolia as research objects to collect vis-NIR hyperspectral data on desertification using a deep belief network (DBN), 2D convolutional neural network (2D-CNN), and 3D convolutional neural network (3D-CNN). The results show that these typical deep learning models can effectively classify hyperspectral data on desertified grassland features. The highest classification accuracy was achieved by 3D-CNN, with an overall accuracy of 86.36%. This study enriches the spatial scale of remote sensing research on grassland desertification, and provides a basis for further high-precision statistics and inversion of remote sensing of grassland desertification.
The term desertification was first proposed by the French scientist A. Aubreville in 1949. At the 1977 United Nations conference on desertification, it was defined as the decline or destruction of the biological potential of land, eventually leading to degradation of ecosystems and promotion of desert landscapes. This definition has since been refined along with the deepening and advancement of research (1). Desertification is now recognized as one of the top ten environmental problems facing the world, having been responsible for substantial losses of biological productivity and ecological functions. At present, 1.5 billion people worldwide are directly threatened by desertification, and 12 million hectares of arable land are lost every year (2).
China is one of the countries most seriously affected by desertification. According to statistics in 2018, Inner Mongolia is its most affected region, with more than 60 million square hectometers (hm2) of desertified land, accounting for about three quarters of the national desertification area (3). In general, the type of landscape most vulnerable to desertification is the grassland ecosystem, due to its relative lack of animals and plants, and simple structure, and as a result, nearly 98% of desertified land in Inner Mongolia occurs in grassland ecosystems (4).
Desertification is one of the most important aggravators of the degradation of grassland, as well as its end point. The best indicators of this process are soil and vegetation communities, and these have been widely examined in the study of ecosystems in general. High-precision statistics are an important foundation of such research, particularly for investigation of grassland desertification (5). Traditional methods involving area sampling methods and empirical estimation ensure statistical accuracy, but are inefficient and consume excessive human and material resources (6–7). Due to the widespread distribution of desertified areas and their harsh climatic conditions, large-scale statistics on desertified grasslands are extremely difficult to obtain (8). One possible solution is to use aerospace remote-sensing technology. After obtaining pictures of the earth’s land, sea, and cloud cover through artificial satellites for the first time in 1959, this technology has developed at a high rate. The optical sensors carried by satellites, airplanes, airships, and other spacecraft can process not only visible light, but also infrared, microwaves, and the entire band of radio waves including gamma rays (9–10) Today, aerospace remote-sensing technology is widely used in meteorology (11), and for resource, environmental, and natural disaster monitoring (12,13). In the field of agriculture and animal husbandry, the current focus is on dynamic monitoring of pests, and estimated yields of crops covering large land areas, including wheat (14), corn (15), cotton (16), and rice (17). However, because the imaging quality of aerospace remote-sensing technology is limited by the weather, long revisit period, and low spatial resolution, there are few reports on the small and broken features of desertified grassland.
An alternative to aerospace monitoring that takes advantage of available sensor technology is the use of drones. The rapid development of UAVs has provided a low-altitude remote-sensing platform with great convenience and low cost. In conjunction with advancing sensor technology, including digital cameras and multi-spectral sensors, UAVs form an effective low-altitude remote sensing platform. Such platforms have found applications in ecology, for example in the identification of forest species (18), and grassland shrubs (19). More recently, the emergence of hyperspectral imaging has provided a richer band, enabling greater resolution due to a lower minimum wavelength interval (1-10 nm), and a much greater ability to classify small and similar features. Scholars have used UAV hyperspectral remote-sensing platforms to study phenomena that were previously difficult to access on a large scale, including inversion of winter wheat leaf surface index (20), soybean growth status (21), and fruit tree pests and diseases (22), among others. This has not only enriched the spatial scale of remote sensing, but also improved the accuracy of statistical and inversion analysis.
A low-altitude UAV hyperspectral remote-sensing platform satisfies the high spatial resolution requirements for the statistical analysis of small and broken ground objects in desertified grasslands, and has the advantages of low cost and high flexibility. It is a high-precision method for estimation of grassland desertification, and the best available choice from the perspective of statistical analysis. This article describes the use of a low-altitude UAV hyperspectral remote-sensing platform to collect remote-sensing images of desert grassland. After preprocessing, we used three classical deep-learning models to map vegetation, soil, and other features in the hyperspectral images captured by the drone. Ground marking points, garbage, and other debris were also classified. We aimed to achieve fine classification of grassland desertification, providing a basis for high-precision statistics and inversion.
Experimental Construction of UAV Hyperspectral Remote Sensing System
The UAV hyperspectral remote sensing system is principally composed of an eight-rotor UAV, a hyperspectral imager, pan-tilt, an irradiation sensor, an inertial navigation system, an on-board computer, and other useful instruments (Figure 1).
Figure 1: UAV hyperspectral remote sensing system.
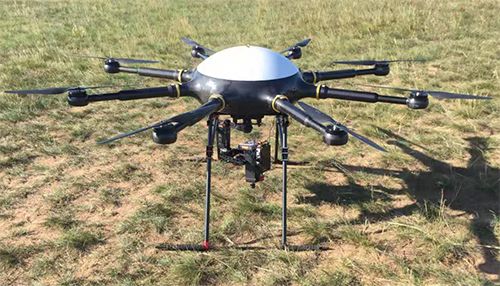
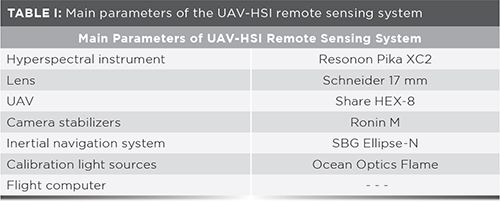
The hyperspectral instrument we used is a Pika XC2 hyperspectral camera (Resonon). Its vis-NIR spectral range is 400-1000 nm, with a spectral resolution of 1.3 nm. The number of spectral channels it uses is 447 bands, and the number of spatial channels it uses is 1600 bands. We selected a Schneider 17 mm lens and a linear sweep scanning mode. The field of view was 30.8°. The calibration light source has a signal-to-noise ratio of 250:1 and a dark noise of 50 RMS counts (Ocean Optics). The UAV we used is a HEX-8 UAV (Jinan Saier). It has a maximum diameter of 1480 mm, a maximum takeoff weight of 40 kg, and full-flight duration of 25 min. For camera stabilization we used a RONIN-M gimbal (Shenzhen Dajiang Technology Co.). It has an angular jitter of ± 0.02°, and a maximum load weight of 3.6 kg. Its integral navigation system is an ellipse miniature inertial sensor (SBG Systems). It contains a global navigation satellite system (GNSS) receiver with pitch and roll direction accuracy of ±0.2°, and heading accuracy of ±0.5°. The flight computer is mainly composed of i7-7260U, Inter PLusx64, and 520 GB solid state drive (SSD). The main equipment is shown in Table I.
Overview of the Study Area
The experimental area is located in the Guggen Tara Grassland (41°75’45”N, 111°86’46”E) in the northern part of Siziwang Banner, Wulanchabu City, Mongolia Autonomous Region, China. It is 1456 meters above sea level, and is considered typical desertified grassland. Its weather can be harsh, and is characterized by a hot summer and lack of rain, with high winds in spring. The annual precipitation is 120–350 mm, and the soil type is light chestnut soil. The surface wind erosion is severe, and denudation is strong. The vegetation community is simple in structure, and low in biodiversity. The dominant species are Artemisia frigida and Cleistogenes mutica. Stipa breviflora is also an established species. The main associated species are Neopal-lasia pectinata, Allium tanuissmum, Salsolacollina, and other dry and medium type weeds. These plants are typically small, and randomly distributed with an average height less than 8 cm (23–24).
Data Collection
In view of the characteristics of the grassland climate in 2018 and the growth cycle of grass, we gathered data between August 20 and August 25, 2018. This is the fruiting period and the yellowing stage of grass. To ensure an appropriate solar elevation angle, we collected hyperspectral data between 10:00 and 14:00; the wind speed is typically lower than the third level (≤ 5.4 M/s), and we sampled when less than two clouds were visible.
The data collection area of this experiment was 2.5 hm2. The collected objects include desertified grassland vegetation, soil, and other features (such as ground marking points and garbage, for example). The flying height of the drone is 30 m. The effective spectral channel number of the XC2 hyperspectral instrument is 447 bands. Considering the comprehensive image acquisition efficiency, and spatial resolution, the number of acquired spectral channels was 231, a single image was 3640 lines x 1600 samples, and the side overlap was set to 55%, after calculation. The spatial resolution of the image was 2.1 cm. The flight speed of the drone was 1 m/s, and the total length of the route was 52 min. Considering the endurance time of the aircraft, the collection was divided into three sorties of 20 min, 20 min, and 12 min. Since the amount of light changes with the movement of cloud during the acquisition time, a standard reference whiteboard calibration was performed before and after each take-off, and the test area was repeatedly covered three times. The data for imaging was manually selected in the preprocessing analysis.
Data Preprocessing
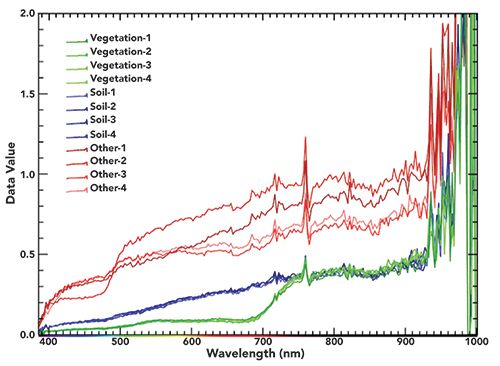
First, the remote-sensing images with poor imaging results (due to light quantity changes and wind gusts) were removed by manual inspection, and a set of remote sensing images with the best imaging quality were selected. Then, Spectral Pro software was used to correct emissivity and identify true reflectance values and features of interest. The four spectra (spectral curves) of vegetation, soil, and three other types of ground objects were randomly selected, as shown in Figure 2.
Figure 2: Spectra shown of ground objects.
Results and Discussion
Band Selection
The hyperspectral image collected in this experiment has 231 bands with a spectral resolution of 2.59 nm, and a spatial resolution of 2.1 cm/pixel. The radiant-corrected single image occupies a storage space of approximately 4.5 GB, including rich spectral information on ground objects, enabling high-precision object classification. As can be seen in Figure 2, some bands have smaller differences and higher similarity. Noise interfered with obvious bands in many cases, and the amount of information lost with noise-reduction is small, while retaining complete spectral space information and achieving the purpose of data dimensionality reduction. In this paper, we used the classical Frobenius norm2 (25), as shown in equation 1. By storing and comparing 120 bands, the storage space of a single image after dimension reduction falls to about 2.4 GB, which effectively increases the efficiency of post-data processing.

[1]
Classification of Features
The classification of remote-sensing image information gradually evolved from manual visual extraction methods to semi-automatic and automatic processes. The traditional manual method of visualizing remote-sensing information relies heavily on the experience and discriminating power of the analyst, and is both labor-intensive and error-prone. In the past 20 years, with continuous exploration by scholars and the rapid development of computer hardware, more and more semi-automatic and automated classification methods represented by deep learning have been applied in the field of remote sensing (26). Deep learning mainly focuses on the analysis of spectral characteristics of remote-sensing images. With the improvement of sensor dimensions and precision, and the success of deep learning in the field of video analysis, multi-dimensional utilization of joint spectral-spatial information from deep learning methods was introduced into remote-sensing data analysis (27).
In this paper, the F-norm2 was used to reduce noise interference and reduce the dimensionality of the hyperspectral data. Based on this, three typical deep learning models were employed, for example, the DBN, 2D-CNN, and 3D-CNN were used. These three-depth learning models are similar to those used by Ying Li (28) to process the high-spectrum data of the 120 bands retained for analysis after dimensional reduction by Frobenius norm2. To improve processing speed, our procedure involved taking one picture and cutting it into 10 small pictures. The size of each of these was 364 lines x 160 samples x 120 bands, for a total of 58240 pixels. For identifying features, 40% of the labeled samples were randomly selected as training data and the rest as test data to match the colors of vegetation, soil, and other features. The quantities are shown in Table II.

Classification Results
The classification accuracy and overall accuracy of the three deep-learning models DBN, 2D-CNN, and 3D-CNN are shown in Table III. The accuracy value in the table is the average obtained from five replicate operations of the model.

It can be seen from Table III that the classification performance of the DBN model for vegetation was 84.34%, but its performance classifying small objects (other features) was poor. Overall, its accuracy was 82.18%. The classification performance of 2D-CNN for soil was 85.03%, but it was also less efficient at classifying other features, and had an overall accuracy of 83.42%. The best-performing model for all three categories was 3D-CNN, with an overall accuracy of 86.36%. This clearly demonstrates its potential to classify hyperspectral features. The classification results obtained by the three deep learning models are depicted in Figure 3.
Figure 3: Images shown for (a) Ground truth; (b) DBN; (c) 2D-CNN; and (d) 3D-CNN. The x- and y-axes are X- and Y- spatial dimensions.
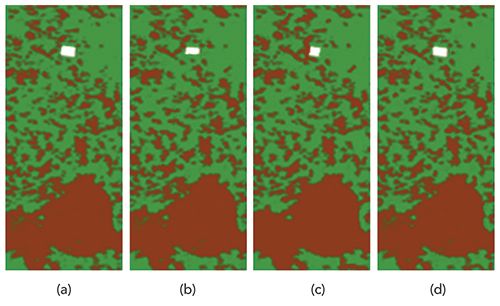
The superior performance of 3D-CNN is presumably due to the fact that the hyperspectral image is a three-dimensional cube composed of lines, samples, and bands. DBN and 2D-CNN deep learning models using one-dimensional linear or two-dimensional planes as “processors” will inevitably lose certain spectral space information. Therefore, a 3D-CNN model with a 3D cube “processor” has more potential for high-precision classification and statistical analysis of desertified grassland features.
Conclusion
As can be seen from Figure 3, the hyperspectral data on grassland desertification collected by our UAV hyperspectral remote-sensing platform has achieved impressive classification results using DBN, 2D-CNN, and 3D-CNN. However, this conclusion has some caveats. Firstly, the DBN model has a clear tendency to subdivide small sample objects (other features) into vegetation, and has poor ability to classify scattered soil-like features. Secondly, 2D-CNN has a problem with misclassifying small sample objects (other features) as soil, and also with misclassifying scattered vegetation as soil. Thirdly, 3D-CNN showed the highest accuracy overall, it performed best for small sample features (other features) and fragmentation. Further exploration and optimization is needed to improve classification and statistical accuracy.
We can also draw the following conclusions about optimal data collection conditions. The low-altitude UAV hyperspectral remote sensing platform constructed in this experiment has a maximum spatial resolution of 1.3 cm/pixels. For optimal efficiency of data collection, the experimental drone should have a flying height of 30 m, a flying speed of 1 m/s, and a hyperspectral data spatial resolution of 2.1 cm/pixel. Under these conditions, 2.5 hm2 of desert grassland could be covered in 52 min.
Overall, this study enriches the spatial scale of remote-sensing research on grassland desertification. It provides a material basis for enhanced high-precision classification and statistics on grassland desertification.
Acknowledgments
This study was financially supported by the National Natural Science Foundation of China (No. 31660137).
Author Contributions
Weiqiang Pi was the primary contributor to this manuscript; he was mainly responsible for data analysis and model optimization, and wrote the first draft of the manuscript. Hongyan Yang made substantial contributions to the design of the experimental scheme and the use of equipment. Yongchao Kang helped design the three deep learning models. Xipeng Zhang contributed to the editing of the manuscript and improved the illustrations.
References
- T. Wang and Z.D. Zhu, J. Desert Res.23, 209–214 (2003).
- H. Yin, Z.G. Li, and Y.L. Wang, Chin. J. Plant Ecol.35(3), 345–352 (2011).
- Y. Yan, Y.F. Chen, and C.G. Zhao, Geol. Exploration55(2), 630–640 (2019).
- Y.C. Ye, G.S. Zhou, and X.J. Yin, Acta Ecol. Sin.36, 4718–4728 (2016).
- J.X. Li, L. Zhang, and M. Hong, Acta Ecol. Sin.36, 277–287 (2016).
- X. Yang, X.J. Xiang, and J.J. Wei, Acta Prataculturae Sinina 24(11), 1–9 (2015).
- Y. Chen, Geol. Explor.55(2), 630–640 (2019).
- R.X. Guo, X.D. Guan, and Y.T. Zhang, J. Arid Meteorology 33(3), 505–514 (2015).
- C. Giardino, V.E. Brando, P. Pinnel, E. Hochberg, and E. Knaeps, Surveys in Geophysics40, 401–429 (2019).
- J.F. Exbrayat, A.A. Bloom, N. Carvalhais, R. Fischer, and A. Huth, Surveys in Geophysics 40, 735–755 (2019).
- S. Sathyendranath, R. Brewin, and C. Bocjmann, Sensors19(4), 936 (2019) https://doi.org/10.3390/s19040936
- A. Sanchez-Espinosa and C. Schroder, J. Environ. Manage.247, 484–498 (2019).
- C.Y. Sun, S. Kato, and Z.H. Gou, Sustainability11(10), 2759 (2019).
- W.W. Liu, J.F. Huang, C.W. Wei, X.Z. Wang, L.R. Mansaray, J.H. Han, D.D. Zhang, and Y.L. Chen, ISPRS J. Photogrammetry and Remote Sensing 142, 243–256 (2018).
- B. Peng, K.Y. Guan, M. Pan, and Y. Li, Geophys. Res. Lett. 45(18), 9662–9671 (2018).
- H.J. Liu, L.H. Meng, X.L. Zhang, and U. Susan, Chin. Soc. Agric. Eng.31(17), 215–220 (2015).
- S. Jeong, J. Ko, and J.M. Yeom, Remote Sens.10(10), 1665 (2018).
- S.E. Franklin, J. Unmanned Vehicle Systems6(4), 195–211 (2018).
- M.C. Quilter and V.J. Anderson, J. Range Manage. 54(4), 378–381 (2001).
- Z.H. Li, Z.H. Li, D. Fairbairn, N. Li, B. Xu, and H.K. Feng, Computers and Electronics in Agriculture162, 174–182 (2019).
- X.Q. Zhao, G.J. Yang, J.G. Liu, and X. Y. Zhang, Chin. Soc. Agric.Eng.33(1), 110–116 (2017).
- Y. B. Lan, Z. H. Zhu, and X. L. Deng, Chin. Soc. Agric.Eng.35(3), 92–100 (2019).
- D. Su, J. Agricultural Mechanization Research 35(2), 189–191,196 (2013).
- Z.L. Pan, Z.W. Wang, and G.D. Han, Ecol. Environ. Sci. 25(2), 209–216 (2016).
- W. Zhao and H. Zhang, 2012 International Conference on Computer Science and Electronics Engineering. (2012).
- S.T. Li, W.W. Song, L.Y. Fang, and Y.S. Chen, IEEE Trans. Geosci. Remote Sensing57(9), 6690–6709 (2019).
- Z.W. Li, H.F Shen, and Q. Chen, J. Photogrammetry and Remote Sensing150, 197–212 (2019).
- Y. Li, H.K. Zhang, and Q. Shen, Remote Sens.9(1), 67 (2017).
Weiqiang Pi, Yuge Bi, Jianmin Du, Xipeng Zhang, and Yongchao Kang are with the Mechanical and Electrical Engineering College of Inner Mongolia Agricultural University, in Hohhot, China. Hongyan Yang is with the Mechanical Engineering College of bInner Mongolia University of Technology, in Hohhot, China. Direct correspondence to: biyuge163@163.com

Geographical Traceability of Millet by Mid-Infrared Spectroscopy and Feature Extraction
February 13th 2025The study developed an effective mid-infrared spectroscopic identification model, combining principal component analysis (PCA) and support vector machine (SVM), to accurately determine the geographical origin of five types of millet with a recognition accuracy of up to 99.2% for the training set and 98.3% for the prediction set.
Authenticity Identification of Panax notoginseng by Terahertz Spectroscopy Combined with LS-SVM
In this article, it is explored whether THz-TDS combined with LS-SVM can be used to effectively identify the authenticity of Panax notoginseng, a traditional Chinese medicine.

.png&w=3840&q=75)

.png&w=3840&q=75)


.png&w=3840&q=75)


.png&w=3840&q=75)


