Alcohols—The Rest of the Story
Spectroscopy
In addition to primary alcohols there exist secondary and tertiary alcohols.
Our survey of the spectroscopy of the C-O bond continues where we complete our discussion of alcohols and discuss how to distinguish pure alcohols, alcohol–water mixtures, and pure water from each other.
In the last column (1) I introduced you to the spectroscopy of the C-O bond, and we covered how to interpret the spectra of primary alcohols. As I discussed then, in addition to primary alcohols, secondary alcohols, tertiary alcohols, and phenols can be analyzed by infrared spectroscopy as well. The chemical structures of primary, secondary, and tertiary alcohols are shown in Figure 1.
Figure 1: The structures of primary, secondary, and tertiary alcohols. The R-groups represent non-hydrogen atoms, typically carbons.

Remember that in general alcohols have a broad, strong O-H stretch at 3350 ± 50 cm-1 (assume all peak positions stated after this are in cm-1 units), an in-plane -OH bend at 1350 ± 50, and an O-H wag at 650 ± 50 (1). Lastly, primary alcohols typically have a C-C-O asymmetric stretch (hereinafter called the C-O stretch) between 1000 and 1075. As we will learn in this installment, the key to distinguishing these alcohols from each other is the position of the C-O stretching peak.
The Spectra of Secondary and Tertiary Alcohols
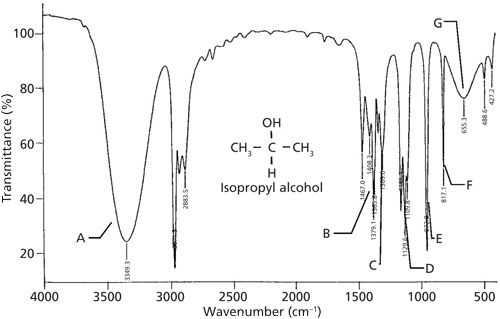
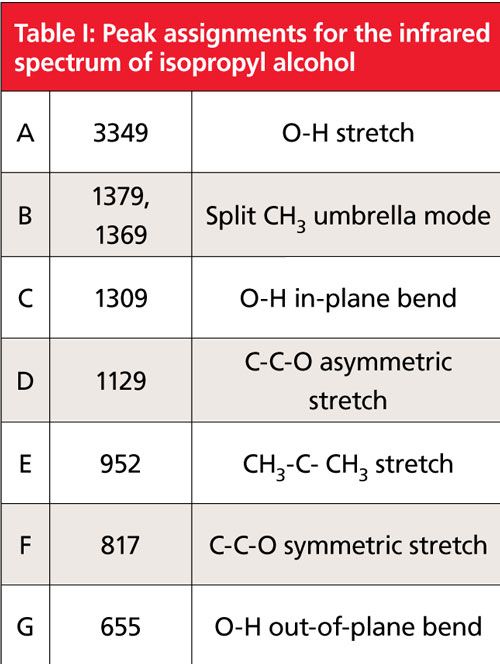
A spectrum of a secondary alcohol, called isopropyl or “rubbing” alcohol, is shown in Figure 2, and its peak assignments are shown in Table I. As we have learned (1), the infrared peaks of alcohols are broadened because of hydrogen bending and are hence easy to spot. In Figure 2 the OH stretch is labeled A at 3349, the in-plane bend labeled C appears at 1309, and the -OH wag labeled G appears at 655. Recall that the C-O stretch is frequently the largest peak between 1300 and 1000 (1). Following this rule we can assign the peak labeled D at 1129 as the C-O stretch of isopropyl alcohol. Note that this is higher in wavenumber than the range quoted for primary alcohols of 1075 to 1000. For secondary alcohols generally the C-O stretch falls between 1150 and 1075. Thus, a C-O stretch below 1075 can be assigned as a primary alcohol, and a C-O stretch above 1075 can be assigned as a secondary alcohol. The C-C-O symmetric stretch of isopropyl alcohol is at 817 and is labled F in Figure 2. Peak B is a “split” umbrella mode due to the branch point in isopropyl alcohol. More on this type of peak and branch points in a future column. Peak E is from a C-C stretching vibration. Carbon-carbon stretching vibration peaks are typically not this intense. However, the oxygen attached to the carbon atoms polarizes these bonds, increasing the change in dipole moment with respect to distance during the vibration, resulting in an increase in peak intensity.
Figure 2: The infrared spectrum of isopropyl alcohol, C3H8O, measured as a capillary thin film.
CLICK TO ENLARGE
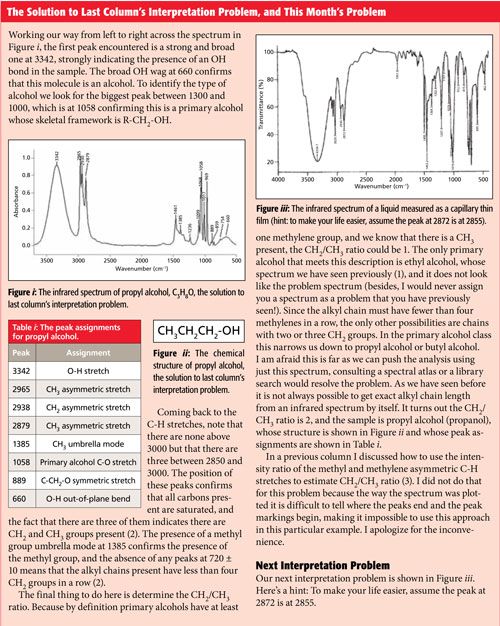
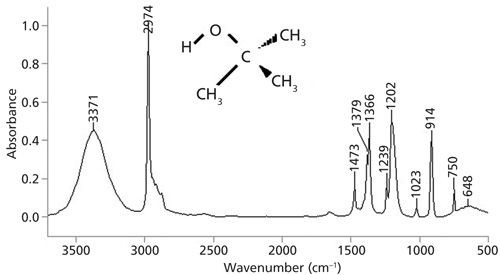
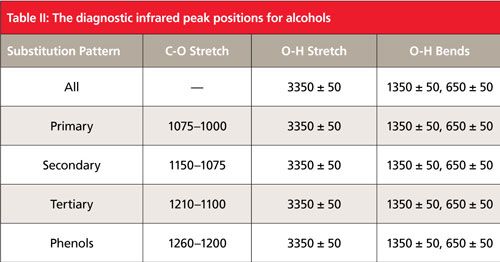
The spectrum of a tertiary alcohol, tert-butanol, is seen in Figure 3. The OH peaks fall as expected, with the stretch at 3371, the in-plane bend at 1366, and wag at 648. Note that tert-butanol also has a split umbrella mode with peaks at 1379 and 1366 because of its branch point. The reasonably intense peak at 914 is the symmetric C-C-O stretch. The biggest peak between 1300 and 1000 is at 1202 and is assigned as the C-O stretch. In general for tertiary alcohols this peak falls between 1210 and 1100. Unfortunately, this range overlaps significantly with the range for secondary alcohols. Using the C-O stretching peak position as noted in Table II, primary and secondary alcohols can be distinguished, primary and tertiary alcohols can be distinguished, but secondary and tertiary alcohols may or may not be distinguished depending upon where their C-O stretches fall. Unfortunately, there are no other useful IR peaks to solve this problem. Other information, such as a 13C nuclear magnetic resonance (NMR) spectrum, may be needed to distinguish secondary and tertiary alcohols from each other.
Figure 3: The infrared spectrum of tert-butanol, C4H10O, measured as a capillary thin film.
Phenols
As stated in the last column (1), phenols contain an OH group attached to an aromatic ring. The spectrum of the namesake molecule of this class, phenol, is shown in Figure 4.
Figure 4: The infrared spectrum of phenol, C6H6O, measured as a capillary thin film.
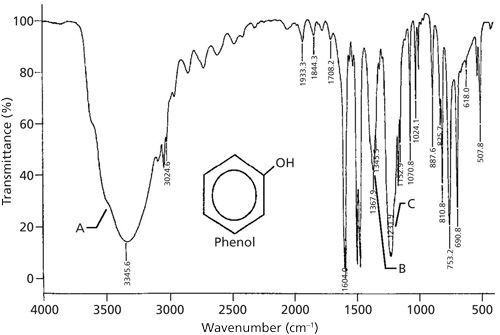
This spectrum is one of the busiest we have seen so far, and I included it not to confuse you, but to be real. As the molecules we study include more and more functional groups, their spectra will become more complicated and unfortunately more challenging to interpret. Consider studying this spectrum good preparation for what is to come in future columns.
The OH stretch at 3345 and in-plane bend at 1367 can be easily seen in Figure 4. This latter peak is in the same wavenumber range as methyl group umbrella modes; however, note that there are no methyl C-H stretches below 3000, and the 1367 peak is too broad to be from a CH3 group. The largest peak between 1300 and 1000 is at 1231, and is assigned as the C-O stretch. In general, for phenols this peak falls between 1260 and 1200. Usually phenols can be distinguished from primary and secondary alcohols based on the position of their C-O stretch, and can often be distinguished from tertiary alcohols unless the C-O stretch falls from 1210 to 1200. In Figure 4 this is the case, but we know this is not a saturated alcohol because of the lack of C-H stretches between 3000 and 2800.
We would expect the spectrum of phenol to have an OH wag at 650 ± 50, but it is not obvious on an initial examination of Figure 4. However, if you look closely there is a broad envelope in this region with sharper benzene ring peaks on top of it. So the wag is there-it’s just hard to assign a peak position to it. This is often a problem for phenols, so be on the lookout for broad envelopes like this one at low wavenumber if you suspect a phenol is present in a sample.
Table II summarizes the peak positions for the various alcohols.
Distinguishing Alcohols from Water
The infrared spectrum of liquid water is shown in Figure 5. Both water and alcohols have an OH bond and thus have OH stretching peaks that are intense, broad, and fall in the same place around 3300. Because of this shared spectral feature, the presence of an OH stretch in a spectrum is not diagnostic for the presence of an alcohol, only for the presence of an OH group. If you see an OH stretch then how can you distinguish the spectra of a pure alcohol, water, or a mixture of the two? The solution to this problem is Table III.
Figure 5: The infrared spectrum of liquid water.
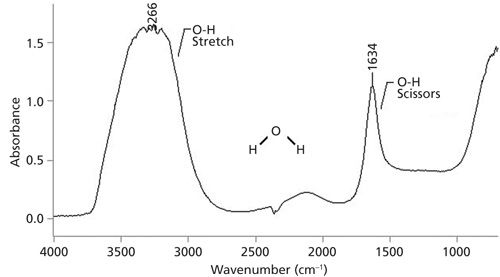

Note in Figure 5 that water has a scissors bending peak near 1630. This peak occurs because in water the oxygen has two hydrogens attached to it. By definition alcohols only have one O-H bond, and hence their spectra will not exhibit this peak. Also remember that water is inorganic and does not have a C-O bond, thus it will not have the C-O stretching peak that the spectra of all alcohols exhibit. This is the information that was used to construct Table III, where the presence or absence of these peaks can be used to distinguish these three types of samples from each other. For example, pure water has an OH stretch and a scissors peak, but no C-O stretch. A pure alcohol has an OH stretch and no scissors peak, but does have a C-O stretching peak. Lastly, a mixture of an alcohol and water has an OH stretch, a scissors peak from the water present, and a C-O stretch because of the alcohol present. Water–alcohol mixtures are relatively common because some alcohols are hygroscopic and are readily soluble in water. A mnemonic for remembering Table III is that for pure water the pattern is yes yes no, for pure alcohols it is yes no yes, and for a mixture of the two it is yes yes yes. This table should allow you to distinguish these types of samples from each other.
Summary
The spectra of alcohols and phenols typically exhibit a large peak between 1300 and 1000 that can be assigned as the asymmetric C-C-O stretch (“C-O stretch”). For primary alcohols this peak falls from 1075 to 1000, for secondary alcohols from 1150 to 1075, for tertiary alcohols from 1210 to 1100, and for phenols from 1260 to 1200. Thus the peak range for primary alcohols is unique and they are easily distinguished from all other secondary alcohols can be distinguished from primary alcohols but their C-O stretching has some overlap with tertiary alcohols, and phenols can usually be distinguished unless their C-O stretching peak falls between 1210 and 1200. Information about alcohol C-O stretching peak positions is summarized in Table II. The spectra of water, pure alcohols, and their mixtures can be distinguished using the presence or absence of the water scissors peak at 1630 and the alcohol C-O stretch between 1300 and 1000, as detailed in Table II.
References
- B.C. Smith, Spectroscopy32(1), 14–21 (2017).
- B.C. Smith, Spectroscopy30(7), 26–31 (2015).
- B.C. Smith, Spectroscopy30(9), 40–45 (2015).

Brian C. Smith, PhD, is the West Coast Business Development Manager for CAMO Software, a company that sells chemometric, multivariate analysis, and process control software. Before joining CAMO, Dr. Smith ran his own FT-IR training and consulting business for more than 20 years. Dr. Smith has written three books on infrared spectroscopy: Fundamentals of FTIR and Infrared Spectral Interpretation, both published by CRC Press, and Quantitative Spectroscopy: Theory and Practice published by Academic Press. He can be reached at: SpectroscopyEdit@UBM.com
AI Shakes Up Spectroscopy as New Tools Reveal the Secret Life of Molecules
April 14th 2025A leading-edge review led by researchers at Oak Ridge National Laboratory and MIT explores how artificial intelligence is revolutionizing the study of molecular vibrations and phonon dynamics. From infrared and Raman spectroscopy to neutron and X-ray scattering, AI is transforming how scientists interpret vibrational spectra and predict material behaviors.
Real-Time Battery Health Tracking Using Fiber-Optic Sensors
April 9th 2025A new study by researchers from Palo Alto Research Center (PARC, a Xerox Company) and LG Chem Power presents a novel method for real-time battery monitoring using embedded fiber-optic sensors. This approach enhances state-of-charge (SOC) and state-of-health (SOH) estimations, potentially improving the efficiency and lifespan of lithium-ion batteries in electric vehicles (xEVs).
New Study Provides Insights into Chiral Smectic Phases
March 31st 2025Researchers from the Institute of Nuclear Physics Polish Academy of Sciences have unveiled new insights into the molecular arrangement of the 7HH6 compound’s smectic phases using X-ray diffraction (XRD) and infrared (IR) spectroscopy.