Application of Mass Spectrometry to Support Verification and Characterization of Counterfeit Pharmaceuticals
The production and sale of counterfeit drugs has risen sharply in recent years. The World Health Organization (WHO) estimates that counterfeit medicines account for approximately 1% of sales in developed countries and well over 10% in developing countries.
The production and sale of counterfeit drugs has risen sharply in recent years. The World Health Organization (WHO) estimates that counterfeit medicines account for approximately 1% of sales in developed countries and well over 10% in developing countries. These substandard versions of medications not only represent a significant safety threat to patients, but also challenge the credibility of the pharmaceutical industry and its ability to provide patients with safe and effective products. These counterfeit products may contain either the incorrect dose or none of the intended active compound. In some cases, these counterfeit medicines contain different active drug components and, in the worst cases, may even contain toxic substances. Because of these concerns, the pharmaceutical industry vigilantly monitors the global market for counterfeit products. When a suspected counterfeit product is detected at Bristol-Myers Squibb, it is fully characterized to assess the potential risks to patient safety. Liquid chromatography coupled to mass spectrometry (LC–MS), with accurate-mass capability, is a powerful tool for investigating counterfeit pharmaceuticals because it allows the rapid assignment of the molecular weight and formula of each component, which can then be used to search the literature or internet for a potential match. This approach is frequently successful because counterfeiters often formulate their products from commonly available, relatively simple materials, rather than novel products.
The World Health Organization (WHO) defines counterfeit drugs as drugs that are "deliberately mislabeled with respect to identity and/or source. Counterfeiting can apply to both branded and generic products with counterfeit products including drugs with the correct ingredients or with the wrong ingredients; without active ingredients, with insufficient active ingredient or with fake packaging" (1). Counterfeit pharmaceutical products have been detected since approximately 1990 (2). Since then, the number of cases investigated by the US Food and Drug Administration (FDA) quadrupled to an average of about 20 per year in 2001 and 2002 (3). In an effort to ensure patient safety and brand integrity, the pharmaceutical industry vigilantly monitors the global market for counterfeit products. Counterfeit products at Bristol-Myers Squibb are fully characterized to assess the risks to patient health and safety.
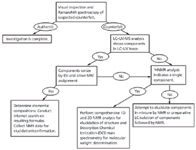
Figure 1: Decision-tree diagram of the general strategy for counterfeit product analysis.
The first step in detecting a counterfeit medicine is to conduct a visual inspection of its physical characteristics as well as the appearance of the accompanying packaging materials. The effectiveness of a visual inspection may have limited success given the increased sophistication adopted by counterfeiters. An even greater challenge than identifying a pharmaceutical product as a counterfeit is the identification and quantitation of all components present in the material. This process is necessary to make an accurate assessment of toxicology and patient risk. Identification and quantitation of components in a counterfeit product requires chemical analysis. Throughout the industry, various modern analytical techniques have been applied for the characterization of counterfeit pharmaceuticals, including thin-layer chromatography (TLC) (4), gas chromatography (GC) (5), high performance liquid chromatography (HPLC) (6), Raman and near infrared (NIR) spectroscopy (7–11), mass spectrometry (MS) (12,13), and nuclear magnetic resonance (NMR) spectroscopy (14,15). Each of these techniques is capable of providing rich analytical data to assist in the characterization of counterfeit medicines. In practice, two or more of these techniques will be used orthogonally because the ideal goal of these investigations is to achieve absolute identification and quantitation of all components that are present (16).

Figure 2: LCâUV chromatogram (210 nm) of product A tablet extract.
To enable the complete characterization of detected counterfeit medicines, a general strategy has been developed that uses vibrational spectroscopy (Raman and NIR), liquid chromatography coupled to mass spectrometry (LC–UV-MS), and NMR as an orthogonal structural confirmational technique. An overview of this strategy is depicted in Figure 1. A visual inspection followed by analysis with Raman or NIR spectroscopy is used as an initial screen to identify product authenticity. If the product is deemed authentic based on a comparison of the collected spectra of the possible counterfeit product to library spectra acquired on the authentic product, then the investigation is complete. If the drug product is deemed a counterfeit based on this initial screen, then the material is subjected to low-resolution LC–UV-MS to assess the number of components present and assign molecular weights to all components observed in the LC–UV and MS total ion chromatograms (TIC). The initial screen by LC–UV-MS is performed on systems that are equipped and maintained for open-access usage. Use of the open-access systems improves the efficiency of the analysis process since these systems are preconfigured and available to run samples. If low-resolution MS analysis provides adequate ionization of the counterfeit components, then the sample is analyzed on a high-resolution instrument for accurate-mass measurement and assignment of molecular formulas. To achieve a narrow list of possible formulas, the elemental composition search is restricted with respect to included elements and the allowed deviation of calculated masses from the measured mass. Initially, the search is restricted to formulas that contain only C, H, N, and O. The allowed deviation from the measured mass is set to a maximum of 1.25 mmu. The isotopic distribution is also evaluated to check for the presence of elements other than C, H, N, and O that should be included in the element set.

Figure 3: Negative-ion ESI mass spectrum of component 1 observed in product A.
As an alternative, the sample can also be analyzed initially on an accurate-mass instrument, thereby bypassing the need for the low-resolution screen. If the low-resolution LC–MS analysis indicates a single component, or if the response in the mass spectrometer is found to be poor by electrospray ionization (ESI) then the sample is analyzed by NMR next. For samples that fail to ionize by ESI, and were observed to be relatively pure by NMR, desorption chemical ionization (DCI) is attempted to obtain a molecular weight and elemental composition for the unknown component. Quantitation of components is performed following identification of the components. For counterfeit products containing a single component, such as aspirin, LC–UV can be utilized to quantify the analyte by comparison with an authentic standard. Quantitative NMR (qNMR) is also used to determine the level of analytes in counterfeit products (17). For more-complex mixtures, a combination of techniques may be required to identify and quantify all of the individual components present in the counterfeit medicine. For example, techniques such as LC–UV-MS coupled with NMR spectroscopy (qualitative and quantitative), LC–UV-MS coupled with Raman or NIR spectroscopy, or these techniques coupled as needed with preparative LC isolation, X-ray diffractometry, or ICP-MS for metals analysis (18,19) can be used.
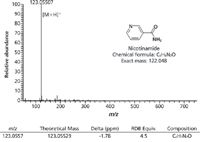
Figure 4: Accurate mass, positive-ion ESI mass spectrum of component 2 observed in product A.
The strategy described above has been used to complete numerous counterfeit investigations at Bristol-Myers Squibb. In general, LC–MS has proven to be a powerful tool for the characterization of counterfeit products. The ability to rapidly assign a molecular weight and often a single formula for each counterfeit component affords the opportunity to expedite the putative identification using literature or internet searching. This process could be likened to electron ionization (EI) library searching in its ability to quickly filter potential candidates. Investigations using this approach are generally successful because counterfeiters often produce their products from commonly available, relatively simple materials, not novel products. A series of case studies are presented here that demonstrate the general strategy for conducting investigations of counterfeit materials.

Figure 5: Positive- and negative-ion ESI total ion chromatograms of the product B extract.
Experimental
Initial LC–MS assessment is conducted using a system comprising a Shimadzu analytical HPLC system equipped with an SPD-10AV UV–vis detector and coupled to a Waters ZQ 2000 mass spectrometer. Chromatographic separation is performed using a 50 mm × 4.6 mm, 2.7-μm dp Ascentis Express C18 column. The HPLC system is controlled using Shimadzu's Class VP software and the mass spectrometer is controlled by MassLynx v 4.0 SP4 software (Waters). These systems are configured for open-access use. The mass spectrometer is operated in both positive- and negative-ion modes (alternating). Data are acquired, in both modes, in the m/z 75–1200 range. Typical flow rates are 1.0–1.5 mL/min. The flow is split to deliver approximately 300 μL/min of eluent to the mass spectrometer. Mobile-phase A is 95:5 0.01 M ammonium acetate in water–acetonitrile. Mobile-phase B is 5:95 0.01 M ammonium acetate in water–acetonitrile. A rapid gradient from 0% B to 100% B is used.
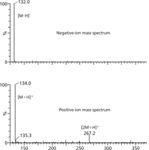
Figure 6: Positive- and negative-ion mass spectra of the component at tR = 0.44 min from the
High-resolution mass spectrometry is conducted using a Waters Q-Tof Premier or a Thermo Fisher Scientific LTQ Orbitrap Discovery mass spectrometer. Both instruments are equipped with a Waters Acquity pump and photodiode-array detector. Chromatographic separations are run on a 100 mm × 2.1 mm, 1.7-μm dp Waters BEH C18 column. The Q-Tof Premier system is controlled by MassLynx v 4.1 software (Waters) and is operated in V-mode with a resolution of 10,000 (full width at half maximum [FWHM]). The LTQ Orbitrap Discovery system is controlled by Xcalibur v 2.0.7 software (Thermo Fisher Scientific) and data are acquired at a resolution of 30,000 (FWHM).
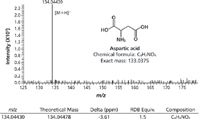
Figure 7: Accurate mass, positive-ion mass spectrum of the component at tR = 0.44 min from the
Positive-ion DCI with methane is used for the characterization of components that do not ionize adequately by LC–MS with ESI. The analysis is performed on a Waters GCT Premier system equipped with a DCI probe for sample introduction. The instrument is controlled using MassLynx v 4.1. The instrument is operated at a resolution of 7000 (FWHM) and the data is acquired over a range from m/z 50–700. Heptacosa (perfluorotri-n-butylamine) is introduced as an internal reference for accurate-mass measurement.

Figure 8: LCâUV chromatogram (220 nm) of product C tablet extract.
Results and Discussion
Case Study 1: Product A
Product A tablet was confirmed as counterfeit by Raman spectroscopy and was suspected to contain ascorbic acid based on comparison of the Raman spectrum to spectra in the library. A portion of the counterfeit tablet was extracted with 50:50 acetonitrile–water and sonicated for 20 min. The extracted liquid was filtered and diluted (1:15) for LC–UV-MS analysis. Figure 2 shows the LC–UV chromatogram obtained from the preliminary low-resolution LC–MS experiment. Component 1 was ionized using negative-ion ESI and was confirmed to be ascorbic acid based on the determined molecular weight of 176 Da as shown in Figure 3. Detection of ascorbic acid was consistent with the initial Raman analysis. The molecular weight of component 2 was assigned as 122 Da based on the low-resolution mass spectrum. To obtain the molecular formula of component 2, the sample was analyzed on a high-resolution instrument using positive-ion ESI, as shown in Figure 4. For component 2, evaluation of possible elemental compositions resulted in a single formula (C6H6N2O). Because only a single formula possibility was obtained, the formula was entered into an internet search engine to obtain a list of matching structures. The internet search on C6H6N2O returned nicotinamide as a possible structure. Next, 1H NMR data of the extract were collected to check for organic compounds that may not have been visible in the LC–UV-MS analysis and to further confirm the structure proposals for component 1 and component 2. Component 1 and component 2 were confirmed by 1H NMR to be ascorbic acid and nicotinamide. No additional components were detected by NMR. The 1H NMR data were also used to determine the mole ratio of ascorbic acid:nicotinamide as 4:1 (qNMR). An internet search confirmed the availability of commercial vitamin supplements with ascorbic acid and nicotinamide present in the same ratio.
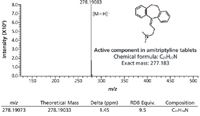
Figure 9: Positive-ion ESI mass spectrum of the tR = 3.51 min component in the product C extract.
Case Study 2: Product B
A tablet of suspected counterfeit product B was received following initial determination of counterfeit status by Raman spectroscopy. No additional structural information was obtained from the Raman analysis. A portion of the counterfeit tablet was extracted with 50:50 acetonitrile–water and sonicated for 20 min. The extracted liquid was filtered and diluted (1:10) for LC–UV-MS analysis. No significant components were detected in the LC–UV chromatogram; however, a poorly retained component was detected in both the positive- and negative-ion ESI total ion chromatograms as shown in Figure 5. The molecular weight of this component was determined to be 133 Da based on the positive- and negative-ion mass spectra (Figure 6). An accurate-mass analysis was conducted in positive-ion ESI mode and the data is shown in Figure 7. A single possibility for the molecular formula was obtained from the accurate-mass data (C4H7NO4). An internet search conducted on this molecular formula suggested the identification was aspartic acid, which was confirmed by analyzing the extraction mixture by 1H NMR. The 1H NMR data additionally confirmed the absence of other organic components.
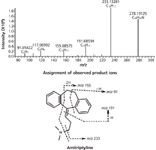
Figure 10: Positive-ion ESIâMS-MS spectrum of the tR = 3.51 min component in product C (m/z 278.2).
Case Study 3: Product C
Product C was received and tested by LC–UV-MS after preliminary Raman screening confirmed its status as a counterfeit. No additional structural information could be gleaned from the Raman spectral analysis because the spectrum failed to yield a high-quality match with any of the compounds in the library. Similar to previous work, a portion of the counterfeit tablet was extracted with 50:50 acetonitrile–water and sonicated for 20 min. The extracted liquid was filtered and diluted (1:5) for LC–MS analysis. Figure 8 shows the LC–UV chromatogram at 220 nm that was obtained for the tablet extract, which indicates the presence of only one major component. The mass spectrum obtained for the major component observed in the HPLC analysis using positive-ion ESI is shown in Figure 9. The molecular weight of the compound was determined to be 277 Da. The elemental composition obtained from the accurate-mass measurement was C20H23N. This was the only possible formula returned by the software within the restricted accuracy window of 1.25 mmu. The formula was searched on the internet for possible structure matches and amitriptyline was the result. For additional confirmation of the identity of the counterfeit as amitriptyline, an accurate-mass product ion mass spectrum was collected and the product ion assignments are shown in Figure 10. All of the observed product ions are consistent with the identification of the active component of amitriptyline. As in the previous case studies, 1H NMR was used to confirm the structure of amitriptyline and ensure the absence of additional organic components. Amitriptyline is a tricyclic antidepressant that is used in the treatment of a variety of medical conditions including depressive and anxiety disorders, attention deficit disorder, hyperactivity disorder, migraines, eating disorders, insomnia, and bipolar disorder, among others (20). Though this product did contain an approved active pharmaceutical ingredient, amitriptyline, it did pose a significant risk to the patient because this compound is not an approved therapy or active against the target disease indicated for treatment with product C.
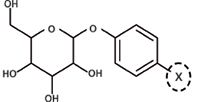
Figure 11: Partial structure elucidated by NMR analysis for the active component in product D.
Case Study 4: Product D
Product D was initially tested by Raman and NIR spectroscopy, which indicated a counterfeit material composed of a possible mixture of lactose, hydroxypropyl cellulose (HPC), and starch. The compound did not ionize upon LC–UV-MS analysis with either positive- or negative-ion ESI. The sample was found to dissolve completely in H2O, so a D2O solution was used to obtain structural information using NMR. The NMR analysis indicated a single, pure component. Comprehensive one-dimensional (1D) and two-dimensional (2D) NMR analysis were successful in elucidating the majority of the unknown structure as shown in Figure 11. Mass spectrometry was needed to identify the para substituent labeled as "X" in Figure 11 because it was not represented in the NMR data set. DCI was used to obtain a mass spectrum of the compound because ESI had failed in the preliminary LC–UV-MS sample analysis. The mass spectrum obtained from the DCI analysis is shown in Figure 12. The molecular formula was elucidated as C12H16O7 based on the DCI accurate-mass analysis. Coupled with the structural information obtained from the NMR analysis, the para substituent was identified as a hydroxyl (-OH) group. An internet search using the molecular formula resulted in the further identification of this compound as arbutin (Figure 13). Arbutin is used as a skin-lightening agent, generally in topical applications, and is extracted from the bearberry plant (21). Its toxicology upon oral ingestion is unknown. This case study shows another example of a counterfeit product that contains an active component whose indication is misaligned with the intended disease area of the authentic product.

Figure 12: Positive-ion DCI mass spectrum and elemental composition data for Product D analysis.
Case Study 5: Product E
The general strategy that is used for testing counterfeit products has also been applied to the characterization of customer complaint samples. A complaint sample (product E) was received for characterization after preliminary testing by Raman and NIR spectroscopy indicated that the product contained within the bottle was not authentic. Visual examination of the packaging revealed the presence of pink residue on the threads of the dropper bottle, which indicates that at one point the bottle contained the authentic product (pink liquid), but was subsequently refilled with an unknown yellow liquid material. Two peaks, connected by a low horizontal plateau, were detected in the LC–UV chromatogram (see Figure 14). This type of peak shape is frequently indicative of an on-column interconversion or degradation (22). Molecular weights of 217 Da and 311 Da were assigned to these two observed components. The mass spectrum of the 311 Da component is shown in Figure 15. Accurate-mass data afforded molecular formula information. The compound was determined to contain sulfur, and a loss of H2SO3 was observed from in-source fragmentation. NMR analysis performed in parallel indicated the presence of a monosubstituted phenyl ring, three methyl groups, and a methylene group. The MS data coupled with the information obtained from the NMR analysis was used to elucidate the structures of the two compounds as shown in Figure 16. Based on the structures, on-column degradation could easily be rationalized. The primary component (311 Da) was identified as metamizole, a powerful analgesic and antipyretic (23) that is available over the counter (OTC) as a yellow solution. The indication for product E does not align with that of metamizole.
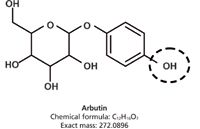
Figure 13: Structure of arbutin.
Case Study 6: Product F
Product F was received for characterization after preliminary testing by Raman and NIR spectroscopy indicated that the product packed within the gel capsules was not the authentic drug substance. The investigation focused on characterization of the bulk yellow solid. The solid was observed to be insoluble in virtually all common solvents; however, it dissolved in hydrochloric acid to produce a yellow solution. Based on the solubility characteristics and the observation of effervescence upon dissolution it was suspected that the solid was primarily composed of an inorganic component. Reevaluation of the Raman data with a library containing inorganic compounds resulted in identification of the primary component as CaCO3. The weight percent of CaCO3 in the bulk solid was determined as 81.6 by titration. NMR analysis performed in DCl identified the presence of starch and acetaminophen in the solid. Quantitative NMR was used to assign a combined weight percent of 17.0 to starch and acetaminophen. Because none of the positively identified components could account for the color of the bulk solid, additional testing was conducted to understand the cause of the yellow color. A sample was analyzed by LC–UV-MS with UV detection at 430 nm and with only a single component observed in the UV chromatogram. The molecular weight and elemental composition of the component were determined by MS. An internet search on the molecular formula led to its identification as tartrazine (the United States Federal Food, Drug, and Cosmetic Act [FD&C] Yellow 5). Figures 17 and 18 show a comparison of the HPLC retention and UV spectra of the yellow component observed in product F with an authentic standard of tartrazine.

Figure 14: LCâUV chromatogram of product E (260 nm).
Conclusions
A series of case studies were presented to demonstrate a general strategy for conducting investigations of counterfeit pharmaceutical products. The case studies highlight the role of mass spectrometry in enabling the rapid characterization of suspected counterfeit products. The use of this process enables an efficient assessment of patient safety risks that are introduced by these products. The ability to readily assign molecular weights and often a single formula for each counterfeit component expedites the process of identification through literature and internet searching. The characterization is enhanced by coupling the information obtained from the LC–UV-MS experiments with NMR data. Analysis of the counterfeit samples by NMR provides full confidence in the structural proposals from the LC–UV-MS analysis and can be leveraged to enable the quantification of components by qNMR.

Figure 15: Mass spectrum of the 311 Da component identified in product E.

Figure 16: Structure of the primary component in product E and the resulting on-column degradation product.
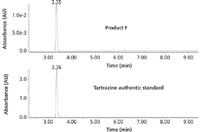
Figure 17: LCâUV chromatograms of product F and an authentic sample of tartrazine (430 nm).

Figure 18: UV spectra of primary component in product F and an authentic sample of tartrazine (430 nm).
Michael B. Peddicord, Charles Pathirana, Holly M. Shackman, Mark S. Bolgar, and Scott A. Miller are with Bristol-Myers Squibb, Analytical and Bioanalytical Development in New Brunswick, New Jersey. Please direct correspondence to: michael.peddicord@bms.com.
References
(1) http://www.who.int/medicines/services/counterfeit/overview/en/.
(2) A.K. Deisingh, Analyst 130, 271–279 (2005).
(3) B. Hileman, Chem. Eng. News 81(45), 36–43 (2003).
(4) J. Sherma, Acta Chromatogr. 19, 5–20 (2007).
(5) E. Deconinck, P.Y. Sacré, P. Courselle, and J.O. De Beer, J. Chromatogr. Sci. 51(8), 791–806 (2013).
(6) Y.Q. Shia, J. Yaob, F. Liuc, C.Q. Hua, J. Yuanc, Q.M. Zhanga, and S.H. Jin, J. Pharm. Biomed. Anal. 46(4), 663–669 (2008).
(7) S.H. Scafi and C. Pasquini, Analyst 126(12), 2218–2224 (2001).
(8) N.W. Broad, C. Dentinger, and J. Pasmore, Raman Technologogy for Today's Spectroscopists, supplement to Spectroscopy 28(6), s22–s31 (2013).
(9) C. Eliasson and P. Matousek, Anal.Chem. 79, 1696–1701 (2007).
(10) R. Kalyanaraman, M. Ribick, and G. Dobler, Eur. Pharm. Rev. 17(5), 35–39 (2012).
(11) R. Kalyanaraman, G. Dobler, and M. Ribick, Am. Pharm. Rev. 14(4), 98–104 (2011).
(12) W.C. Samms, Y.J. Jiang, M.D. Dixon, S.S. Houck, and A. Mozayani, J. Forensic Sci. 56(4), 993–998 (2011).
(13) F.M. Fernández, R.B. Cody, M.D. Green, C.Y. Hampton, R. McGready, S. Sengaloundeth, N.J. White, and P.N. Newton, ChemMedChem 1(7), 702–705 (2006).
(14) V. Silvestre, V. Maroga Mboula, C. Jouitteau, S. Akoka, R. J. Robins, and G.S. Remaud, J. Pharm. Biomed. Anal. 50, 336–341 (2009).
(15) S. Balayssac, V. Gilard, M.A. Delsuc, and M. Malet-Martino, Spectrosc. Eur. 21(3), 10–14 (2009).
(16) R. Martino, M. Malet-Martino, V. Gilard, and S. Balayssac, Anal. Bioanal. Chem. 398, 77–92 (2010).
(17) S. Mahajan and I.P. Singh, Magn. Reson. Chem. 51(2), 76–81 (2013).
(18) J.K. Maurin, F. Plucinski, A. Mazurek, and Z. Fijalek, J. Pharm. Biomed. Anal. 43(4), 1514–1518 (2007).
(19) R. Santamaria-Fernandez, R. Hearna, and J.C. Wolff, J. Anal. Atomic Spectrom. 23, 1294–1299 (2008).
(20) http://www.rxlist.com/elavil-drug/indications-dosage.htm.
(21) http://www.kaviskin.com/info/a-arbutin.html.
(22) T. Nishikawa, R. Abe, Y. Sudo, A. Yamada, and K. Tahara, Anal. Sci. 20, 1395–1398 (2004).

High-Speed Laser MS for Precise, Prep-Free Environmental Particle Tracking
April 21st 2025Scientists at Oak Ridge National Laboratory have demonstrated that a fast, laser-based mass spectrometry method—LA-ICP-TOF-MS—can accurately detect and identify airborne environmental particles, including toxic metal particles like ruthenium, without the need for complex sample preparation. The work offers a breakthrough in rapid, high-resolution analysis of environmental pollutants.
The Fundamental Role of Advanced Hyphenated Techniques in Lithium-Ion Battery Research
December 4th 2024Spectroscopy spoke with Uwe Karst, a full professor at the University of Münster in the Institute of Inorganic and Analytical Chemistry, to discuss his research on hyphenated analytical techniques in battery research.
Mass Spectrometry for Forensic Analysis: An Interview with Glen Jackson
November 27th 2024As part of “The Future of Forensic Analysis” content series, Spectroscopy sat down with Glen P. Jackson of West Virginia University to talk about the historical development of mass spectrometry in forensic analysis.
Detecting Cancer Biomarkers in Canines: An Interview with Landulfo Silveira Jr.
November 5th 2024Spectroscopy sat down with Landulfo Silveira Jr. of Universidade Anhembi Morumbi-UAM and Center for Innovation, Technology and Education-CITÉ (São Paulo, Brazil) to talk about his team’s latest research using Raman spectroscopy to detect biomarkers of cancer in canine sera.