Applications of Reproducible SERS Substrates for Trace Level Detection
Recent progress in photonic crystal design is transforming surface-enhanced Raman spectroscopy (SERS) from a research tool into a powerful new analytical technique. High sensitivity can be achieved due to the enormous amplification of the Raman signal of molecules in contact with nanostructured metal surfaces. This article highlights the performance of SERS substrates for a range of applications, illustrating the versatility of the technology, as well as future directions.

Identifying molecules at very low concentrations is critical for many analytical applications such as forensics, medical diagnostics, drug discovery, and chemical development. The molecular fingerprint information present in Raman spectra makes the technique both specific and quantitative. As a result of these qualities, combined with nondestructive, noninvasive measurement, Raman spectroscopy has gained rapid acceptance as a routine analytical technique during the past few years (1).
One drawback of Raman spectroscopy is its lack of sensitivity. It is typically not considered a viable technique for measuring analytes at concentrations below 1% ν/ν. The surface-enhanced Raman spectroscopy (SERS) effect (2,3), described over 30 years ago, promised to expand the applications of Raman into very low concentrations, with signal enhancements in excess of a million times that of conventional Raman. However, until very recently, the SERS substrates (typically colloids or roughened surfaces) gave highly variable signals and severely limited SERS' acceptance as a viable analytical technique.
During the past 18 months, the combination of photonic crystal design and semiconductor manufacturing methods has produced, for the first time, SERS substrates whose reproducibility is within the requirements for routine analysis. Practical enhancements on the order of 104 –106 and reproducibility better than 5% can now be achieved with commercially available substrates (4).
In addition to the analytical advantages of these new substrates, they also enable measurements with lower cost analytical grade Raman instruments.
How to Make SERS Substrates Reproducible
In previous SERS substrates, the reproducibility over large areas and from sample to sample was limited by the preparation methods. The commonly used techniques exploit colloids or roughened surfaces, which prevent the control of the spacing and periodicity of the features. This results in "hot-spots," where the proximity of adjacent features provides high enhancement, interspersed with large areas of little or no enhancement. The analyst is left to locate the hot spots manually to measure the SERS spectrum. This lack of reproducibility effectively has limited SERS to the research laboratory.
One solution to engineering reproducible SERS substrates is to combine the unique physical properties of photonic crystal devices (5,6) with highly reliable semiconductor manufacturing techniques. Photonic crystal research has demonstrated how periodic texturing of surfaces results in a wealth of new optical properties when the features have dimensions comparable with the wavelength of light (~0.1–1 μm). Metal-coated photonic crystal surfaces result in devices with a remarkable double function. They act as powerful antennae that concentrate and localize the optical field at the individual features. They also act as powerful transducers that can couple the laser light in and out of the molecule adsorbed onto the surface (7). One of the greatest advantages of photonic crystal technology is the ability to tune the optical properties of such devices by modifying the dimensions and the geometry of the texture features and the metal. Consequently, the sensitivity of the substrates can be tuned to different wavelengths or tailored to the type of experiment. An example of photonic crystal SERS substrate is shown in Figure 1. The details of the surface texture features and how they affect the localization of electric field within the photonic crystal features also are shown.
Excellent reproducibility over large areas can be achieved reliably with standard and well established techniques used in semiconductor manufacturing. Photonic crystal substrates can be manufactured at wafer scale with outstanding tolerances. Photolithography and imprinting techniques allow well-defined metal structures down to hundreds of nanometers.
Finally, chemical functionality can be added to the textured gold surface, exploiting well-established surface chemistry protocols. For instance, the coating of SERS substrates with ligand molecules having specific terminal groups is extremely effective to boost the selectivity of the SERS substrate. This functionalization of SERS substrates is particularly useful in the case of complex molecules such as proteins (8) or for molecules with low affinity to metal.
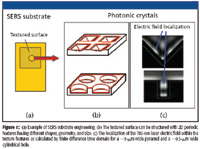
Figure 1
The combination of all these key techniques is making SERS extremely attractive for many analytical applications.
SERS Substrate Performance
Examples of the performance and fundamental aspects associated with SERS are given in Figures 2 and 3. All data presented here were measured using Mesophotonics' Klarite substrates and model SE1000 SERS spectrometer (Mesophotonics Ltd., Southampton, UK) (4).
A critical aspect of SERS measurement is ensuring the discrimination of the SERS signal from the standard Raman scattering. Figure 2 shows an example of how such identification can be performed. The SERS substrate sketched in Figure 1 has been placed in a cell that allows the signal from the textured and flat gold surfaces and from a liquid reference well to be acquired under the same experimental conditions. Figures 2a–2c illustrate how the intensity of the SERS signal varies when solutions having different concentrations are introduced into the cell. The SERS pyridinium ion ring breathing mode (1014 cm-1) is clearly discriminated by the bulk Raman only for solutions with concentrations < 1% (~1 mM). The similarity of the spectra in Figures 2a–2c for concentration ~25% v/v (~30 mM) demonstrates how the signal measured is a mixture of light scattered by the molecules adsorbed at the surfaces — visible as a shoulder at 1014 cm-1 in Figure 2b and standard Raman-scattered light displaying the liquid pyridine mode ~1005 cm-1. Care must therefore be adopted when measurements with SERS substrates are performed.
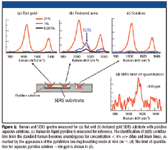
Figure 2
An empirical way to assess the enhancement that the textured substrate provides is shown in Figure 3a. This figure shows the comparison of the intensities measured in the liquid volume and in the same liquid in contact with a SERS substrate. Figure 3 highlights several fundamental aspects of SERS. One is the interplay of the contribution of SERS and Raman in the measurements. The SERS contribution is unambiguously measured only when standard Raman is no longer detectable. The linear dependence of Raman intensity as a function of concentration should mark the range of concentration that gives pure SERS signal. Finally, the ratio between the minimum concentration detected in standard Raman and the minimum concentration detected by the SERS substrate gives an empirical estimate of the enhancement factor. In the case of pyridine, the enhancement factor is > 10,000. The enhancement factor of a substrate can vary depending upon the molecule scattering cross-section. Molecules absorbing the incident light in resonance always give the highest enhancement factors due to the very efficient scattering process.

Figure 3
An example of the high reproducibility provided by an engineered substrate is shown in Figure 3b. The active area of the SERS substrate has been scanned in several points with the experiment layout sketched in Figure 2 (liquid cell). A relative standard deviation of the 1014 cm-1 mode across the 4 mm × 4 mm area is ~3%. Typical values measured across 6-in. wafers processed in the same batch are of the order of 5%.
Applications
Examples of the potential offered by SERS technology for analytical applications in the detection of drugs and polymers are given in this section. The issues and requirements for each application are highlighted.
The potential for roadside tests of illicit drugs in saliva is a typical example of how the analytical capability of SERS could be extremely valuable in a real-world application. Due to the nature of the test and the associated practicalities, some of the most stringent requirements for roadside testing are sensitivity, accuracy, reliability, and speed. The sensitivity is of paramount importance, as the drug metabolites must be detected at physiological concentration. High sensitivity results in a decrease of false negatives. Specificity is also extremely important in order to reduce the number of false positives.
Figure 4 shows the SERS spectra of cocaine aqueous solutions having concentrations between 30 ppm (30 mg/mL) and 30 ppb (30 ng/mL). The vibrational modes of the cocaine molecules are identified clearly on the spectra, the main signature being the phenyl ring symmetric stretch at ~1000 cm-1 . The high sensitivity of the SERS substrates allowed the spectra to be measured with an analytical-grade Raman system with a 10-s acquisition time. Concentrations as low as 30 ng/mL are detectable. This value is the typical physiological concentration of drug metabolites in saliva. Similar performance levels have been measured on other types of drugs such as amphetamines, ecstasy, and heroin. These examples highlight how SERS is extremely promising for applications with stringent requirements like roadside drug tests.
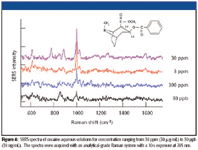
Figure 4
The same SERS technique can be applied to many other applications involving the analysis and detection of bodily fluids for diagnosis purposes (9).
Another important aspect of analytical applications is the characterization and quantitation of mixtures. For instance, the detection and characterization of pharmaceutical active ingredient, excipients, and contaminants are crucial at all steps of the manufacturing process from new product development to final assay of the product. Raman spectroscopy is a valuable tool for analyzing mixtures and is widely used in the pharmaceutical industry. The increase in sensitivity provided by SERS can be extremely useful for applications requiring identification and characterization of the structure of active components at low concentrations.
Figure 5 shows an example of the identification of mixtures by SERS. In the test, two common drugs — ibuprofen and warfarin — have been mixed in equal volumes. The SERS spectra of the single-component aqueous solutions are shown in the same graph. The main vibrational modes of the molecules have been highlighted on the graph for both pure components. The SERS spectra of a solution obtained by mixing equal volumes (0.1 mL) of ibuprofen (2 mg/mL) and warfarin (3 mg/mL) also is reported in the graph. The modes of each component can be identified clearly on the spectra. This example illustrates the potential of SERS for all applications that require identification and characterization of mixtures. All the spectra in Figure 5 were acquired with analytical-grade Raman systems.
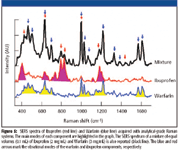
Figure 5
An example of potential applications of SERS in industrial chemistry is shown in Figure 6. SERS spectra of the copolymer poly(methyl methacrylate–co-ethyl acrylate), where the ethyl acrylate is below 5% w/w, have been measured in toluene solutions at different concentrations. The main vibrational modes of the two blocks within the polymer can be identified in the spectra. None of these solutions can be detected by standard Raman at these concentrations, either in liquid or evaporated on nonenhancing substrates.
Conclusions
Through the introduction of commercially available reproducible substrates, SERS is finally demonstrating its maturity and potential for routine analytical applications. High sensitivity (> 106 ) and reproducibility (< 5%) of the texture surfaces can now be achieved by exploiting a combination of photonic crystal design and semiconductor fabrication processes. Volume manufacturing has made the commercialization of such reproducible substrates viable at competitive costs.
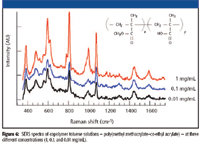
Figure 6
Different aspects of the SERS potential for applications in different areas have been illustrated. Illicit drugs detection and mixtures identification have shown how SERS can be sensitive and specific at physiological concentrations. The increased sensitivity of SERS allows affordable analytical-grade instrumentation to be used. Low-power lasers and low magnification optics are suitable to acquire SERS spectra in very short acquisition times (typical ~10 s). This approach is seeding the integration of SERS with other existing analytical techniques to achieve the ultimate capabilities of sensitivity, specificity, selectivity, and quantitation.
Caterina Netti is an applications manager and Helen Stanford is an applications specialist, with Mesophotonics Ltd., Southampton, UK.
References
(1) M.J. Pellettier, Analytical Applications of Raman Spectroscopy (Blackwell Science, Boston, Massachusetts, 2005).
(2) M. Fleischmann, P.J. Hendra, and A.J. McQuillan, J. Phys. Chem. Lett. 26, 162 (1974).
(3) D.L. Jeanmaire and R.P. Van Duyne, J. Electroanal. Chem. 84, 1–20 (1977).
(5) M.E. Zoorob et al., Nature 404, 740 (2000).
(6) M.C. Netti et al., Phys. Rev. Lett. 86, 1526 (2001).
(7) N.M.B. Perney et al., Opt. Express 14, 847 (2006).
(8) C.L. Haynes et al., J. Raman Spectrosc. 36, 471 (2005).
(9) G.S. Mandair et al., Proc. SPIE, "Photonics West 2006: Biomedical Optics."

AI-Powered SERS Spectroscopy Breakthrough Boosts Safety of Medicinal Food Products
April 16th 2025A new deep learning-enhanced spectroscopic platform—SERSome—developed by researchers in China and Finland, identifies medicinal and edible homologs (MEHs) with 98% accuracy. This innovation could revolutionize safety and quality control in the growing MEH market.
New Raman Spectroscopy Method Enhances Real-Time Monitoring Across Fermentation Processes
April 15th 2025Researchers at Delft University of Technology have developed a novel method using single compound spectra to enhance the transferability and accuracy of Raman spectroscopy models for real-time fermentation monitoring.
Nanometer-Scale Studies Using Tip Enhanced Raman Spectroscopy
February 8th 2013Volker Deckert, the winner of the 2013 Charles Mann Award, is advancing the use of tip enhanced Raman spectroscopy (TERS) to push the lateral resolution of vibrational spectroscopy well below the Abbe limit, to achieve single-molecule sensitivity. Because the tip can be moved with sub-nanometer precision, structural information with unmatched spatial resolution can be achieved without the need of specific labels.