Low-Frequency and Stokes-AntiStokes Raman Measurements Using a Triple-Spectrometer System
Outstanding stray light rejection performance of a triple-spectrometer system is demonstrated. Low-frequency Raman spectra of solid powder samples, including Stokes-AntiStokes Raman data, as low as 5 cm-? from the excitation line are presented.

Low-frequency Raman spectroscopy is an indispensable analytical tool in multiple areas of scientific research. Single-wall (1) and multiwall (2) carbon nanotubes exhibit radial breathing mode vibrations in the range 150–200 cm-1, which are used to characterize diameter distribution and overall quality of nanotubes as well as influence of external factors. Quality of semiconductor multilayered structures (superlattices) is assessed by observing folded acoustic modes in the range 0–100 cm-1 (3). The relaxation modes in liquids, binary mixtures, and solutions, in the range 0–400 cm-1, help to determine their dynamic structure (4).
While general-purpose Raman instruments incorporating a single-stage spectrograph and a notch filter to reject the laser line are sufficient for many applications, they have limitations for the aforementioned high-end research applications in terms of resolution and low-frequency data collection. With such systems, it is virtually impossible to collect Raman data at frequencies less than 50 cm-1 from the laser line, and their resolution limits the mount of structural information that can be determined over a wider wavelength range. In this article, we introduce a triple-spectrograph system that provides the capability to obtain low-frequency Raman data with extremely high resolution.
Experimental Conditions
The experimental setup consisted of a triple-spectrograph system (TriVista 555 from Princeton Instruments/Acton, Trenton, New Jersey) with three stages of 500 mm focal length each and a triple spectrograph system (TriVista 557 from Princeton Instruments/Acton) with the first two stages of 500 mm and the third stage of 750 mm focal length. For the best stray light rejection, the system was used in subtractive mode where the first two stages were limiting the spectral bandpass and rejecting the excitation line, while the third stage was performing signal dispersion. The sample was excited by a 488- and 532-nm CW laser of 60–100 mW typical power. Ruled (900 g/mm) and holographic (1800, 2000, 2400 g/mm) gratings optimized for the visible range were used. Experiments were performed using back-illuminated CCD detectors (PIXIS:400B, SPEC-10:400B, and SPEC-10:2KB from Princeton Instruments/Acton) with different array configurations. The spectra were fully vertically binned to maximize the sensitivity. A 135° scattering scheme was used for all Raman measurements. Powder samples exhibiting low-frequency Raman modes; 99%+ molybdenum(VI) oxide (MoO3), 99.999% elementary sulfur (S) and 99% L-cystine ([-SCH2CH(NH2)CO2H]2) were used. All sample substances were obtained from Fisher Scientific, Pittsburgh, Pennsylvania.
Results
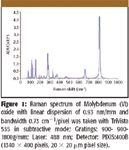
Solid powder samples, such as molybdenum(VI) oxide (MoO3), sulfur (S), and L-cystine are known for heavy dissipation of the excitation laser beam and producing strong stray light detrimental for low-frequency Raman measurements. These samples were chosen to demonstrate the capabilities of the triple spectrometer system. Figure 1 shows a 0–1000 cm-1 spectrum of molybdenum(VI) oxide, which was taken with only 1-s integration time. Even with such a short integration time, the high-quality Raman spectrometer system obtained a signal-to-noise ratio (S/N) of about 30 in the low-frequency domain 80–200 cm-1 and an S/N in excess of 150 for the 800–850 cm-1 spectral region.

Figure 1
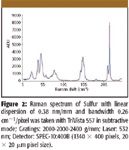
A sulfur sample measured with extremely high resolution, over the narrow spectral range of 5–250 cm-1 in the low-frequency domain, is shown in Figure 2. With only 50 μs exposure time, it was possible to obtain a Raman signal with an S/N ratio over 10 and it is possible to distinguish the relevant spectral bands below 30 cm-1.

Figure 2
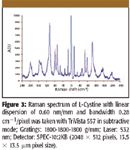
Finally, Figure 3 shows the Stokes-AntiStokes Raman data of L-Cystine in the low-frequency domain of -240 to +240 cm-1. The laser line was blocked by positioning the thin needle in the center of the intermediate slit between the first and the second stages. To preserve high-spectral resolution, a CCD detector of different format with almost half of the pixel size was used.
Conclusions
Even on solid powder samples, it was possible to obtain low-frequency Raman spectra including Stokes-AntiStokes Raman data with high S/N, as close as 5 cm-1 to the excitation line. This demonstrates the exceptional stray light rejection and excellent sensitivity that is possible with a triple spectrometer system.
Besides its primary usage as a Raman system in subtractive mode, the system used in this experiment also is capable of switching to additive mode, simply by changing software settings. In additive mode, the linear dispersion of all three stages is added, so that one can achieve a very high resolution and analyze individual peak shapes and other narrow spectral features.
This type of system also allows the first two stages to work as a double monochromator and the third stage as a single spectrograph, giving the ultimate experimental flexibility. In such a configuration, the system can be used for photoluminescence and fluorescence applications, where the double spectrograph acts as a tunable excitation source and the single spectrograph is used to disperse the emission signal.

Figure 3
References
(1) M.N. Iliev and A.P. Litvinchuk, Chem. Phys. Let. 316(3–4), 217–221 (2000).
(2) C.Y. Wang, C.Q. Ru, and A. Mioduchowski, J. Appl. Phys. 97, 024310 (2005).
(3) D.C. Houghton and D.J. Lockwood, J. of Crystal Growth 81(1–4), 434–439 (1987).
(4) Y. Amo, Y. Inadachi, and Y. Tominaga, J. Chem. Phys. 119(20), 10801–10805 (2003).
Reinhold Shäfer and Oliver Rohm are with S&I GMBH, Anröchte, Germany.
Dmitri Koulikov, Marc Neglia, and Antoinette O'Grady are with Princeton Instruments/Acton, Trenton, New Jersey.

Nanometer-Scale Studies Using Tip Enhanced Raman Spectroscopy
February 8th 2013Volker Deckert, the winner of the 2013 Charles Mann Award, is advancing the use of tip enhanced Raman spectroscopy (TERS) to push the lateral resolution of vibrational spectroscopy well below the Abbe limit, to achieve single-molecule sensitivity. Because the tip can be moved with sub-nanometer precision, structural information with unmatched spatial resolution can be achieved without the need of specific labels.
Tomas Hirschfeld: Prolific Research Chemist, Mentor, Inventor, and Futurist
March 19th 2025In this "Icons of Spectroscopy" column, executive editor Jerome Workman Jr. details how Tomas B. Hirschfeld has made many significant contributions to vibrational spectroscopy and has inspired and mentored many leading scientists of the past several decades.


