Bioreactor Fermentation Monitoring with Raman Spectroscopy

Biotechnology, the production of chemicals of choice using microorganisms, is an application very well suited to monitoring with Raman spectroscopy. Raman’s high selectivity and low sensitivity to the solvent, water, can be employed using a simple immersion probe setup to monitor and more tightly control these processes.
Experimental
We used a Wasatch Photonics Raman spectrometer at 785 nm, fiber-coupled to an external laser and an immersion probe inserted into a stirred solution of 50 g/L glucose and 2 g/L yeast. The fermentation was observed over 14 h, with spectra collected every 2 min at 5 s integration time and an average of 20 scans.
We performed a separate multivariate calibration for glucose in the presence of yeast over the concentration range from 0 to 50 g/L glucose.
Results and Discussion
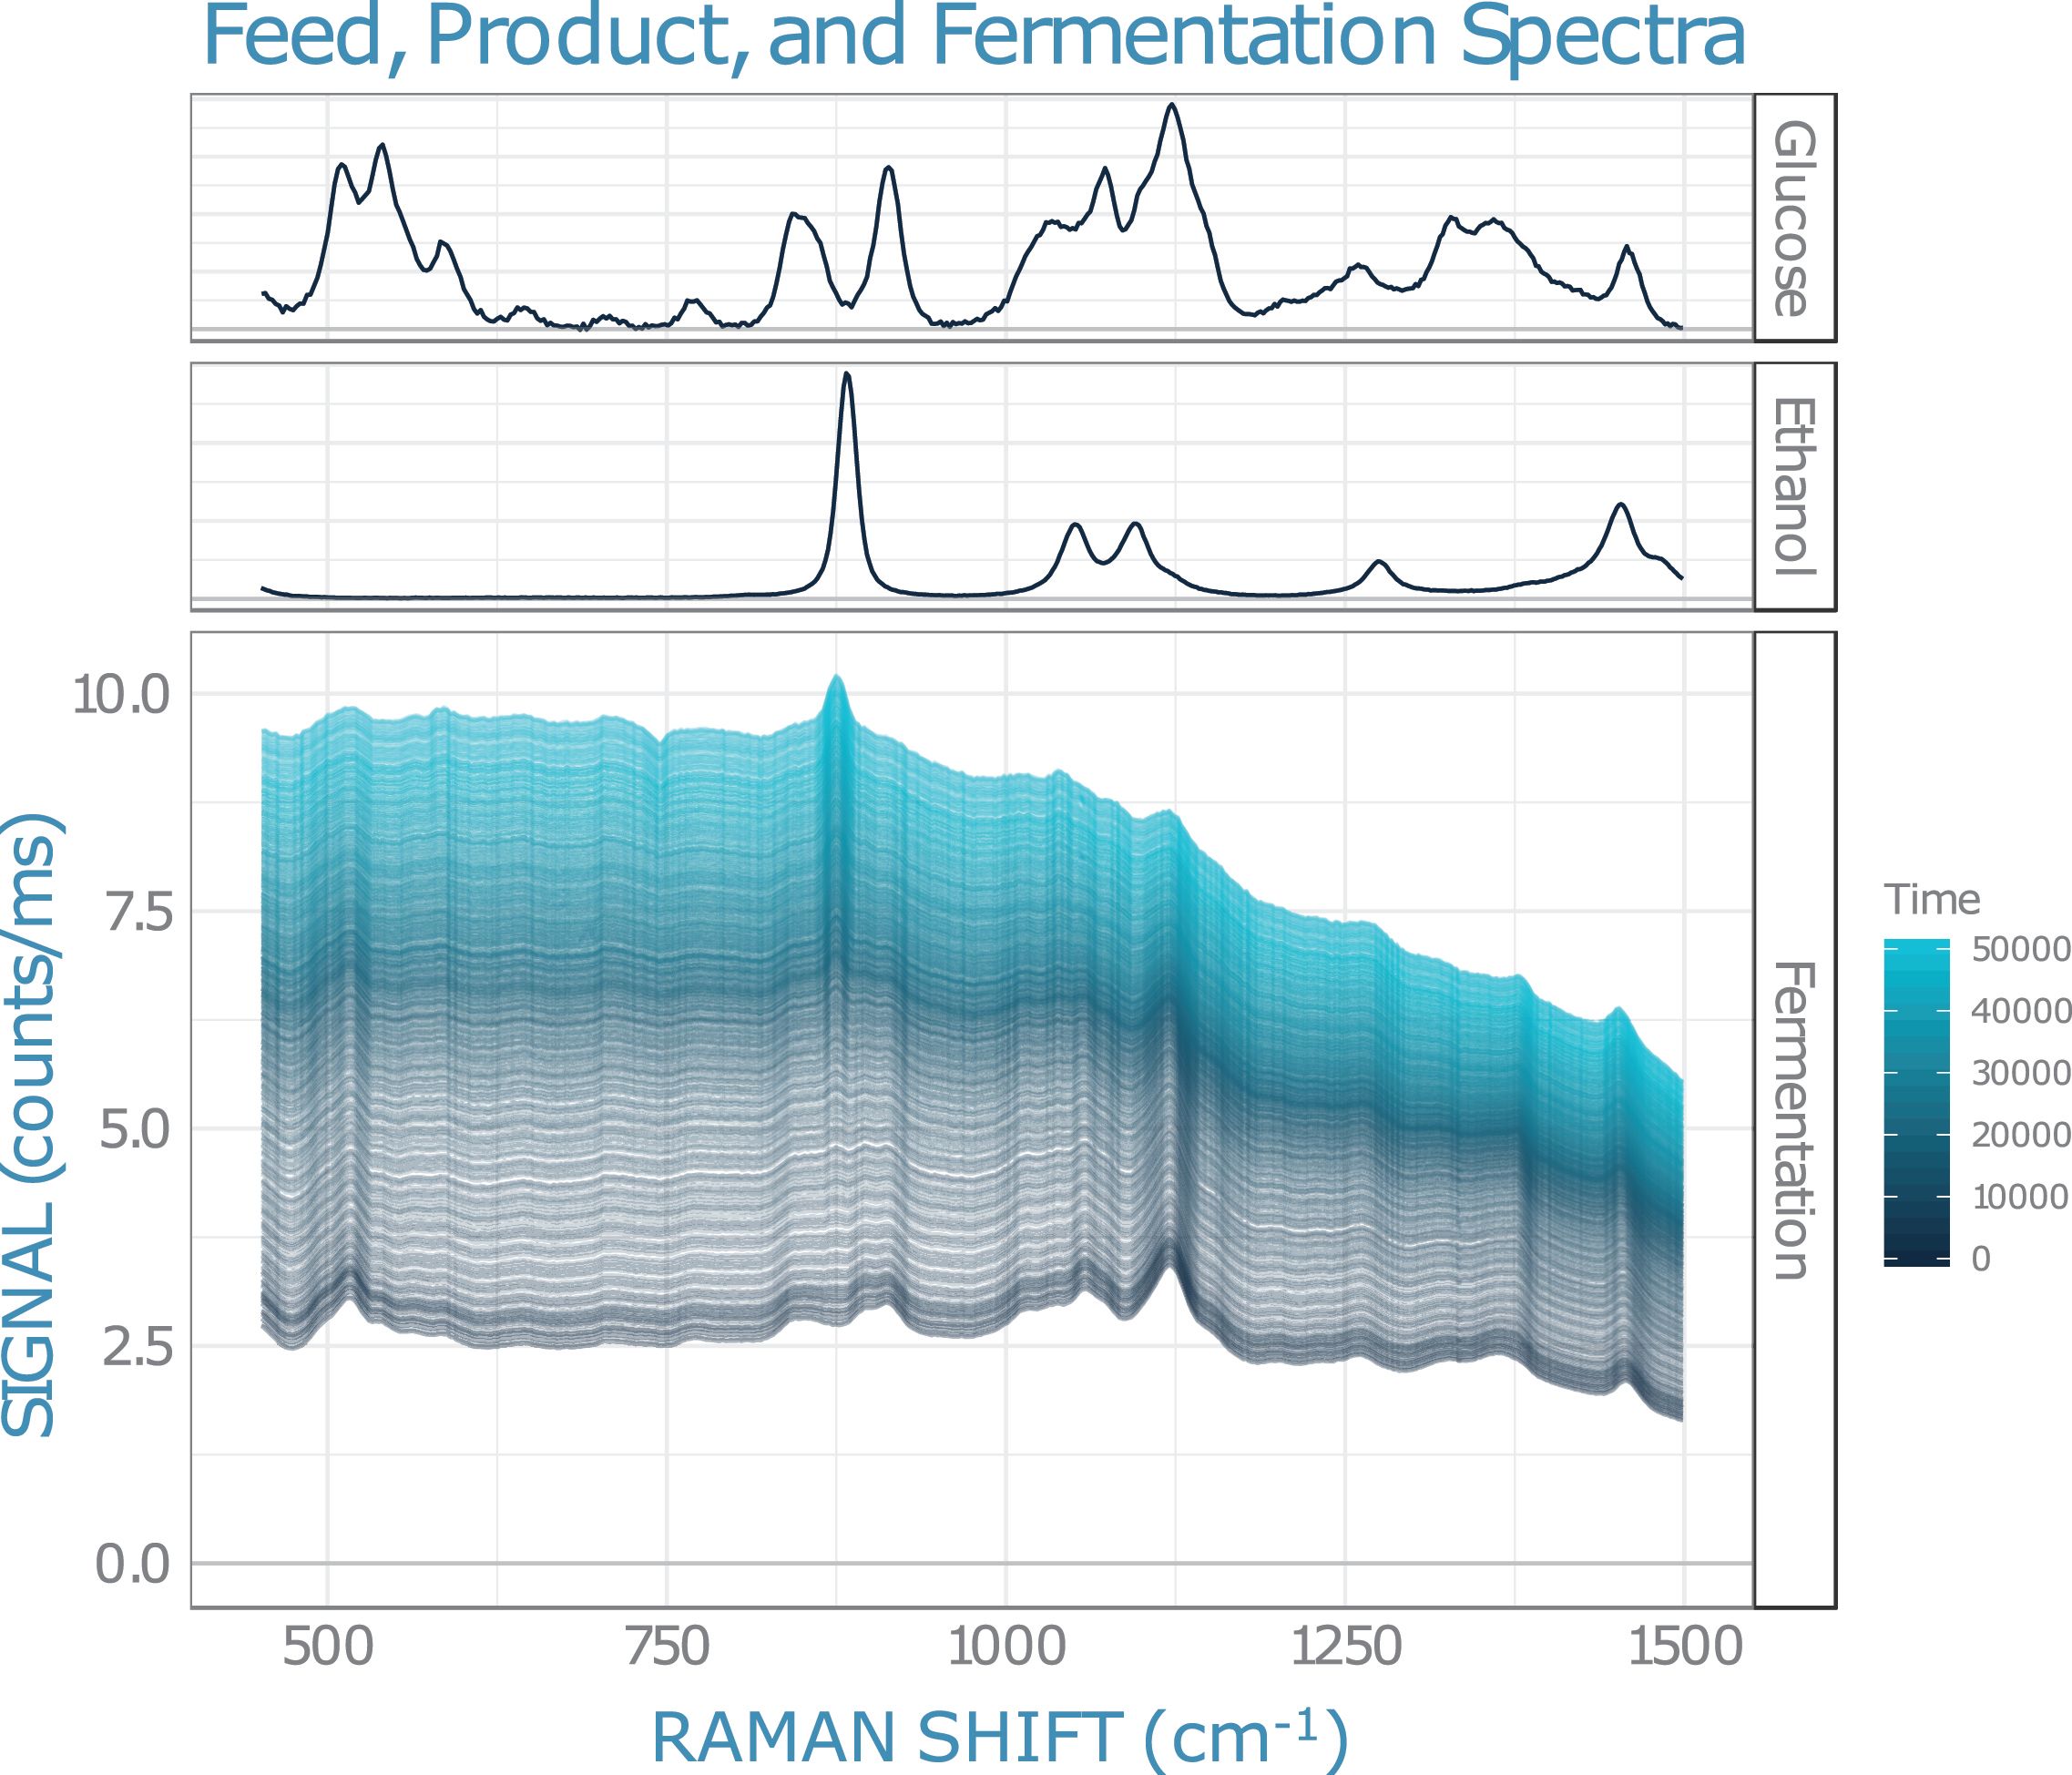
We correlated the glucose calibration spectra with the concentration using partial least squares (PLS) regression, yielding a prediction error of 0.7 g/L in the presence of yeast and about 0.1 g/L without yeast. The Raman spectra recorded during the fermentation are shown in Figure 1 together with the pure Raman spectra for the main reactant and product, glucose and ethanol.
Applying the PLS glucose model yielded the prediction of the glucose concentration, which showed a slow decrease with a noise level of below 1 g/L glucose.
Figure 1: Raman spectra recorded during glucose fermentation over 14 h, with time (in seconds) indicated by the color, together with the reactant and product spectra. The glucose peaks around 1100 cm-1 decrease, while the ethanol peak at 900 cm-1 and the overall yeast background increase.

Principal component analysis (PCA) identified the main spectral trends during the process. The first principal component expressed the remaining glucose level, while the second component captured the simultaneous decrease of glucose (spectrum negative in the corresponding loading) and increase of ethanol (positive spectrum in the loading). The corresponding PCA score therefore allowed the progress of the reaction to be summarized in a single coordinate, and to compare batch to batch.
Additional reaction products could be discovered in the higher principal components; due to its specificity, Raman allows identification. For example, the fourth principle component for the fermentation spectra showed the production of dissolved carbon dioxide. Likewise, unwanted side-products could be discovered and identified during the fermentation.
Conclusion
Using an immersion probe and a Wasatch Photonics Raman spectrometer at 785 nm, we continuously monitor the fermentation of glucose with yeast. Despite the significant yeast background, multivariate regression yields the glucose concentration, while principal component analysis projects the spectra onto a reaction progress coordinate and allows deep insight into the details of the fermentation. The same approach could be used for other processes to harness the strength of Raman spectroscopy.
Wasatch Photonics
808 Aviation Parkway, Suite 1400, Morrisville, NC 27560
tel. (919) 544-7785
Website: www.wasatchphotonics.com

Advanced Raman Spectroscopy Method Boosts Precision in Drug Component Detection
April 7th 2025Researchers in China have developed a rapid, non-destructive Raman spectroscopy method that accurately detects active components in complex drug formulations by combining advanced algorithms to eliminate noise and fluorescence interference.
A Proposal for the Origin of the Near-Ubiquitous Fluorescence in Raman Spectra
February 14th 2025In this column, I describe what I believe may be the origin of this fluorescence emission and support my conjecture with some measurements of polycyclic aromatic hydrocarbons (PAHs). Understanding the origin of these interfering backgrounds may enable you to design experiments with less interference, avoid the laser illuminations that make things worse, or both.