Characterizing Colored Fibers by FT-IR and Raman Spectroscopy
Characterization of trace evidence is an invaluable asset to the forensic scientist in solving crimes. In particular, the characterization needs to be specific enough so that the identification of material collected at a crime scene can be identified forcefully with material collected from a suspect's environment. Colored microscopic fibers can be discovered easily at a crime scene and collected for analysis. The question is what physical tool can be used to characterize these fibers. Fourier transform–infrared (FT-IR) spectroscopy is a well-established method for characterizing trace evidence. In this article, FT-IR, FT-Raman, and dispersive Raman spectra of a series of prepared fibers will be evaluated for their information content.
Textiles and other fibrous materials can be colored by several methods. Most commonly, the yarns are dyed, in which case, the colorants are dissolved and then bind to the molecules of the yarns. In the case of pigmented fibers, the colorant is ground and then dispersed in the polymer. However, it is difficult to extract the pigment, making it essential to be able to measure it in the intact fiber. Of course, this would have the additional advantage of not modifying or destroying trace evidence.
We have chosen to study pigmented rather than dyed fibers initially because pigmented fibers are more unique, and therefore, provide stronger evidence. Pigments can be either organic or inorganic. Inorganics such as iron oxides, azurite, and malachite are possible. In the case of organic materials, there are big aromatic molecules.
Infrared (IR) spectroscopy has the advantage of being used universally for molecular characterization, with the microscopy now being a convenient sampling tool. However, it tends not to be terribly sensitive to components at low concentrations. This study was designed to determine how effective Fourier transform-IR (FT-IR) examination of pigmented fibers would be because the colorants usually are added at fairly low concentrations.
Raman spectroscopy is a complimentary tool for molecular characterization, but can have the same issues of sensitivity to low concentrations. The same fibers that were examined by FT-IR also were examined by Raman spectroscopy. The results will show that there is an enormous difference in the quality of the results of FT-Raman versus dispersive Raman.
Samples
Fibers several hundred micrometers in diameter were produced at John Jay College of Criminal Justice (New York, New York) from a glue stick and were mounted on a microscope slide for examination. The following pigments were dispersed in these fibers at the 5% level:
Graphtol Blue, Graphtol Bordeaux, Graphtol, Fire Red, Graphtol Red F3RK, Graphtol Yellow, PV Fast Blue A2R, PV Fast Blue A4R, PV Fast Blue BG, PV Fast Violet, PV Fast Red HGR, PV Fast Orange, and Novoperm Yellow.
In addition, the concentration of Novoperm Yellow and PV Fast Orange was varied between 1 and 10% in a series of fibers to determine the detection level for these measurements. It should be noted that in real samples, it is unlikely that pigments would be loaded at more than the 1% level to color the fibers.
Results
FT-IR measurements were made on an FT-IR system (IlluminatIR II, Smiths Detection, Danbury, Connecticut) with a ATR diamond objective (ContactIR, Smiths Detection). Spectra of the 5% samples are shown in Figure 1. These spectra were recorded with 128 scans at 4 cm-1 resolution. The spectral traces have been color-coded to indicate the fiber type, with the spectrum of the uncolored fiber coded in black. Figure 1a shows the full spectra, 1b the fingerprint region, and 1c the CH region. It is clear that most of the spectral features are due to the fiber itself rather than the pigment. Some small indications of the pigments can be seen between the larger glue bands in the fingerprint region of the spectra (Figure 1b).

Figure 1: (a) FT-IR spectra of fibers synthesized from a glue stick and impregnated with pigments at the 5% level. From top to bottom the fibers contained PV Fast Violet, PV Fast Blue A4R, PV Fast Blue A2R, Graphtol Blue, Graphtol Yellow 3GP, Novoperm Yellow, PV Fast Orange, Graphtol Fire Red, PV Fast Red HGR, Graphtol Bordeaux, and a non-colored fiber. To simplify inspection of these spectra, they have been color-coded to the fiber color. (b) Fingerprint range of FT-IR spectra shown in Figure 1a. (c) CH range of FTIR spectra shown in Figure 1a.
Figure 2 shows the results of the FT-Raman measurements. These spectra were recorded on an FT-Raman module (ThermoNicolet NXR , Thermo Scientific, Madison, Wisconsin) with 4 cm-1 resolution, gain of 8 on an InGaAs detector, and 64 scans, which took about 2.25 min. Usually, the power level was 0.5 W, but when the sample was observed to be melting, the power was reduced by a factor of 2.

Figure 2: FT-Raman spectra of same fibers as shown in Figure 1. Color coding indicates the identity of the sample type.
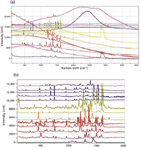
The essential interest in using Raman to examine colored samples is its potential sensitivity to the colorant, especially at low concentration. The origin of this effect is the resonant condition — that is, the excitation laser can be close to the electronic transition producing the color, and therefore couples to those molecules much more effectively. Enhancement factors can be as large as 106. However, the FT-Raman spectra are excited with a laser operating at 1064 nm, which is far from the visible transitions, so it was anticipated that we would not be in resonance Raman (RR) conditions, and the spectrum would show substantial contributions from the fiber material rather than the colorant. The spectra in Figure 2 show that this is not the case. The spectrum in the fingerprint region (<1800 cm-1 ) is dominated by the pigments, due to preresonance. Inspection of the spectra indicates that they do enable differentiation of pigments in the 1000–1750 cm-1 region.

Figure 3: Dispersive Raman spectra of pigmented fibers excited at 785 nm. From top to bottom, the fibers were PV Fast Violet, PV Fast Blue, A4R (OD = 3), PV Fast Blue A2R (OD = 3), PV Fast Blue BG (OD = 2), Graphtol Blue (OD = 3), Graphtol Yellow 3GP, Novoperm Yellow, PV Fast Orange, Graphtol Fire Red, Graphtol Red F3RK (OD = 0.3), PV Fast Red HGR (OD = 2), Graphtol Bordeaux (OD = 1), and a noncolored fiber.
Figures 3–5 show the dispersive Raman spectra of the same samples recorded with lasers at 785, 633, and 532 nm, respectively, recorded on a confocal Raman microscope (LabRAM Aramis, HORIBA). The 785-nm spectra go only to 2000 cm-1 because the detector sensitivity is dropping farther out into the spectrum. The laser power levels at the sample (with no neutral density filter) were, respectively, about 100, 7, and 15 mW. A 100 × LWD objective was used to acquire the spectra (NA = 0.8, 3.4 mm working distance). Spectral acquisition times varied but were all in the range of 30 s–3 min.

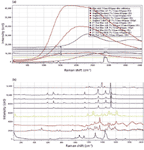
Figure 4: (a) Dispersive Raman spectra of pigmented fibers excited at 633 nm. From top to bottom, the fibers were PV Fast Violet (OD = 2), PV Fast Blue A4R (OD = 0.6), PV Fast Blue A2R (OD = 2), PV Fast Blue BG (OD = 2), Graphtol Blue (OD = 2), Graphtol Yellow 3GP (OD = 2), Novoperm Yellow, PV Fast Orange, Graphtol Fire Red (OD = 1), Graphtol Red F3RK (OD = 0.3), PV Fast Red HGR (OD = 1), Graphtol Bordeaux (OD = 1), and a noncolored fiber. (b) Same spectra as Figure 4a, after being stripped of the fluorescence background and displayed with comparable intensities in the Raman bands.
The Raman spectra demonstrate several phenomena. For a start, each sample will behave differently at the various available laser wavelengths. For example, if a sample is red, it absorbs in the green, so it is expected that there will be more laser heating with the green (532-nm) laser than either of the red lasers. When there is laser heating, which can at least melt the fiber but can also change it chemically, a neutral density filter must be introduced to reduce the laser power. The figure legends indicate which spectra required neutral density filters. Secondly, because there is an optical absorption, there is a high probability that there will be fluorescence, which of course interferes with the Raman spectra. So we have plotted full spectra as recorded, and then the fingerprint spectra after fluorescence subtraction to evaluate the best conditions for acquiring these spectra. To understand what we are saying, consider again a red fiber. Because it absorbs in the green, if it fluoresces, the emission is expected to be in the green to yellow range of the spectrum — that is, in the Raman range of a spectrum excited at 532 nm. Figure 5a shows intense fluorescence of the spectra of the red fibers, confirming this expectation. In addition, it is clear that the red fibers required the highest optical density for reducing the laser power, as expected.

Figure 5: (a) Dispersive Raman spectra of pigmented fibers excited at 532 nm. From top to bottom, the fibers were PV Fast Violet (OD = 3), PV Fast Blue A4R (OD = 1), PV Fast Blue A2R (OD = 2), PV Fast Blue BG (OD = 2), Graphtol Blue (OD = 2), Graphtol Yellow 3GP (OD = 0.6), Graphtol Fire Red (OD = 3), Graphtol Red F3RK (OD = 2), PV Fast Red HGR (OD = 3), Graphtol Bordeaux (OD = 2), and a noncolored fiber. Note that spectra of Novoperm Yellow and PV Fast Orange are absent because the fluorescence was so high that no Raman spectra could be recorded. (b) Same spectra as Figure 5a, after being stripped of the fluorescence background and displayed with comparable intensities in the Raman bands.
Another interesting comparison is to evaluate Raman spectra recorded with the available laser wavelengths. Figure 6 shows that comparison for PV Fast Violet (bottom) and Graphtol Bordeaux (top). In this case, the color-coding reflects the laser wavelength (532, 633, 785, and 1064 nm). What is reassuring is that the spectral features are almost independent of the laser wavelength. This means that there is less concern about using spectra excited at different excitation wavelengths for identification purposes.

Figure 6: (a) Raman spectra of Graphtol Bordeaux (top) and PV Fast Violet (bottom) recorded with the four available excitation wavelengths. Note that there is a fluorescence background for both samples when excited with the green laser, and that PV Fast Violet also has fluorescence when excited with the red laser. (b) Raman spectra in the fingerprint region of Graphtol Bordeaux (top) and PV Fast Violet (bottom) recorded with the four available excitation wavelengths.
Conclusion
Because vibrational spectroscopy provides high information content that can be exploited in forensics science, FT-IR, FT-Raman, and dispersive Raman spectra of pigmented fibers were recorded. It was found that FT-IR is most sensitive to the fiber matrix, and at 5% loading it sees only small indications of the pigments. While Raman also is normally not sensitive to low concentrations, in this case, the sensitivity is quite high because of preresonance and resonance effects between the laser wavelengths and the pigment absorption. The pigment bands recorded at the four available wavelengths were essentially identical, but the dispersive Raman spectra had fluorescence backgrounds that also can be exploited for identification purposes. In spite of the fluorescence backgrounds and the requirement to reduce the laser intensity to avoid sample modification, the signal-to-noise values of the dispersive spectra were almost always higher than those of the FT-Raman spectra. With the exception of the blue pigments, whose spectra showed only subtle differences, it was found that Raman spectroscopy can differentiate pigments in fibrous trace evidence easily.
John Reffner and Shay Smith are with John Jay College of Criminal Justice, New York, New York. Fran Adar is with Horiba Scientific, Edison, New Jersey.

New Study Provides Insights into Chiral Smectic Phases
March 31st 2025Researchers from the Institute of Nuclear Physics Polish Academy of Sciences have unveiled new insights into the molecular arrangement of the 7HH6 compound’s smectic phases using X-ray diffraction (XRD) and infrared (IR) spectroscopy.
Exoplanet Discovery Using Spectroscopy
March 26th 2025Recent advancements in exoplanet detection, including high-resolution spectroscopy, adaptive optics, and artificial intelligence (AI)-driven data analysis, are significantly improving our ability to identify and study distant planets. These developments mark a turning point in the search for habitable worlds beyond our solar system.
Using Spectroscopy to Reveal the Secrets of Space
March 25th 2025Scientists are using advanced spectroscopic techniques to probe the universe, uncovering vital insights about celestial objects. A new study by Diriba Gonfa Tolasa of Assosa University, Ethiopia, highlights how atomic and molecular physics contribute to astrophysical discoveries, shaping our understanding of stars, galaxies, and even the possibility of extraterrestrial life.