Using FT-IR Microscope ATR Objectives to Resolve Complex Samples
Relying primarily on transmission or reflection techniques, FT-IR microscope and imaging systems often can require tedious sample preparation to obtain representative data from a sample. Conversely, similar to a sample compartment attenuated total reflectance (ATR) accessory, the ATR microscope objective requires no sample preparation as the sample can simply be contacted with the ATR element, or crystal, and then the sample spectra can be collected using the microscope detector. The ATR objectives discussed here are designed to offer simultaneous video observation of the selected sample area during infrared data collection. These ATR objectives provide a unique capability for sample observation and infrared data collection when utilizing a software mapping feature offered with the FT-IR microscopes discussed.
Modern FT-IR microscopes can obtain discrete spectra of specific sample sites to offer information about the individual components within a multicomponent sample (1). Mapping experiments utilizing an FT-IR microscope can provide multiple spectra from an even larger area, offering data about the spatial location of the components in a multicomponent sample as well as the component spectra (2). Mapping data obtained from attenuated total reflectance (ATR) objectives also can provide similar data as acquired using transmission or reflection methods, but without the sample preparation required for transmission or reflection experiments. However the mapping experiment is performed, the stage must be moved to reposition the sample with respect to the microscope aperture and ATR objective. In some cases, the spatial distribution of a multicomponent sample cannot be differentiated easily and one obtains a spectrum of the multiple components, no matter the size selected for the microscope aperture. In addition, a difficulty often encountered with ATR objectives is that users are not assured of proper contact of the ATR element with the sample. Without the ability to view the area of the sample in contact with the ATR crystal element, users are thus unable to apply the aperture to obtain data selectively from a specific sample area. In contrast, the ATR objectives used here allow a user to directly visualize the contact of the sample with the ATR objective. The user observation of the "wetting" of the ATR crystal (Figure 1, left to right) ensures that adequate contact of the sample with the ATR crystal element is obtained and users now have the ability to select a specific sample area within the crystal contact area for data collection.

Figure 1: Video images obtained during contact of the ATR objective crystal with a colored vinyl tape sample. As the sample is raised to the ATR objective, one can clearly observe the contact of the sample with the ATR crystal area.
In addition, conventional ATR objectives require that the center of the ATR crystal area come in contact with the sample utilized to obtain an infrared spectrum, the microscope aperture is used to "select" the center portion of the total ATR contact area with the sample to select a specific portion of the sample. While this works fine for the majority of samples, in the case of a multicomponent sample (Figure 2), the data collection method can result in a spectrum that contains contributions from all three components in the sample matrix. Alternatively, users can try to collect multiple ATR spectra, moving the sample to "center" the component of interest to the ATR objective element, but this can still result in spectra with contributions from the other components in the matrix.
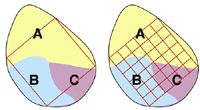
Figure 2: Comparison of standard microscope ATR objective data collection (left) vs. IQ Mapping (right) with an ATR objective. The different colors represent the different components in the sample.
The IQ mapping feature of one such microscope (JASCO IRT-5000/7000, Easton, Maryland) utilizes movable mirrors in the optical train of the microscope system to allow data collection from anywhere within the optical focal plane provided by the Cassegrain objective or, in the case of the ATR objective, anywhere within the total contact area provided by the ATR crystal. In Figure 2, a grid (lattice) map is performed for the sample area in contact with the ATR crystal and individual spectra collected of the various components. In this manner, one can collect spectra from either a single point or multiple points on the sample, or a line or grid map of the sample can be performed, all without moving the ATR objective or the sample stage. By optimizing the microscope aperture and utilizing this feature, the total ATR objective–sample contact area is utilized to collect multiple, individual spectra of the sample. These spectra can provide higher spatial resolution data from the sample due to the magnification of the ATR objective, and provide data that are specific to the different components of the sample matrix. The resulting spectral matrix from this ATR mapping can be used to provide spectra of the individual components without additional data processing as well as to define the spatial orientation and dimension of the components within the contacted sample area using a "false-color" intensity map based upon absorption peaks specific to the multiple components (Figure 3). As a result, the combination of the ATR objective and the mapping capability can provide unique advantages for the collection of spectral data from a complex sample.
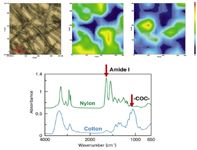
Figure 3: ATR IQ Mapping of nylonâcotton blend fabric. Upper left: Video image of fabric; center: color image map of the Amide I absorption for the nylon fibers; right: image map of the C-O-C stretch of the cotton fibers; bottom: individual spectra selected from the mapping matrix demonstrating fiber-specific spectra of nylon and cotton fibers.
Experimental
A JASCO IRT-7000 FT-IR microscope system (JASCO) was coupled to an FT/IR-6300 (JASCO) and used for all experiments. An ATR-5000-SS objective (JASCO) (equipped with a ZnS crystal element) was utilized to obtain the data displayed here. The IRT-7000 microscope includes an auto-XYZ mapping stage, a medium-band, single-point mercury-cadmium-telluride (MCT) detector and a 16-element linear-array MCT detector for rapid imaging applications. The data collected here utilized only the single-point MCT detector. The ATR-5000-SS ATR objective, offering both "View" and "ATR" modes, was mounted on the interchangeable objective mount on the four-position microscope objective carousel and used for video capture and infrared data collection. The View mode for the ATR objective provides a clear video picture of the sample and the ATR mode moves the crystal down into the active data collection position. All data were collected using 8-cm-1 resolution with scan accumulations of 8–32 scans per ratioed spectrum.
Results and Discussion
Figure 3 illustrates the analysis of a cotton–nylon fabric blend. The upper left portion of the figure is a video picture of the ATR element in contact with the fiber sample. A 25 μm × 25 μm aperture was used to collect the mapping data from the sample, and the accumulated spectra were collected with 32 accumulations per spectrum. The upper center and upper right figures demonstrate the false-color images for each fiber component based upon the peaks highlighted in the individual nylon and cotton spectra (Figure 3, bottom). The use of the mapping capability to obtain a matrix map of the sample contact area provides data specific to the individual fibers, instead of a composite spectrum containing absorptions of both fiber components. The spectral data obtained was used to produce a false-color image demonstrating the location and distribution of the individual fibers as well as providing spectra specific to the individual fibers without further data processing such as spectral subtraction.
Figure 4 illustrates the use of the multipoint sample selection capability of the microscope. A sample of fingernail polish was "painted" onto a section of a microscope slide and allowed to dry. After contact of the ATR objective's crystal element with the enamel surface, explicit sample points were selected to obtain infrared spectra specific to the enamel "base" and the glitter particles contained within the polish sample. The upper left figure is a video capture of the sample before contact of the sample with the ATR crystal, the lower left a video capture of the sample through the ATR crystal. A 30 μm × 30 μm aperture was used to collect 32 accumulations per spectrum for the selected sample points. This experiment illustrates the utility of sample observation during contact and the selectivity of data collection that can be achieved using the mapping capability of the microscope. In this example, the glitter particle was found to be a modified silicate (right, lower), with little to no contribution of the fingernail polish enamel component (right, upper).
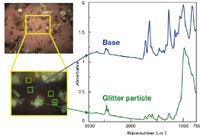
Figure 4: Multipoint data collection of a fingernail polish sample. Top left: macro video image of the polish sample (16X Cassegrain objective); bottom left: video image obtained through the ATR objective crystal with selected sample sites (blue boxes); right: spectra collected from selected sample sites.
In Figure 5, a sample of lip gloss was examined that also contained glitter particles. In this case, the lip gloss was extremely sticky and the ATR crystal element required cleaning after every sample contact with the ATR crystal element. The upper left video image was obtained before contact of the sample with the ATR objective, and the lower left video image was obtained during contact of the sample with the ATR objective. Selected sample points within the ATR objective contact area provided the spectra displayed on the right. Utilizing the mapping feature and a 20 μm × 20 μm aperture, the individual spectra of the lip gloss and the glitter particle were obtained with only 32 accumulations for each spectrum. Again, the glitter particle was found to contain a silicate component, distinctly different from the lip gloss material itself. While these same data could be gained by obtaining a spectrum of the lip gloss, then subtracting this component from the lip gloss plus glitter spectrum, the multipoint data collection method allowed immediate collection of the separate spectra without further data processing and a single contact of the sample with the ATR objective.
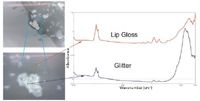
Figure 5: Multipoint data collection of a lip gloss sample Top left: macro video image of the lip gloss sample (ATR-5000-SS objective); bottom left: video image obtained through the ATR objective crystal with selected sample sites (green boxes); right: spectra collected from selected sample sites.
In Figure 6, the line of print from a barcode label was analyzed with the ZnS ATR objective using the multipoint mode of the microscope. The upper left figure was obtained using the View mode of the ATR objective, and the lower left is the video capture of the sample contact through the ATR objective. The ability to visually observe the contact of the label with the ATR objective was used to selectively obtain spectra of the barcode ink and the polymer coating of the label itself. The individual spectra were collected using a 30 μm × 30 μm aperture and 16 accumulations per spectrum. No further data processing was necessary to obtain the spectra of the barcode ink (upper right) and the label coating (lower right) as displayed in the figure.
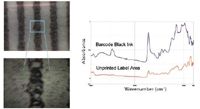
Figure 6: Multipoint data collection of a barcode label. Top left: macro video image of the bar code label sample (ATR-5000-SS objective); bottom left: video image obtained through the ATR objective crystal with selected sample sites (green boxes); right: spectra of the bar code and label coating collected from the selected sample sites.
Figure 7 outlines the analysis of the printing on a business card using the grid mapping capability of the microscope system. The upper left portion of the figure is the video capture of the dot over an "i" in the name printed on the business card; the lower left portion is the video capture of the sample contact as observed through the ATR crystal. An aperture of 30 μm × 30 μm was used to collect the eight accumulations for each sample spectrum collected in the grid map of the sample. The printing ink demonstrates a distinctly different spectrum from the cellulose spectrum of the business card itself. The mapping capability allowed the collection of the spectra specific to the ink and the cellulose as obtained with only a single contact of the sample with the crystal, and there was no need to obtain the two distinct spectra by repeating the experiment twice for two different contact areas of the sample.
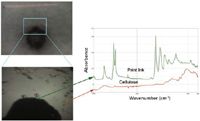
Figure 7: Grid map of the printing on a business card. Top left: macro video image of the business card sample (ATR-5000-SS objective); bottom left: video image obtained through the ATR objective crystal; right: selected spectra collected from the grid mapping of the sample.
Conclusions
The use of ATR objectives for FT-IR microscope systems relieves users from extensive sample preparation for transmission or reflection analysis of samples, increasing the utility of the FT-IR microscope. The ATR objective provides users with the ability to ensure proper contact of the sample with the ATR crystal element as well as the ability to select specific sample sites. The mapping capabilities of the microscopes described here greatly enhance the performance of the ATR objective with the ability to selectively obtain spectra specific to individual components within a multicomponent sample.
Richard A. Larsen, is with Jasco Corp., Easton, Maryland. Ken-ichi Akao, Jun Koshoubu, and Hiroshi Sugiyama are with Jasco Corp., Hachioji, Japan.
References
(1) P. L. Lang and L. R. Richwine, in Practical Sampling Techniques for Infrared Analysis, P.B. Coleman, Ed., (CRC Press, Boca Raton, Florida, 1993), pp. 145–163.
(2) K. Krishnan, J. R. Powell, and S. L. Hill, in Practical Guide to Infrared Microspectroscopy, H.J. Humecki, Ed. (Marcel Decker, New York, New York, 1995), pp. 85–110.
New Study Provides Insights into Chiral Smectic Phases
March 31st 2025Researchers from the Institute of Nuclear Physics Polish Academy of Sciences have unveiled new insights into the molecular arrangement of the 7HH6 compound’s smectic phases using X-ray diffraction (XRD) and infrared (IR) spectroscopy.
Exoplanet Discovery Using Spectroscopy
March 26th 2025Recent advancements in exoplanet detection, including high-resolution spectroscopy, adaptive optics, and artificial intelligence (AI)-driven data analysis, are significantly improving our ability to identify and study distant planets. These developments mark a turning point in the search for habitable worlds beyond our solar system.
Using Spectroscopy to Reveal the Secrets of Space
March 25th 2025Scientists are using advanced spectroscopic techniques to probe the universe, uncovering vital insights about celestial objects. A new study by Diriba Gonfa Tolasa of Assosa University, Ethiopia, highlights how atomic and molecular physics contribute to astrophysical discoveries, shaping our understanding of stars, galaxies, and even the possibility of extraterrestrial life.