A Diamond ATR-FTIR Study of Various Medicinal Cannabinoid Formulations
Application Notebook
Cannabinoids and opiates have been used for medicinal purposes for thousands of years for relief of pain and seizures. In the early 1900s, an opioid epidemic resulted in restrictions on opiates. Years later, tighter restrictions were also placed on marijuana-one source of cannabinoids-although medical marijuana and cannabinoids have become increasingly legal and available in some states in recent years. The past few years have again seen an increase in opioid overdoses and even tighter regulation to prevent abuse, addiction, and possible deaths. Despite advances in medicine in the interim, there are few therapeutic alternatives to the opioids with the notable exception of cannabinoids.
At least 100 cannabinoids have been found to have medicinal properties. The most commonly known are CBD (cannabidiol) and THC (tetrahydrocannabinol). These are extracted from hemp and marijuana plants, which are botanically distinct cannabis species. CBD extracted from hemp is available without prescription as a supplement, and contains no THC. Cannibinoids extracted from marijuana include CBD as well as some THC component, and hence are highly regulated because of the psychoactive properties of THC. CBD does not appear to have any intoxicating effects such as those caused by THC. Here, several formulations of cannabinoids are examined using mid-infrared diamond ATR spectroscopy.
Experimental
Infrared spectra were collected on an FT-IR spectrometer equipped with the Harrick DiaMaxATR™ single-reflection high-throughput diamond ATR accessory. The system was purged to remove CO2 and water vapor. Spectra were collected at 8 cm-1 resolution and signal averaged over 32 scans. The spectra were referenced to the clean ATR crystal.
Four formulations were investigated. The capsules and tablets were cut open to examine the enclosed components. Two of the samples were from hemp: Plus+CBD Oil™ softgels (liquid; 5 mg CBDA/CBD in extra virgin olive oil) and Plus+CBD Oil™ capsules (powder; 10 mg CBA in modified food starch, cellulose, silicon dioxide, and magnesium stearate). The other two were medicinal marijuana from different suppliers, designated here as A (liquid from a gel tablet; 8.5 mg THC, 8.5 mg CBD in coconut oil) and B (paste from a capsule; 0.7 mg THC, 4.3 mg CBD in coconut oil). Small aliquots of the samples were placed on the ATR crystal. Pressure was applied to compress the powdered sample against the diamond.
Results and Discussion
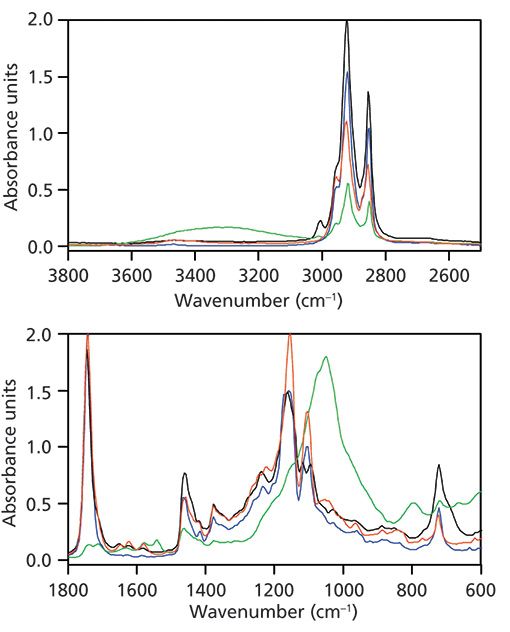
Figure 1 shows the resulting spectra. The two formulations from hemp have a band at 3010 cm-1 which is not present in the marijuana samples. All the samples except the Plus+CBD Oil™ capsules show a weak band at 3477 cm-1 due to a phenol OH stretch. The Plus+CBD Oil™ capsules are the only formulation that contains cellulose and the broader OH stretch from cellulose may be masking the phenol OH band. The Plus+CBD Oil™ capsules also have a strong band at 1047 cm-1 from cellulose. All four samples show the characteristic bands of cannabinoids around 1624, 1581, 1510, 1462, and 1374 cm-1.

Figure 1: Diamond ATR spectra of four medicinally beneficial cannaboid formulations: Plus+CBD Oil™ Softgels (black), Plus+CBD Oil™ Capsules (green), A (red), and B (blue).
Conclusion
The Harrick DiaMaxATR, high throughput, single reflection ATR is effective at revealing spectral differences among the medicinally beneficial cannabinoid formulations available on the market.
Reference
(1) V. de la Asuncion-Nadal, et. al., Talanta 167, 344–351 (2017).

Harrick Scientific Products, Inc.
141 Tompkins Ave., Box 277, Pleasantville, NY 10570
tel. (914) 747-7202, fax (914) 747-7409
Website: www.harricksci.com

New Study Reveals Insights into Phenol’s Behavior in Ice
April 16th 2025A new study published in Spectrochimica Acta Part A by Dominik Heger and colleagues at Masaryk University reveals that phenol's photophysical properties change significantly when frozen, potentially enabling its breakdown by sunlight in icy environments.
Advanced Raman Spectroscopy Method Boosts Precision in Drug Component Detection
April 7th 2025Researchers in China have developed a rapid, non-destructive Raman spectroscopy method that accurately detects active components in complex drug formulations by combining advanced algorithms to eliminate noise and fluorescence interference.