Application of Wavelength-Dispersive X-Ray Fluorescence Spectrometry to Biological Samples
Application Notebook
Wavelength-dispersive X-ray fluorescence (WD-XRF) spectrometry involves the classification and quantification of several kinds of biological samples. Multiple applications of WD-XRF spectrometry are anticipated in the mining industries, nuclear power industry, medical diagnostics, forensics, environmental, and particularly in agricultural studies. Here, we present a concise review of the quantitative measurements performed to classify and quantify the traces of essential and toxic minerals in wheat seed gall nematodes (Anguina tritici), cyperus rotundus rhizomes, gallstones, and kidney stones. Based on the studies reported, WD-XRF was found to be a robust analytical tool that is useful for agricultural studies and for the diagnosis of urological and gastroenterological disorders. This review is aimed at analyzing major and trace levels of heavy and toxic minerals in biological specimens related to agricultural crops (wheat grains and cyperus rotundus) and human diseases (gallstones and kidney stones) and shows some interesting prospects for using WD-XRF spectrometry.
Trace and heavy metal detection in agricultural and biological samples currently is of crucial importance because of the pollution occurring in the environment, particularly in soil and water, which constantly affect human health. Agricultural crops, medicinal herbs, and natural resources used for human benefits are being contaminated by the presence of toxic elements such as lead, arsenic, mercury, chromium, and nickel. These elements then move from soils to plants and then to human beings. They can cause serious diseases such as cancer or stone formation in the human body (gallstones and kidney stones). Hence, a holistic approach is needed to analyze agricultural and biological samples to find the source of these toxic elements and take necessary steps for prevention.
Over the last few decades, the major aim of research in the field of agricultural and biomedical science has been to determine the concentrations of various toxic elements in many agricultural and biological specimens to find the cause of disease for its prevention. X-ray fluorescence (XRF) spectrometry is a versatile tool in many analytical problems. Major, minor, and trace elements can be qualitatively and quantitatively determined in various kinds of samples: metals, alloys, glasses, cements, minerals, rocks, ores, and polymers as well as environmental and biological materials (1). The application of wavelength-dispersive X-ray fluorescence (WD-XRF) spectrometry allows efficient determination of low-Z elements down to even beryllium (Be) without sample treatment with ensured high quality quantitative results. Because of the nondestructive character of X-ray measurement, XRF spectrometry is widely applied for the analysis of art, for example, museum and archeological objects such as manuscripts, paintings, icons, pottery, ancient glasses, ceramics, and coins.
XRF is based on the principle that all elements produce secondary "fluorescent" X-rays of characteristic energy when they are exposed to X-rays of appropriate higher energy. The energy and intensity of the emitted X-rays can then be used to determine elemental composition. In principle, the higher the atomic weight of an element, the higher the energy needed to induce fluorescence and the fluorescence energy. It is also easier to detect fluorescence as the atomic weight of an element increases. Because XRF offers many unique capabilities, it has become the technique of choice for many applications requiring accurate elemental analysis for the purpose of meeting tight specifications at high concentration levels (2). High-performance WD-XRF spectrometry is now being used for the determination of traces in plant materials, biological samples, and geological samples. To fulfill today's requirements for quality data, modern instruments must provide high elemental sensitivities to achieve low detection limits and the best spectral resolution to minimize line overlays. In this article, we discuss the use of WD-XRF spectrometry to analyze trace and heavy metal contents in some agricultural and biological samples.
Materials and Method
The studied infected and uninfected wheat grain samples are shown in Figure 1. Figures 1a, 1b, and 1c are images of uninfected wheat grain, low infection wheat seed galls with Anguina tritici (A. tritici), and high infection wheat seed galls with A. tritici. Microscopic observations revealed the infection in wheat samples with A. tritici and details can be found in the literature (3). Also, the galls have a similar shape to the uninfected grains but are dark brown in color. The studied Cyperus rotundus rhizome (belonging to the family Cyperaceae, which is widely distributed in many tropical and subtropical regions of the world) samples were collected and washed thoroughly to remove all the traces of soils and other possible contaminations. The biological applications and use of Cyperus rotundus can be found in the literature (4). The gallstones and kidney stone samples (5,6) studied using WD-XRF were collected from the Department of Nephrology at Opal Hospital in Varanasi, India.

Figure 1: Photographs of (a) uninfected wheat grain, (b) wheat seed galls (low infection) with Anguina tritici, and (c) wheat seed galls (high infection) with Anguina tritici. Adapted with permission from reference 3.
To analyze the wheat samples, Cyperus rotundus, gallstones, and kidney stones, we used an S8 TIGER WD-XRF spectrometer (Bruker) for the determination of traces in these biological samples. The instrument was optimized to obtain better quantitative results, resolution, reproducibility, and reliability for each element with the best excitation and highest intensity over the whole elemental range. The quantitative measurements of the elemental constituents of kidney stones were performed using the same WD-XRF spectrometer. A 4-kW Rh anode X-ray tube (with a voltage of 60 kV max; and current 170 mA max) equipped with proportional flow counter and scintillation counter detectors was used as the energy source. Exposure time per sample was 20 min. The analyzer crystal LiF220 ensured that, in combination with the 0.23° collimator, the best separation was achieved for adjacent elements. The quantitative determination of major and trace elements was done using Quant-Express software (Bruker), which comprises a unique multipurpose preprepared calibration using certified standards. It automatically created the optimal measurement method to match each element and concentration range quickly, simply, and reliably.
Results and Discussion
Using WD-XRF to Analyze Uninfected and Infected Wheat Gall Nematodes
Microscopic observations (3) have been performed to identify nematodes in the infected wheat grains that clearly indicated the presence of dead nematodes and fungal spores inside the wheat galls. Figures 2a and 2b depict the nematodes identified as A. tritici while Figures 2c and 2d show the silicified hairs on the galls. Further, Figures 2e and 2f show the features identified as the fungal spores helminthosporium and alternaria, which originated from air during storage of the wheat grains and caused further grain damage.
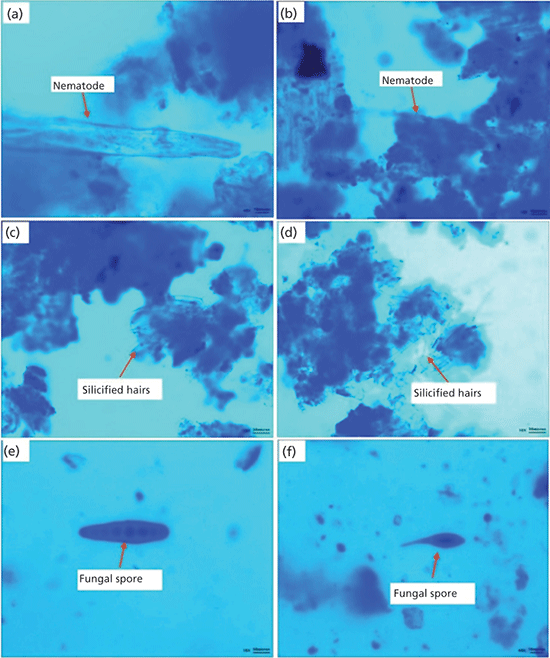
Figure 2: Anguina tritici (a, b), silicified hairs (c, d), helminthosporium (e), and alternaria (f). Adapted with permission from reference 3.
The typical overlapped WD-XRF spectra of uninfected wheat grain and seed gall nematode (low and high infection) wheat samples are shown in Figure 3 in different energy ranges. The relative intensities of the elements present in the uninfected, low infection, and high infection wheat samples are different, as can be seen in Figure 4, which indicates that their concentrations are different in different samples. The detected and quantified minerals in uninfected, low infection, and high infection wheat samples were potassium (K), sulfur (S), phosphorus (P), chlorine (Cl), calcium (Ca), magnesium (Mg), iron (Fe), silicon (Si), zinc (Zn), copper (Cu), sodium (Na), chromium (Cr), manganese (Mn), nickel (Ni), and aluminium (Al). The relative concentrations of these elements present in wheat samples are plotted in Figure 5. Among minerals, K, P, and S were predominant in uninfected grains as compared to Ca, Mg, Fe, Si, Cu, and Zn. The observed order of elemental concentration, particularly S, P, Ca, Mg, Fe, and Si, was found as follows: high infection wheat samples > low infected wheat samples > uninfected wheat samples. The concentration of K and Cl was highest in the low infection wheat sample. The concentration of Zn was higher for high infection wheat samples, a trend that may be correlated to the infection of grains caused by the nematodes. The elements Cr, Mn, and Ni were detected only in low infection and high infection wheat samples and they were completely absent in uninfected wheat samples which may be attributed to the activity of nematodes. Cu was only detected in uninfected and high infection wheat samples and was absent in low infection wheat samples. The mineral Na was only detected in low infection samples and Al was only detected in high infection wheat samples.
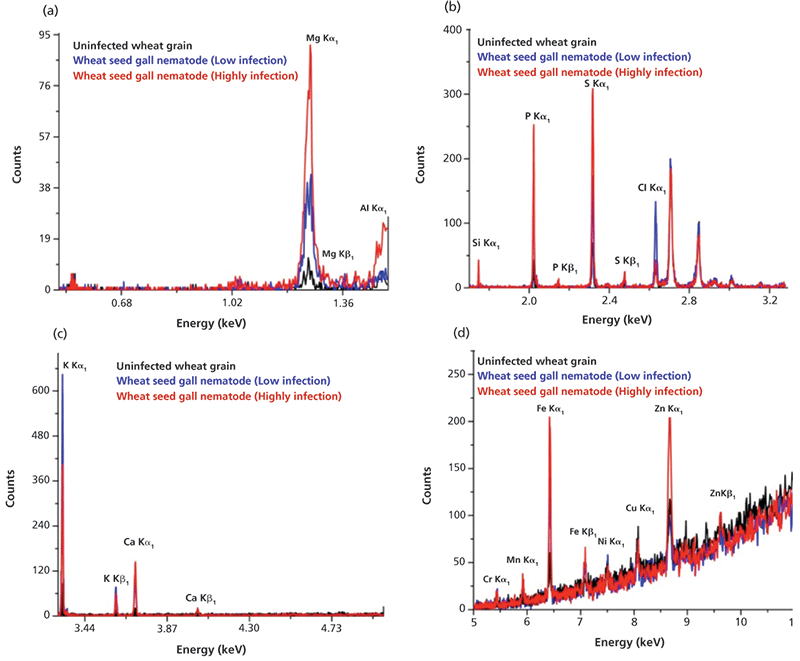
Figure 3: Typical WD-XRF spectra of uninfected and infected wheat grains in energy ranges (a) 0.5–1.5 KeV indicating the presence of Mg and Al; (b) 1.7–3.3 KeV indicating the presence of Si, P, S, and Cl; (c) 3.3–5 KeV indicating the presence of K and Ca; and (d) 5–11 KeV indicating the presence of Cr, Mn, Fe, Ni, Cu, and Zn. Adapted with permission from reference 3.
The toxic elements Al, Cr, and Ni were only detected in infected wheat samples and were not found in uninfected wheat samples. This result may be due to the presence of infected areas in grains because of the fungus and nematodes. The detected concentration of Al up to 600 ppm clearly indicated the toxic effect of Al in gall formation in wheat samples (7). Also, the presence of Cr and Ni at excessive levels in infected wheat samples were also the important reasons of gall formation in wheat grains. Thus, it was concluded that their presence was one of the factors leading to this disease and the formation of galls in wheat samples. The maximum concentration of Zn high infection wheat samples was responsible for the change in color of infected wheat samples from light brown to black. Along with WD-XRF, the authors also applied Fourier transform infrared (FT-IR) spectroscopy to study the molecular compositions of the infected and uninfected wheat grain samples. Diffuse reflectance measurements of uninfected and infected wheat samples were also used to identify spectral differences among wheat samples.
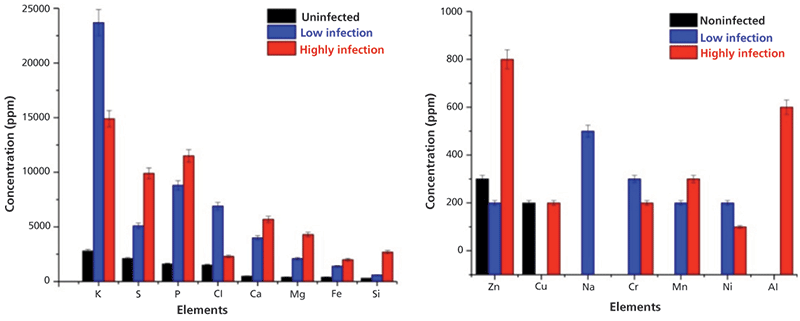
Figure 4: Bar diagrams showing the concentration of elements present in uninfected, low infection, and high infection wheat samples as measured using WD-XRF. Adapted with permission from reference 3.
The spectroscopic revolution has not only been regarded as the milestone for physical sciences, but also has opened the possibilities of new avenues in plant science and applied science. These findings underline the value of considerable supporting information using XRF spectrometry to avoid risks caused by microrganisms and are also helpful in avoiding damage to the environment, thus offering new investigation routes of agriculture- and disease-related issues.
Using WD-XRF to Analyze Minerals in Cyperus Rotundus Rhizomes
The high numbers of inorganic mineral elements present in nearly all plants ensure the successful growth and development of both vegetative and reproductive tissues. Currently, Fe, Zn, Mn, Cu, boron (B), Cl, molybdenum (Mo), and Ni have been recognized as micronutrients that are found at concentrations less than 0.01% of dry tissue weight (4). A few other minerals, such as cobalt (Co), sodium (Na), silicon (Si), selenium (Se), iodine (I), and vanadium (V), have also been shown to be essential and beneficial for certain plant species (4). Many other elements can be found in plants, but these are thought to enter plants nonselectively. Most of these nonessential elements confer no known benefit to the plant and many, such as cadmium (Cd) or Cr, are actually harmful to plant growth.
Cyperus rotundus Linn belongs to the Cyperaceae family and is widely distributed in many tropical and subtropical regions of the world. It is also known as purple nut sedge or nut grass and is a common weed found mostly in the fields, agricultural land, and moist waste land of all over India (4). The tubers of Cyperus rotundus have a wide range of medicinal and pharmacological applications. They are generally used as anthelmintic, aphrodisiac, diuretic, sedative, carminative, stimulant, tonic, and stomachic. They are also used as a remedy for renal colic and dysentery. Furthermore, the plant possesses different biological activities such as antioxidant, cytotoxic, antiallergic, antipyretic, anti-inflammatory, antiemetic, hypotensive, anticonvulsant, antimalarial, antimicrobial, antidiarrhoeal, antidiabetic, hepatoprotective, and insecticide (4).
The typical overlapped WD-XRF spectra of Cyperus rotundus samples are shown in Figure 5. The macro- and micronutrient minerals detected and quantified in Cyperus rotundus sample using WD-XRF were C, O, Na, Cl, Mg, Si, K, Ca, S, P, Al, Fe, Zn, Mn, Pd, Ru, Cr, Mo, Sr, Cu, and Ni. The concentrations of macronutrients Ca, Mg, K, P, and S were 0.36%, 0.46%, 0.38%, 0.20%, and 0.26%, respectively. The detected concentrations some micronutrients such as Al, Fe, Si, Na, and Cl were 0.06%, 0.05%, 0.42%, 0.8%, and 0.65%, respectively. Other micronutrients including some heavy minerals were detected at low levels ranging from 7 ppm to 44 ppm. The presence of elements found in Cyperus rotundus species were discussed in the literature (4). For the first-time, we used WD-XRF techniques to determine the macro- and micronutrient mineral contents of Cyperus rotundus rhizomes. Our results revealed that WD-XRF is a promising technique that is capable of analyzing plant samples with complex matrices used for medicinal purposes. Furthermore, the results obtained in the present paper show interesting prospects for WD-XRF to study plant samples. Other techniques, such as FT-IR and ultraviolet–visible (UV–vis) spectroscopy, have also been used for molecular analysis of cyperus rotundus, which revealed the capability of those techniques for the study of medicinal plants.
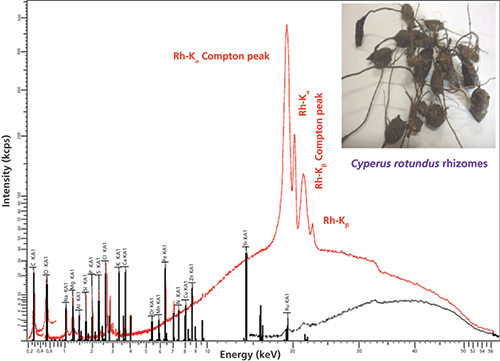
Figure 5: Typical WD-XRF spectrum of Cyperus rotundus (snapshot shown in inset) in different energy regions indicating the presence of macro- and micronutrient minerals. Details about spectral information can be found in reference 4.
Using WD-XRF to Analyze Heterogeneous Gallstones
Stone formation (gallstone and kidney stones) inside human organs are common diseases and constitute a major health problem worldwide (8–10). These stones are the result of a buildup of chemical particles in the gallbladder and kidneys, respectively. The chemical composition of stones is complex and varied. Trace elements are essential components of biological structures and are necessary for a multitude of vital functions in the human body. The precise role of trace constituents in the pathogenesis of stones is still unclear and under debate, but researchers are increasingly focusing on the role of trace elements in their pathogenesis (8–10). To understand the formation of these stones and their growth, it is important to study their chemical and elemental compositions as well as the function of the different elements as affected by the stone type. Determining and studying the chemical composition of stones is often among urologists' main means of shedding light on the pathogenesis of stones. Analytical techniques such as atomic absorption spectroscopy (AAS), scanning electron microscopy coupled with energy-dispersive X-ray spectroscopy (SEM-EDX), XRF, proton-induced X-ray emission (PIXE), X-ray diffractometry (XRD), Raman spectroscopy and microscopy, FT-IR spectroscopy, and laser-ablation inductively coupled plasma–mass spectrometry (LA-ICP-MS) are currently being used to answer questions about the composition of stones worldwide (8,9). Routine analysis in the field of medical science is still based on X-ray, ion-beam, and spectroscopic techniques. Each technique has its own merits and demerits. Most of the recently developed optical techniques such as laser-induced breakdown spectroscopy (LIBS) are based on the detection of the radiation emitted by the elements present in the biological samples (8–10).
The WD-XRF spectra of these gallstone samples have been recorded and analyzed thoroughly (for more details see references 5 and 6). The major, trace, and heavy elements detected and quantified in gallstone (GS1, GS2, and GS3) were Ca, Na, K, P, Mg, Mn, Zn, Na, Cu, Fe, P, S, Si, Cl, Al, Br, Pd, and Ru. The relative concentrations of these elements are shown in the bar diagram in Figure 6. The observed concentrations of the elements Ca, Mg, Na, Cl, P, and S were higher in comparison to other elements. All other heavy elements were detected at trace amounts (parts-per-million range).
The presence of Na and Cl in higher amounts is because of the daily dietary consumption of NaCl (in the form of salt) by the patients, which deposited in ionic form in the stones during the initiation precipitation stage of the stone formation. Ca was found to be the predominant nonorganic constituent in all gallstones, which behaves as a nidus for the gallstone formation. The presence of Ca in higher amounts is mainly because of the type of food and drinks the patients take, including diary and milk products, eggs, tea, and hard water (5,6). An iron-deficient diet might alter the metabolism of the hepatic enzyme, which later increases gallbladder bile cholesterol and promotes cholesterol crystal formation. Furthermore, the central aggregates of calcium salts constitute hard foreign bodies that may lead to ulceration of the gall bladder mucosa, microscopic hemorrhage, and inflammation. This releasing process may be another source of Fe deposition in gallstones (5,6). Manganese (Mn) was also significant in the studied gallstones. Manganese forms a salt with bile acid, which gets accumulated during cholelithiasis. Gallstones also show the presence of some elements like Pd, Ru, and other trace elements using WD-XRF which may be due to the different geographical locations of patients with gallstones, the dietary differences of the patients, and environmental pollution issues.
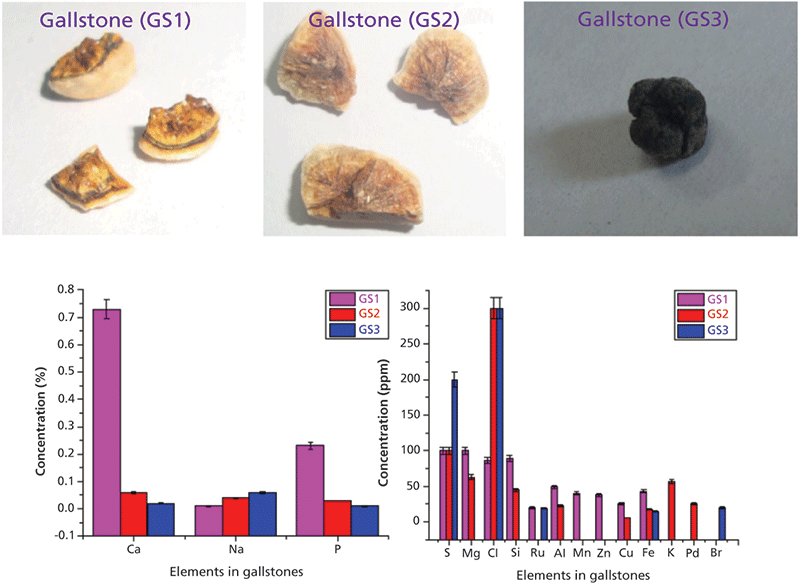
Figure 6: Gallstone samples and heavy and trace elements quantified using WD-XRF. Details and spectral information can be found in reference 5.
In addition, we have also applied FT-IR spectroscopy to study the major presence of cholesterol and bilirubin, as well as the minor presence of calcium carbonate and calcium phosphate in gallstones. Our results revealed that FT-IR and WD-XRF are promising techniques that are capable of analyzing stone samples present inside the human body. The results obtained with this study show interesting prospects of WD-XRF to study cholelithiasis better.
Using WD-XRF to Analyze Traces in Kidney Stones
Kidney stones are a painful and prevalent disorder of the urinary system that is seen in patients throughout the world; its prevalence has drastically increased, particularly in industrialized countries. These stones are small, hard mineral deposits that build up on the inner surface of the kidney and grow rapidly because of the trace minerals in contact. Some minerals inhibit the growth of stones and others strengthen their growth rate depending upon the stone type. Hence, in this situation trace analysis of kidney stones becomes important to know its pathogenesis for prevention. Quantitative analysis of the stones removed from the body can not only be very valuable methods for the treatment of disease, but also to avoid conventional 24-h urine tests, which are generally complicated and imprecise. Despite several investigations about the elemental composition of kidney stones, there is insufficient information with regard to the distribution of trace elements in these stones, especially within the different stone types. Therefore, the present study (11) investigated various factors that play a regulatory role in the pathogenesis of two different kinds of kidney stones-oxalate stones and struvite stones-by using WD-XRF spectrometry.
The images of the kidney stone samples (KS1, KS2, KS3, KS4, and KS5) analyzed are shown in Figure 7. Clinical details of the patients can be seen in reference 11. FT-IR spectroscopy was used to classify the stone samples. The FT-IR spectral data indicated calcium oxalate monohydrate (COM) as the major constituent and calcium phosphate as the minor constituents of the kidney stones and hence stones (KS1, KS3, KS4, and KS5) could be classified as oxalate stones. Stone sample KS2 was identified as a struvite stone with the major presence of magnesium ammonium phosphate (MAPH), calcium phosphate, and the minor presence of COM.
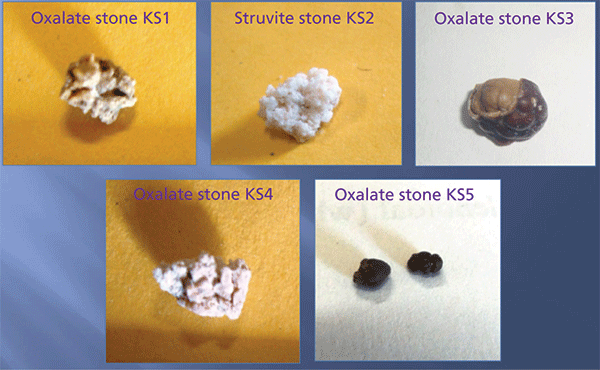
Figure 7: Photos of kidney stone samples. Adapted with permission from reference 11.
The WD-XRF studies were performed on these two kinds of samples. The elements determined in stone samples (KS1–KS5) were Ca, Mg, P, Na, K, Cl, S, Si, I, Ti, Fe, Ru, Zn, Al, Sr, Ni, Cu, and Br. The relative concentrations of these elements are shown as a bar diagram in Figure 8. Detailed analysis of FT-IR and WD-XRF spectral studies can be seen in reference 11. I (200 ppm) and Ti (69 ppm) were detected only in sample KS2 in low concentration. Fe was detected in all stone samples and its concentration was found to be nearly comparable in all stone samples. No measurable differences of the concentration of Fe in stone samples was observed. Strontium (Sr) was detected only in KS3 and KS4, and heavy elements such as Ni, Cu, and Br were detected only in the oxalate stone sample (KS3).
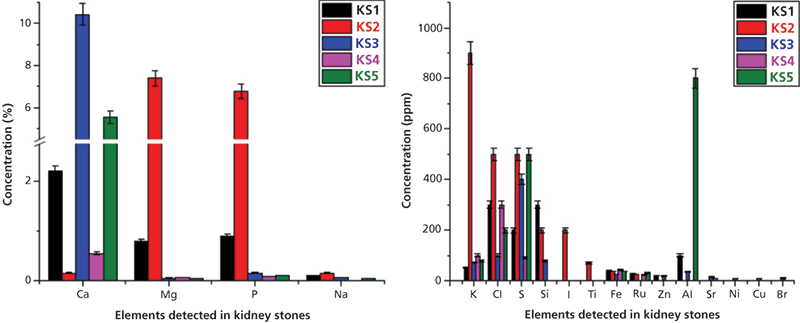
Figure 8: Relative concentrations of heavy and trace elements detected in kidney stones using WD-XRF spectrometry. Adapted with permission from reference 11.
The content of Mg and P was much higher in the struvite stone (KS2) than that of oxalate type stone samples (KS1, KS3–KS5). It is because of the stone matrix that magnesium ammonium phosphate (MgNH4.PO4.6H2O) is called struvite. Ca was detected in all stone samples and was the major constituent of all kidney stones. However, the concentrations of Ca (0.55–10.42%) in oxalate type stone samples were higher than that of struvite stone (~ 0.15%). The concentration of Na, K, and Cl were also higher in the struvite stone samples than that of oxalate type stones. This higher concentration may be because of the higher presence of NaCl and KCl in struvite stone samples and indicates their role in struvite stones. For the first time, we have detected ruthenium (Ru) in all stone samples (except sample KS3) in low concentrations (ranging from 22 to 30 ppm). No measurable difference has been observed for Ru among the stones. Zn was only observed in oxalate type stone samples (KS1 and KS3) in low concentration (up to 20 ppm). The presence of Ru and Zn only in some stones is probably due to the dietary differences of the patients. We have also compared our results from the reported literature value of kidney stones using the XRF technique and good agreements were found (11).
We detected a wide range of elements -Ca, Mg, P, Na, K, Cl, S, Si, I, Ti, Fe, Ru, Zn, Al, Sr, Ni, Cu, and Br-in kidney stone samples. The concentration difference of the elements present in stones samples may be due to the different dietary habits of patients (vegetarian or nonvegetarian) as well as their differing environmental and geographical regions. Here, the stones samples collected were from patients from various regions or states of India with differing dietary habitats (11). Particularly, the studied stone samples were collected from the patients who were vegetarian and nonvegetarian. Also the patients have some habitats of nephrotoxins such as herbominerals, chewing tobacco products, and drinking alcohol.
Meats, meat products, and eggs are good sources of essential minerals not limited to Fe, Cu, Mg, Zn, and toxic and heavy metal elements particularly Pb, Co, Ni, and Br (12). Also, tobacco is indigenous to many areas such as India, the Middle East, Southeast Asia, and the Americas (13). The tobacco samples (spit tobacco, gutkaas, and paan masalas) were found enriched with the presence of mineral elements such as Na, K, Ca, Cl, Mg, P, Cu, Fe, and Zn and traces of toxic and heavy elements, particularly As, Cr, Co, Al, Ni, and Br (13). In our study, some heavy and toxic elements such as Al, Cu, Ni, Br, and Sr were observed in the stone samples of patients with habits of chewing tobacco and meat products, which are potential sources of these heavy and toxic elements (13). The presence of toxic and heavy elements, particularly Ni, Br, and Cu, only in the KS3 stone sample may be due to the chewing habits because chewing samples were reported as enriched with these toxic elements (as mentioned earlier). Thus, it may be concluded that the presence of these elements in the samples may be due to chewing habits, alcoholic nature, and eating meat products. Along with these factors, the formation of stones in humans may also be influenced by the living style in a far more complex environment, drinking water, dietary differences, as well as genetic predisposition.
Conclusion
The spectroscopic revolution has not only been regarded as a milestone for physical sciences, but also has opened the possibilities of new avenues in plant science and applied sciences. We demonstrated several possibilities of using WD-XRF spectrometry for rapid analysis of some varieties of biologically important specimens such as wheat seed gall nematodes (Anguina tritici), cyperus rotundus, gallstones, and kidney stones. A significant advantage of this technique is that solid samples can be analyzed in their original unaltered condition, without undergoing pretreatment procedures. For the first time, we have successfully measured the concentrations of minerals such as K, S, P, Cl, Ca, Mg, Fe, Si, Zn, Cu, Na, and Mn in uninfected wheat grains along with some toxic elements such as Cr, Ni, and Al in infected wheat grains using WD-XRF. These findings underline the value of considerable supporting information through physical instruments to avoid risks caused by microorganisms and simultaneously help to avoid damage to the environment, thus offering new investigation routes of agriculture- and disease-related issues.
Using WD-XRF spectroscopy we have both analyzed and quantified a wide range of major and trace elements, including toxic elements in gallstones and kidney stones. We found the major differences between the elemental contents of calcium oxalate type stones and struvite stones. This study showed that the distribution and presence of elements in kidney stones are not only associated with geochemical factors but include environmental conditions and biology also. Occupations with higher insensible fluid losses, such as a hot environment, increase the risk of stone formation (14). The risk may also be higher when individuals have restricted access to water or bathroom facilities, leading to lower fluid intake and lower urine volume. In our study, the patients belong to different regions and different environments. In addition, dietary intake influences urine composition, thereby modifying the risk of nephrolithiasis. Heavy and toxic elements such as Al, Cu, Ni, Br, and Sr were found in the stones samples of the patients having habits of nephrotoxins (alcoholic, herbominerals, and chewing tobacco). In conclusion, the differences in the elemental concentrations in different stones may be correlated with the geographical, environmental, and dietary differences. More types of sample analysis is in progress by our research group.
WD-XRF is quite a suitable technique for in vitro quantitative analysis of both major and trace elements generally present in the samples of both gallstones and kidney stones. This technique has been applied uniquely to provide rapid qualitative and quantitative analysis of unknown environmental, biological, and medical samples including stone samples, in particular.
Acknowledgments
Vivek K. Singh is thankful to Mr. Tejbir Singh, in-charge WD-XRF Lab, SAIF, Punjab University, Chandigarh, India, facility for his valuable discussions and suggestions related to WD-XRF spectrometry and instrumentation. The author Dr. A.K. Pathak is grateful to University Grants Commission, New Delhi (F.No.8-4(57)/2015(MRP/NRCB) for financial assistance.
References
(1) M. West, A.T. Ellis, P.J. Potts, C. Streli, C. Vanhoof, and P. Wobrauschek, J. Anal. At. Spectrom. 31, 1706–1755 (2016).
(2) J.A. Anzelmo, M. Bouchard, and M.è. Provencher, Spectroscopy 28, 16–23 (2013).
(3) V.K. Singh, A. Devi, S. Pathania, V. Kumar, D.K. Tripathi, S. Sharma, D.K. Chauhan, V.K. Singh, and V. Zorba, Biocatal. Agric. Biotechnol. 9, 58–66 (2017).
(4) V.K. Singh, A. Gupta, O. Gupta, V. Kumar, and M.A. Gondal, Mat. Focu. 6, 7–14 (2016).
(5) B.B.S. Jaswal, J. Sharma, V. Kumar, Y. Khajuria, V.K. Singh, and P.K. Rai, Adv. Sci. Lett. 21, 2613–2617 (2015).
(6) B.B.S. Jaswal, V. Kumar, J. Sharma, P.K. Rai, M.A. Gondal, Bilal Gondal, and V.K. Singh, Lasers Med. Sci. 31, 573–579 (2016).
(7) N. Gupta, S.S. Gaurav, and A. Kumar, Am. J. Plant Sci. 4(12), 21–37 (2013).
(8) V.K. Singh and P.K. Rai, Biophy. Rev. 6, 291–310 (2014).
(9) A.K. Pathak, R. Kumar, V.K. Singh, R. Agrawal, S. Rai, and A.K. Rai, Appl. Spectrosc. Rev. 47, 14–40 (2012).
(10) V.K. Singh, V. Singh, A.K. Rai, S.N. Thakur, J.P. Singh, and P.K. Rai, Appl. Opt. 47, G38–G47 (2008).
(11) V.K. Singh, B.B.S. Jaswal, J. Sharma, and P.K. Rai, X-Ray Spectrom. 46, 283–291 DOI: 10.1002/xrs.2775 (2017).
(12) M.Z.A. Chowdhury, Z.A. Siddique, S.M.A. Hossain, A.I. Kazi, M.A. Ahsan, S. Ahmed, and M.M. Zaman, J. Bangladesh Chem. Soc.24, 165–172 (2011).
(13) A.N. Garg, R.P. Choudhury, R. Acharya, and A.V.R. Readdy, J. Radioanal. Nucl. Chem. 294, 197–202 (2012).
(14) L. Atan, C. Andreoni, V. Ortiz, E.K. Silva, R. Pitta, F. Atan, and M. Srougi, Urol. 65, 858–861 (2005).
Vivek K. Singh is with the Department of Physics at Shri Mata Vaishno Devi University in Jammu and Kashmir, India. Pradeep K. Rai is with the Department of Urology and Nephrology at Opal Hospital in Varanasi, India. Ashok K. Pathak is with the Department of Physics at Ewing Christian College, University of Allahabad in Allahabad, India. Durgesh K. Tripathi is with the Centre for Medical Diagnostic and Research (CMDR), MNNIT Allahabad in Allahabad, India. Subhash C. Singh is with The Institute of Optics at the University of Rochester in Rochester, New York. Jagdish P. Singh is with the Institute for Clean Energy Technology at Mississippi State University in Starkville, Mississippi. Direct correspondence to: vivekksingh2005@gmail.com
LIBS Illuminates the Hidden Health Risks of Indoor Welding and Soldering
April 23rd 2025A new dual-spectroscopy approach reveals real-time pollution threats in indoor workspaces. Chinese researchers have pioneered the use of laser-induced breakdown spectroscopy (LIBS) and aerosol mass spectrometry to uncover and monitor harmful heavy metal and dust emissions from soldering and welding in real-time. These complementary tools offer a fast, accurate means to evaluate air quality threats in industrial and indoor environments—where people spend most of their time.
NIR Spectroscopy Explored as Sustainable Approach to Detecting Bovine Mastitis
April 23rd 2025A new study published in Applied Food Research demonstrates that near-infrared spectroscopy (NIRS) can effectively detect subclinical bovine mastitis in milk, offering a fast, non-invasive method to guide targeted antibiotic treatment and support sustainable dairy practices.