Monitoring Spectral Irradiance and Color in Digital Displays
Application Notebook
Modular spectrometers and accessories can be configured into small-footprint systems for measuring the color and absolute or relative irradiance of light sources and displays. Ocean Optics systems are compact, flexible, and simple to deploy in various settings.
At a recent trade show, we showcased an experiment demonstrating the effectiveness of our Flame model spectrometer to monitor the color and spectral irradiance of digital displays.
About the Experiment
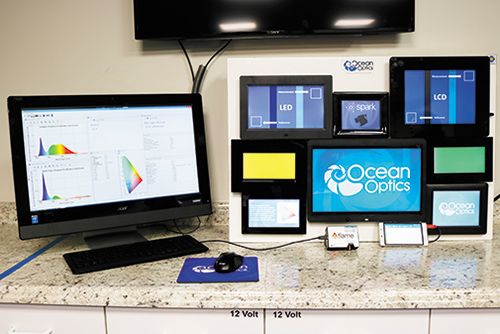
For the demo, we collected a handful of commercially available digital photo frames, taking care to select a combination of backlit LCD and LED displays, each with different dimensions and screen resolution performance (Figure 1). A radiometrically calibrated spectrometer (model Flame-S-RAD) with cosine corrector attached measured the output of the displays. OceanView spectroscopy software calculated color values, color difference, and power and photometry values.

Figure 1: In this demonstration, a radiometrically calibrated spectrometer with cosine corrector attached (foreground) measures the spectral output and color consistency of emissive displays.
As with a relative or absolute irradiance measurement, the spectrometer must be calibrated first. In the demo, our emissive color measurement began with an absolute irradiance measurement. Establishing an accurate scale for the spectrometer's response at each wavelength is essential to calculating color and power.
Determining Delta E Color Differences
Color consistency within samples requires color measurements that are repeatable from measurement to measurement. A well-defined method of comparing reflective or emissive color, either within a batch or to an acceptable standard, is also required. Ocean Optics color measurement systems offer both, providing the flexibility to configure the measurement system for various sample types and needs, as well as the software to perform quantifiable color comparisons.
Delta E is used to quantify the difference between two colors. A delta E (dE) less than or equal to 1.0 indicates that the human eye will perceive two colors as the same. As the dE increases above 1.0, the perceived difference in color increases. The calculation of delta E takes a subjective comparison of color and provides a quantitative value indicating how different the colors appear to the human eye. In some cases, depending on the application, less rigorous dE limits are set where the perception of slight differences in color is acceptable.
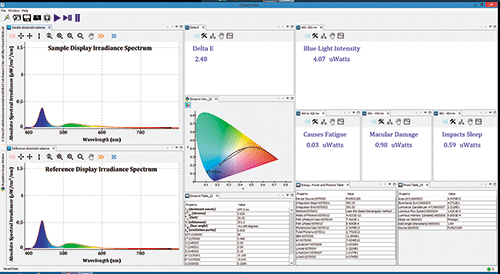
For this demo, we calculated the L*a*b* color difference of different locations within an emissive display as compared to a reference location within the same display (Figure 2). Also, that reference display could have been compared to the other displays in the demo setup. We could easily update the color reference reflection spectrum at any time during the measurements to calculate dE relative to a different color reference.

Figure 2: With spectral monitoring of emissive displays, the calculation of color parameters and blue light intensity is possible using Ocean Optics spectrometers and software.
Determining Display Intensity Output
Irradiance is the amount of energy at each wavelength emitted from a radiant sample. From that data, more specific photopic values can be calculated, including lumens, lux, and candela.
Measurements in absolute irradiance mode require calibration using a source with known power output. For the demo, we used a spectrometer that was radiometrically calibrated at the Ocean Optics calibration lab. The spectrometer came with a calibration file that allowed us to work in absolute irradiance mode.
The calibration process generates a file with energy response data for each pixel in the CCD, given in µJ/count. Factoring in the surface area of the sampling optic and the integration time allows irradiance measurements in µW/cm2 to be reported (power=energy/time).
Why use a cosine corrector as a sampling optic for a diffuse emissive source like a digital photo frame? The cosine corrector has a 180° field of view and samples any light incident on the diameter of its white diffusing surface, and specifically in that plane. Cosine correctors work well for measuring the power incident on a surface like a screen, in which case the corrector should be placed flush with that surface.
For the demo, we used the Absolute Irradiance mode in OceanView and selected the Photometry, Photons, Power and Energy wizard to calculate power and a range of other values. For calculating photometry values (lumens, lux, candela), the distance from the display surface must be taken into account.
Monitoring Blue Light Wavelengths
As part of our emissive displays demo, we monitored blue light in the 400–500 nm range. Blue light has shorter wavelengths and higher energy output than other visible light, so it reaches deeper into the eye. The cumulative effect of this exposure can cause damage to the eyes over time. Blue light exposure has increased with the move from incandescent lighting to compact fluorescent and LED lighting and with our constant exposure to digital screens.
Inspired by PupilBox (https://pupilbox.com), a Cincinnati, Ohio-based company that provides systems for protection from harmful blue light, we adjusted our spectrometer integration time to cover the blue light range and then reported the power values in uW for three criteria (Figure 2):
- Fatigue range (400–420 nm): eyes can become irritated, strained and tired
- Macular damage range (400–440 nm): may cause permanent damage to the retina
- Sleep range (460–484 nm): nighttime exposure can hinder melatonin production, disrupt circadian rhythms, and lead to trouble sleeping
Conclusions
Accurate measurement of spectral irradiance and emissive color of digital displays is an important application of spectroscopy, with several use cases:
- Maintaining color consistency in LEDs, LCDs, and other displays
- Calculating color differences within and among displays
- Determining the output of emissive devices at wavelengths associated with blue-light hazards
- Calculating photometry values (lumens, lux, candela)
- Determining the power output of emissive sources

Ocean Optics
8060 Bryan Dairy Rd., Largo, FL 33777
tel. (727) 733-2447
Website: www.OceanOptics.com

New Study Reveals Insights into Phenol’s Behavior in Ice
April 16th 2025A new study published in Spectrochimica Acta Part A by Dominik Heger and colleagues at Masaryk University reveals that phenol's photophysical properties change significantly when frozen, potentially enabling its breakdown by sunlight in icy environments.
Advanced Raman Spectroscopy Method Boosts Precision in Drug Component Detection
April 7th 2025Researchers in China have developed a rapid, non-destructive Raman spectroscopy method that accurately detects active components in complex drug formulations by combining advanced algorithms to eliminate noise and fluorescence interference.