Discrimination of Complex Substances with Laser-Induced Breakdown Spectroscopy
The authors present results obtained with two specialized LIBS systems. The data illustrate how LIBS and LIBS/Raman analyzers can answer a multitude of real-world needs for chemical analysis of various substances.

Laser-induced breakdown spectroscopy (LIBS) analysis begins with a focused laser beam that ablates the specimen (sample), generating a small spark. The light, optical emission from the spark, which contains spectral information about the composition of the sample, is collected by an optical system. These spectral data are analyzed for chemical identification. Although the LIBS spectra comprise mostly atomic emission lines, relative intensities and shapes of these lines depend upon the nature of the sample, and thus, LIBS can discriminate even compositionally similar molecular compounds. Such complex substance identification is achieved using chemometric algorithms to process and compare spectra against a preestablished database.
Despite the significant advantages of LIBS over other analytical techniques, it is used mainly by academia and research institutions largely due to the unavailability of commercial instruments dedicated to LIBS. However, this situation is changing swiftly as reliable, compact lasers and spectrometers have become readily available. Several commercial LIBS systems have entered the analytical instrumentation marketplace recently. Our data illustrate how LIBS and LIBS–Raman analyzers can answer a multitude of real-world needs for rapid chemical analysis of various substances.
Experimental
The experiments were performed using Applied Spectra's (Fremont, California) RT100-HP and RT100-B commercial LIBS systems. These similar instruments use different optical spectrographs. Both systems employ programmable intensified CCD cameras with timing control to select the gate width and delay for optimal instant detection of a range of spectrum acquired from a single laser shot. The RT100-HP system incorporates a high-performance Czerny-Turner spectrograph. This spectrograph has a dual grating turret, which allows users to choose a spectral window with relevant spectral resolution (200 nm at resolution of 0.8 nm; or 40 nm at resolution of 0.1 nm). The second instrument, RT100-B, incorporates a broadband echelle spectrograph that instantly acquires a wide span of spectrum covering 200–900 nm at resolution ~0.05 nm.
Both systems are housed in similar frames with dimensions 740 mm × 810 mm × 1370 mm and weight of 158 kg. Both have an autofocus function for focusing the optics on the sample surface for ablation and light collection. They include an automated xyz stage for sample positioning at a speed that ranges from 1 μm/s to 40 mm/s with resolution steps and repeatability of 0.1 μm. The main laser delivers 5-ns pulsed radiation up to 90 mJ (user-controlled optical energy per pulse) at 1064 nm. Operation at 532 nm and higher harmonics can be customized. The laser beam energy can be focused to a spot ranging from 10 μm to 500 μm in size, depending upon the desired application. A red diode laser beam serves as a visible guide, indicating the spot to be ablated. These instruments are rated as "Class I" laser products, and therefore, contain multiple safety features, such as an electronic interlock and an eye-protective filtering window that shields the ablation chamber.
Both LIBS models run integrated application software that features an intuitive user interface. The operator views an image of the analyzed samples on a computer monitor that receives data from an electronic color camera installed inside the sample load compartment. Operation of the hardware components (laser, spectrograph, ICCD camera, imaging camera, and sample stage) is controlled through the application software interface. An automated laser shutter ensures the operator's eye safety as well as facilitating exceptional stabilization of laser pulse energy (before ablating the sample, if so required) in a pulse train mode. The software includes an automated calibration program for accurate quantitative analysis. To assist with measurement decisions, the system provides a choice of recipes optimized for different sample matrices. Immediately after each test, the acquired spectra and measured data, along with the results of calculations (including statistics), are displayed on the screen.
The overall time required to complete an analysis is less than 10 s per sample. This time includes the quantification and statistical analysis of the spectroscopic data.
The chemometric algorithms tailored to the specifics of the LIBS spectra were developed at Applied Spectra and are available as separate supporting software.
Results and Discussion
One of the most pressing applications for LIBS is the detection of toxic metals in various matrices. For example, sensitive and rapid determination of lead remains a substantial challenge for other techniques. X-ray fluorescence (XRF) has often been the method of choice because this technique requires no lengthy sample preparation. However, XRF analysis can take 1 to ~10 min per sample in order to accumulate a detectable signal from low-parts-per-million concentrations of lead. And it can fail to detect even higher concentrations in samples that are less dense or in thin samples (< 0.5 mm) such as paint layers. X-rays penetrate through paint coatings but readily excite fluorescence from materials located underneath the target layer. Thus, in many instances, LIBS may be preferable as a rapid, accurate, sensitive, and inexpensive testing technique.
We used the RT100-B instrument to perform quantitative determination of lead in 12 solder materials. We analyzed several electric solders (obtained as coiled soldering wire), including high-lead solders, low-lead solders, lead-free solders, and silver- and antimony-bearing solders. We also analyzed thin solder platings printed on electronic circuit boards (solder leads and solder balls). Several representative LIBS spectra from different solders are shown in Figure 1. For these measurements, we used 20-mJ laser pulses focused to 100-μm ablation spots.
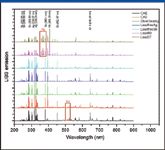
Figure 1: LIBS spectra obtained from different solder materials (high-lead, low-lead, and lead-free).
Even though there appears to be a substantial degree of similarity between the spectra in Figure 1, they are all individually unique. We applied a chemometric algorithm known as principal component analysis (PCA) to compare and categorize these spectra. The results are presented in Figure 2 as a projection of our data from a multicomponent space onto coordinates of the two first principal components. It is evident that distinguishing high-lead solders from low-lead solders is easily achieved in this way. Therefore, the simple task of classifying solders into high- or low-lead groups can be accomplished rapidly and without the need for standard calibration.
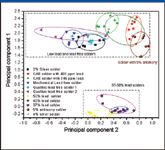
Figure 2: Results of the principal component analysis applied to the LIBS spectra of various solders (see the legend in this figure).
For quantitative measurements, the calibration was performed using reference samples with a range of lead concentrations in tin matrices. Figure 3 displays the results of calibration measurements that we performed using National Institute of Standards and Technology (NIST)-traceable reference materials. The data are presented both as lead emission intensity plotted versus lead concentration and as a ratio of Pb/Sn intensities versus the ratio of their concentrations. The intensities of the spectral lines at 405.8 nm (Pb) and 380.1 nm (Sn) from a single laser shot (no signal accumulation) were used. The detection limits varied from one solder type to another (matrix-dependent), but in all cases were at or below ~10 ppm as determined using the RT100-HP instrument.

Figure 3: Calibration results for quantitative determination of lead in tin-dominated matrices (solder materials). Certified standards were traceable to the standard reference materials from the National Institute of Standards and Technology (NIST).
To verify the accuracy of the quantitative determination of Pb in solder plating, a comparison of the results obtained with LIBS and inductively coupled plasma–atomic emission spectrometry (ICP-AES) was performed. The solder platings tested were those used in flash memory leadframe packages as connector leads. Three sets of 30 leadframe packages were analyzed by each method. For the ICP-AES measurements, the platings from the leads in 30 packages were all dissolved in an acidic solution, which was then introduced into the ICP-AES instrument. The solder platings on individual leads taken from the 30 packages from each of the same three batches were analyzed by LIBS, and the Pb concentrations were averaged within each batch. The results are presented in Table I and indicate that LIBS determination of Pb in solder plating correlates well with the ICP-AES measurements. The differences may be attributed to inaccuracy in quantifying the sampled masses in the two techniques.
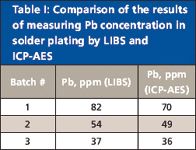
Table I: Comparison of the results of measuring Pb concentration in solder plating by LIBS and ICP-AES
The European Union's RoHS directive ("Restriction of the Use of Certain Hazardous Substances in Electrical and Electronic Equipment") limits lead content in any new equipment at a level < 1000 ppm. Thus, LIBS is a perfect means for electronics manufacturers to monitor and demonstrate their products' compliance. As we demonstrated earlier in the analysis of solders, identification of unknown solders is feasible using the PCA algorithm (or other chemometric procedures) based upon the unique LIBS signatures stored in the RT100-B instrument's database of spectra. Determination of the exact type of solder applied to electronic boards or other devices under repair is important. If a different solder is introduced and mixed with the older one in the course of refurbishing, then unwanted thermogalvanic effects may occur that degrade the device's performance (by introducing extra current and noise, and shortening device lifetime). Similarly, LIBS testing also can be used for the detection and identification of counterfeit electronic devices and parts.
Determination of lead in paint and children's toys is another important testing application. To examine the LIBS instrument's capabilities, we tested several toys and the five paint samples included in the NIST 2579e reference set. In these experiments, we used the RT100-HP device with 60-mJ laser pulses focused into ~150 μm ablation spots. A fragment of spectrum that includes emission lines of mercury and lead is presented in Figure 4. This spectrum was collected from a painted plastic material from one toy with alarmingly high lead content (0.18 mg/cm2). Also included in Figure 4 is a calibration plot for lead in painted plastic based upon the set of the NIST 2579e standard reference materials.
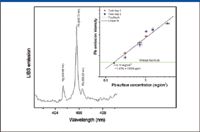
Figure 4: Fragment of the LIBS spectrum from a children toy and a calibration plot for the determination of lead in plastic.
The powerful capability of LIBS for depth profile analysis is illustrated in Figure 5. The intensity of lead emission was measured for a series of laser shots targeted at the same spot on the sample. Each consecutive laser pulse created a crater deeper and deeper in the sample. Therefore, the recorded series of spectra correspond to the consecutive layers of depth profiling. The ablation spot sizes were chosen the same as in previous experiments (~150 μm), but the beam energy was reduced to about 35 mJ for better depth resolution. Figure 5 displays the results of the depth profile analysis of different paint films laid on two children's toys. One toy had high-lead paint, while the other had low-lead paint, as it followed from the results of the analysis.
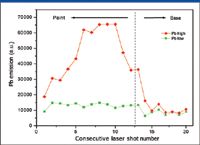
Figure 5: Results of the depth profile analysis of paint layers with different lead content.
The finest depth resolution in these paint measurements was ~0.5 μm. The limits of detection were determined as 15 ppm Pb and 70 ppm Hg by weight, which relate to surface concentrations of 0.1 and 0.6 μg/cm2, respectively. At present, the U.S. Consumer Products Safety Commission (CPSC) stipulates that lead content in paint or coatings in commercial products must be less than 600 ppm. Recently, the CPSC extended this requirement to cover any part of a children's product. For that reason, lead in commercial products must be monitored strictly, and LIBS provides an ideal tool for inspection.
To confirm that LIBS can discriminate effectively and identify complex organic samples, we analyzed several petroleum products: motor oil from various vendors (clean and used), diesel fuels, and fuel additives (lubricants, boosters, inhibitors). None of the non-LIBS methods currently used for fuel analysis is amenable to detection of particulate contaminants. Moreover, none of these methods can be applied on an as-needed basis in real time. Hence, LIBS holds great promise for convenient monitoring of proper fuel usage, storage, distribution, and injection of additives.
The petroleum samples were introduced for analysis as liquids contained in small, open cups. The broadband LIBS spectra of these products (including NIST Crude Oil reference material) were collected using the RT100-B instrument at about 40 mJ laser pulse energy. All spectra appear similar and are difficult to discriminate visually, but they can be computer-processed and categorized accurately. The spectra from these samples were dominated by oxygen, hydrogen, and carbon emissions, since these are major elements in organic substances. Minor elements found in the LIBS spectra of the tested petroleum products were calcium, magnesium, vanadium, and sodium, implying contamination by particulate matter from metal wear. The detection limits for metallic contaminants were estimated to be as low as ~10 ppm.
We compared the LIBS spectra from four commercial motor oil samples of popular 10W-30 grade made by Chevron, Shell, Valvoline, and Mobil. All of them produced strong atomic emission lines of O, N, and H, as well as diatomic emission bands of CN and C2. For discriminating the spectra, we used a partial least squares (PLS) algorithm. This chemometric algorithm takes into account the small differences in the intensities of major spectral features (O, N, H, CN, C2) and the substantial differences in trace constituents (additives, impurities) among the samples. The results of our tests are summarized in Table II. The numbers in the table characterize the similarity or dissimilarity of the test sample spectrum to the reference database spectra. An ideal match between reference and test spectra would be represented by unity. In practice, the values close to unity were considered a good match. It is evident from Table II that LIBS correctly identified all four oil samples with a high degree of confidence.

Table II: Results of the partial least squares (PLS) identification of the LIBS spectra of 10W-30 grade oil from four vendors: Chevron, Shell, Valvoline, and Mobil.
LIBS-based discrimination between new and used motor oil is an easier challenge than distinguishing different brands of motor oil. This is due to a significant increase in metal emission originating from metallic contaminants, mostly particulates, in used oil. Thus, LIBS serves as a tool to improve the efficiency and performance of motor vehicles by monitoring oil and fuel quality as well as the extent of metal wear in vehicular power systems.
Similar experiments confirmed the effectiveness of LIBS for categorizing other petroleum and additive components including diesel, cetane booster, icing inhibitor, lubricity improver, motor oil, methanol, and ethanol. The latter two substances exhibit very similar LIBS signatures, but the PLS algorithm discerns the subtle differences and identifies them correctly. All other samples also were identified correctly. The variations in LIBS spectra for materials with similar elemental compositions but different molecular structures are due to differences in the materials' light absorption and reflection properties and the different optical power requirements needed to break their respective molecular bonds. These and other mechanisms affect the laser-induced plasma formation and its physical state.
LIBS also can be an effective quality assurance and quality control technique. To illustrate this, we present our results on discriminating between high- and low-quality fiberglass coatings used in the automotive industry. It is expected that high-quality coatings, which meet strict technological requirements, will consistently display similar spectra, while unwanted deviations in physical and chemical properties of these coatings would cause related variations in the LIBS spectra. To verify this concept, we interrogated 10 fiberglass panels with a multitude of laser shots focused into 300-μm spots, making lateral steps ~0.5 mm across the surface of these samples. The PCA-processed results are illustrated in Figure 6. These results support the ability of LIBS to discriminate between the automotive industry's high- and low-quality fiberglass coating.
As clearly seen from the principal components plotted in Figure 6, the low-quality fiberglass coatings are characterized by significantly scattered data points in PCA coordinates, and those data deviate noticeably from the high-quality fiberglass data points. Data grouped closely to each other represent similar LIBS spectra, and therefore, similar coatings. The high-quality samples produced very consistent spectra taken in multiple locations across their surface. The low-quality samples lacked such consistency, and their spectra varied significantly with lateral position, indicating nonuniform properties of the coatings. Thus, the rapid chemometric analysis of LIBS-generated spectra can be utilized conveniently and profitably for real-time quality assurance and quality control in industrial fabrication (for example, fiberglass panels) and other fields.
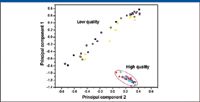
Figure 6: Results of the principal component analysis of the LIBS spectra collected from fiberglass panels. Different colors of the data points correspond to the different panels. The same color represents spectra obtained from the same panel at different locations.
The food industry also can benefit from the rapid product discrimination attainable with LIBS instruments. We proved that LIBS can analyze and categorize food products accurately, despite their complexity, in real time and without any chemical preparation. Using LIBS, we tested chicken tissues and bones, green herb leaves, and coffee beans. The results of chemometric discrimination between different coffee beans purchased from Peet's Coffee & Tea, Dunkin' Donuts, and Costco (Kirkland Columbian) are displayed in Figure 7. These results demonstrate how visually identical beans can be separated and immediately identified by their LIBS spectra.
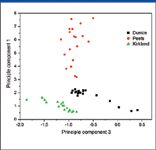
Figure 7: Discrimination of coffee beans based upon the principal component analysis of their LIBS spectra.
For pharmaceutical applications, our attempts to separate generic drugs from those with authentic brand names on the basis of their LIBS signatures had limited success. While LIBS generally was capable of discriminating these drugs, the random scatter of data was large; therefore, identification accuracy was rather poor (see the PCA results in Figure 8).
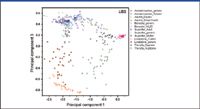
Figure 8: Principal component analysis of the LIBS spectra collected from generic and brand-name drugs.
To improve determination selectivity for the drugs, we collected Raman spectra excited at 532 nm, 20 mJ per laser pulse, in addition to those of LIBS. Raman spectroscopy yields combinatorial spectra involving vibrational frequencies of molecular or crystalline lattice structures, and therefore facilitates characterization of chemical composition of the samples. Thus, we processed the LIBS and Raman spectra entered together for each sample into our PCA algorithm procedure. The results are shown in Figure 9 using the same principal component coordinates as in Figure 8.
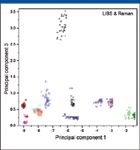
Figure 9: Principal component analysis of the combined LIBS and Raman spectra from the same drugs as in Figure 8 (see the legend in Figure 8).
A comparison of Figures 8 and 9 verifies that combining LIBS and Raman analysis yields a significantly more precise discrimination between generic and name-brand drugs. Raman spectroscopy is sensitive to different active ingredients in drugs, but it is ineffective in differentiating drug manufacturers because they all use the same active ingredients when making the drugs. For example, two aspirin produced by different vendors had identical Raman spectra of the same active substance of acetylsalicylic acid. However, the tablet fillers were somewhat different and this difference was perceptible in LIBS spectra. Merging LIBS with Raman spectra provided more effective discrimination than using either type of spectroscopy alone.
Conclusion
We have demonstrated that analytical LIBS can be used for fast and sensitive analysis of a wide variety of organic and inorganic materials without pretreatment of the samples. Localized microanalysis with lateral and depth profiling is easily realized. Either traditional, single-element calibration procedures or multivariate chemometrics can be applied for quantitative determination of elements in numerous samples. The chemometric algorithms provide a means for the rapid and accurate discrimination between different categories of samples, thus enabling their prompt identification.
Because of its advantages and cost-effectiveness, LIBS is poised to expand into the fields presently dominated by other analytical techniques, such as conventional optical emission and absorption spectrometry, X-ray fluorescence, FT-IR, and Raman spectroscopy. However, LIBS instruments have lower sensitivity and reproducibility relative to the more sophisticated analyzers such as inductively coupled plasma–atomic emission and mass spectrometers. The current limitations of LIBS are attributed to plasma variability in a spark produced by a 5-ns laser pulse, frequent unavailability of accurate matrix-matching standards, and inhomogeneity of the samples. In addition, self-absorption of spectral lines and a high continuum background can sometimes become the limiting factors.
Generally, LIBS is a universal technique (that is, any sample can yield a LIBS spectrum.) For the analysis of Raman-active materials, a combination of LIBS and Raman spectra collected together can offer significantly improved performance, as we demonstrated with discrimination of drugs. Integrating LIBS and Raman techniques into one analytical instrument is viable because both techniques involve similar hardware, software, and methodology.
Alexander A. Bol'shakov, Jong H. Yoo, Chunyi Liu, and Richard E. Russo are with Applied Spectra, Inc., Fremont, California.
References
(1) D.A. Cremers and L.J. Radziemski, Handbook of Laser-Induced Breakdown Spectroscopy (John Wiley & Sons, New York, 2006).
(2) A.W. Miziolek, V. Palleschi, and I. Schechter, Eds., Laser-Induced Breakdown Spectroscopy (LIBS), Fundamentals and Applications (Cambridge University Press, UK, 2006).
(3) J.P. Singh and S.N. Thakur, Eds., Laser-Induced Breakdown Spectroscopy (Elsevier, Amsterdam, Oxford, 2007).

LIBS Illuminates the Hidden Health Risks of Indoor Welding and Soldering
April 23rd 2025A new dual-spectroscopy approach reveals real-time pollution threats in indoor workspaces. Chinese researchers have pioneered the use of laser-induced breakdown spectroscopy (LIBS) and aerosol mass spectrometry to uncover and monitor harmful heavy metal and dust emissions from soldering and welding in real-time. These complementary tools offer a fast, accurate means to evaluate air quality threats in industrial and indoor environments—where people spend most of their time.
NIR Spectroscopy Explored as Sustainable Approach to Detecting Bovine Mastitis
April 23rd 2025A new study published in Applied Food Research demonstrates that near-infrared spectroscopy (NIRS) can effectively detect subclinical bovine mastitis in milk, offering a fast, non-invasive method to guide targeted antibiotic treatment and support sustainable dairy practices.
Smarter Sensors, Cleaner Earth Using AI and IoT for Pollution Monitoring
April 22nd 2025A global research team has detailed how smart sensors, artificial intelligence (AI), machine learning, and Internet of Things (IoT) technologies are transforming the detection and management of environmental pollutants. Their comprehensive review highlights how spectroscopy and sensor networks are now key tools in real-time pollution tracking.