Enhanced Sensitivity to Detect Phthalates by FT-IR Analysis
Application Notebook
Recent evidence that the phthalate plasticizers may cause health problems, particularly in children, has resulted in many countries prohibiting the use of phthalates in toys and clothing. The United States Child Safety Law actually prohibits the presence of several phthalate compounds at levels exceeding 0.1 wt % even though the commercial levels are often greater than 10%. While ATR spectroscopy works well for identifying phthalates at commercial levels, a more sensitive technique is required to detect trace levels.
Recent evidence that the phthalate plasticizers may cause health problems, particularly in children, has resulted in many countries prohibiting the use of phthalates in toys and clothing. The United States Child Safety Law actually prohibits the presence of several phthalate compounds at levels exceeding 0.1 wt % even though the commercial levels are often greater than 10%. While ATR spectroscopy works well for identifying phthalates at commercial levels, a more sensitive technique is required to detect trace levels.
We have created an approach where we produce a 500-µm thick film by hot pressing a sample and then acquire a transmission spectrum by measuring the infrared energy getting through the sample. This technique increases the sensitivity by almost a factor of 50, enabling the detection of phthalates below the 0.1 wt % level, if other additives in the plastic formulation do not cause spectral interference. However, we have observed that the success of the analysis at low levels is very dependent on the specific components present in the plastic.
In this application, a spectrum is acquired from the printed area on a T-shirt in less than a 10 s. We verify that the sample is a PVC plastisol by comparing the peaks in a specific region of the spectrum to those in a reference spectrum of PVC. A sophisticated match algorithm is applied to the peaks in a region specific to phthalates. When the presence of phthalates is confirmed, we produce the report shown in Figure 1, which clearly states that this area of the shirt contains phthalates
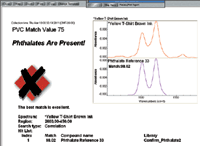
Figure 1: A warning report is created (red X) if the match value for phthalate is high.
When the match value for phthalate is low, the report states that the result is "inconclusive." The ATR measurement does not have the sensitivity to confirm that phthalates are not present above the 0.1 wt % limit and recommends that the operator try the hot pressed film technique or the GC–MS method suggested by U.S. Consumer Product Safety Commission.
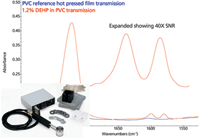
Figure 2: Thermo Scientific Universal Film Maker and the spectrum from a sample press into a 500-µm thick film accessory.
For thermoplastics such as polyethylene or PVC, heating a sample to the melting point and pressing a film is quite easy. Figure 2 shows the Thermo Scientific Universal Film Maker kit overlaid on a spectrum acquired from a 500-µm thick film. The scale expanded region is used to check for the presence of phthalates and reveals that the instrument sensitivity of the transmission spectrum is almost 50 times better than that obtained with the ATR technique. This provides the sensitivity to detect phthalates at the 0.1 wt % level. However, the technique also increases the intensity of any peaks resulting from the presence of other additives in the plastic and in some cases these will interfere with the peaks used to confirm the presence of phthalates which increases the standard error and the uncertainty of the results.
By producing samples with a known thickness (500 µm), creating a classical least squares (CLS) quantitative method to determine phthalate concentration is straightforward. One advantage of using a multivariate statistical analysis technique such as CLS is the availability of a standard error term. This term is based on the goodness of the curve fit between the sample spectrum and the spectra included in the CLS model. We recommend that the reported concentration be at least three times the standard error for a reliable result with high confidence. One of the major concerns related to the presence of phthalates is when small amounts of contamination are present in a plastic where the main plasticizer is an allowed substance such as DINCH (diisononyl cyclohexane-1,2 dicarboxylate) which is an approved plasticizer for use with polyvinyl chloride polymers produced by the company BASF. Figure 3 shows the results of applying our Thermo Scientific TQ Analyst software method to a spectrum that is the result of subtracting the spectrum from a hot pressed film of PVC containing DINCH as the plasticizer from a spectrum of the same material spiked with 0.24 wt % total phthalates.
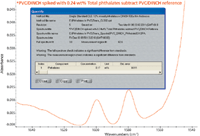
Figure 3: The results of applying a classical least squares quantitative analysis method to the spectrum of a sample containing 0.24 wt % total phthalates after subtracting a reference spectrum.
The SNR is excellent in the difference spectrum and the CLS method calculates a concentration of 0.17 wt % with a standard error of 0.011. The sample would fail the screen because the phthalate concentration is above the wt % allowed by law.
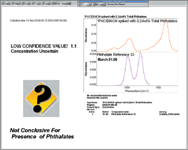
Figure 4: The yellow question mark indicates that the measure concentration is leass than three times the reported standard error.
If we do not subtract out the spectral features from the plastic reference, we still get a concentration of 0.18 wt % but the standard error term has increased to 0.16 wt %. Based on the higher standard error we would report that this result to be "inconclusive" even though the calculated concentration is the same. This report is shown in Figure 4. The only case where a sample will pass the screen is when the calculated concentration is below 0.1 wt % and the standard error is below 0.033 wt %. When this occurs, the report shown in Figure 5 is produced.
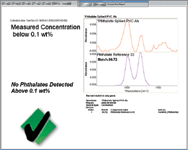
Figure 5: The green check mark indicates that the measured concentration is less than 0.1 wt % as had a standard error below 0.033 wt%.
Based on our present research we have chosen to report that we are confident no phthalate is present above 0.1 wt % and to not report either the calculated concentration or the standard error.
Thermo Fisher Scientific
5225-4 Verona Rd, Madison, WI 53711
tel. (800) 532-4752
Website: www.thermo.com

Thermo Fisher Scientists Highlight the Latest Advances in Process Monitoring with Raman Spectroscopy
April 1st 2025In this exclusive Spectroscopy interview, John Richmond and Tom Dearing of Thermo Fisher Scientific discuss the company’s Raman technology and the latest trends for process monitoring across various applications.
A Seamless Trace Elemental Analysis Prescription for Quality Pharmaceuticals
March 31st 2025Quality assurance and quality control (QA/QC) are essential in pharmaceutical manufacturing to ensure compliance with standards like United States Pharmacopoeia <232> and ICH Q3D, as well as FDA regulations. Reliable and user-friendly testing solutions help QA/QC labs deliver precise trace elemental analyses while meeting throughput demands and data security requirements.